

Article Figures & Data
Figures
- Figure 1.
WT mice displayed circadian rhythm in contrast sensitivity but not in visual acuity (as defined by spatial frequency threshold). A, In the LD cycle, contrast sensitivity was significantly rhythmic in WT mice (two-way ANOVA, spatial frequency × time interaction, F(5,37) = 45.194, p < 0.001; *p < 0.001, SNK post hoc test; n = 4–6 mice). B, In DD2, contrast sensitivity was significantly rhythmic in WT mice (two-way ANOVA, spatial frequency × time interaction, F(5,34) = 67.866, p < 0.001; *p < 0.001, SNK post hoc test; n = 4–6 mice). C, Visual acuity measurements were not different between mid-day and mid-night time points (n = 9–10 mice). Data are expressed as the mean ± SEM.
- Figure 2.
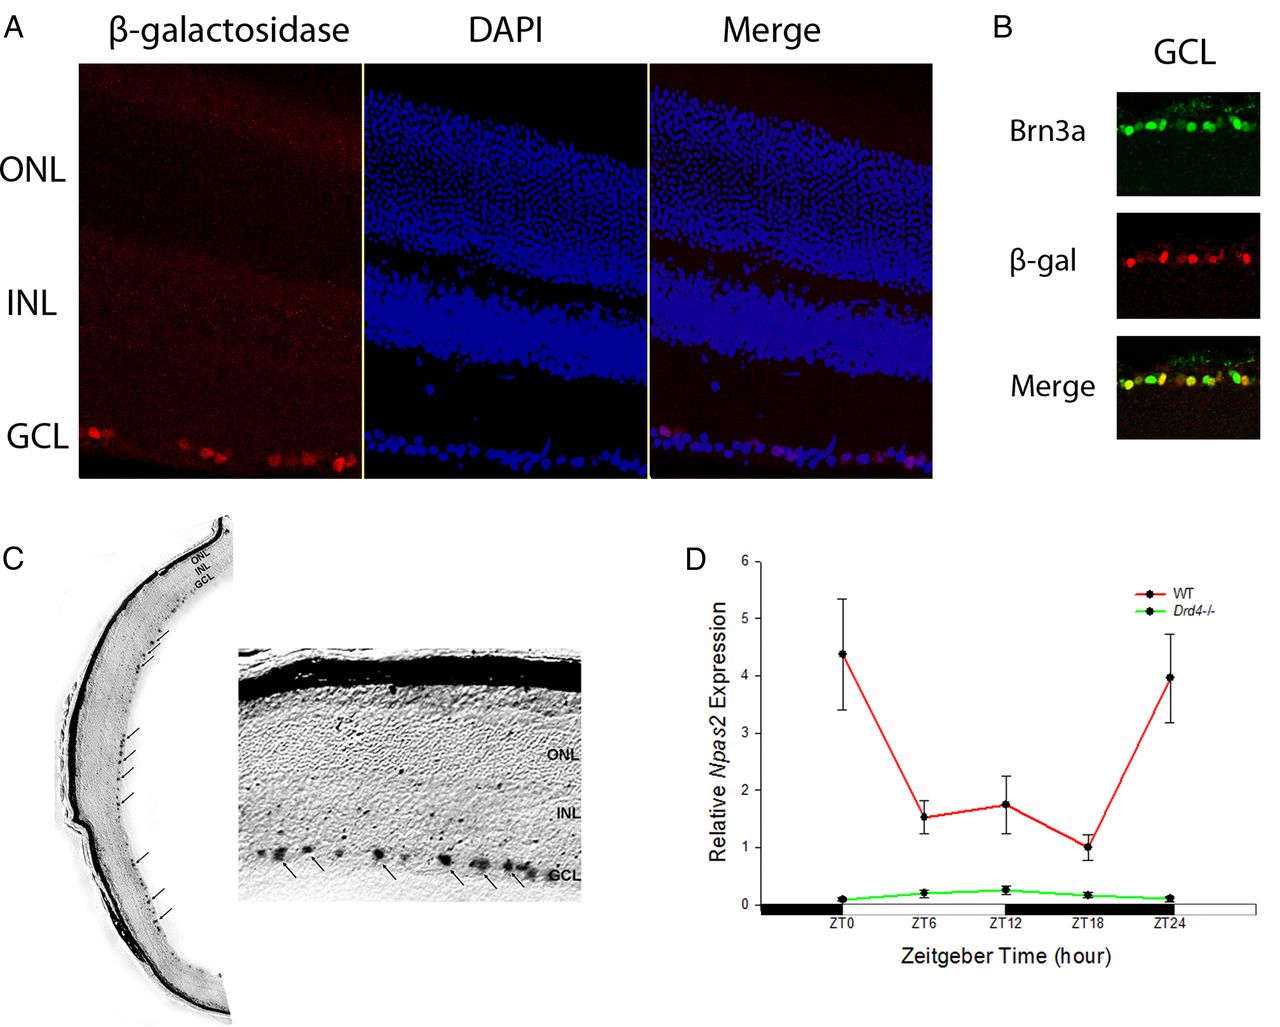
NPAS2 is rhythmically expressed in retinal ganglion cells. A, Immunofluorescence staining shows NPAS2-β-galactosidase (red) localized to the GCL. B, Immunofluorescence staining shows NPAS2-β-galactosidase (red) colocalizing with retinal ganglion cell marker Brn3a (green). C, LacZ histochemical staining is localized to the GCL. D, Npas2 transcript in the GCL of WT mice (red) is robustly rhythmic (one-way ANOVA, F(4,25) = 4.541, p = 0.007), but in Drd4−/− mice (green) it was arrhythmic and barely detectable (one-way ANOVA, F(4,18) = 0.1.584, p = 0.222; two-way ANOVA, D4 receptor deficiency × time interaction, F(4,41) = 5.802, p < 0.001). Data are expressed as the mean ± SEM. n = 5–6 mice per time point.
- Figure 3.
Drd4−/−, Npas2−/−, and Adcy1−/− mice display similar deficiencies in visual parameters in the LD cycle. A–C, Contrast sensitivity is rhythmic but reduced in Drd4−/− mice (two-way ANOVA, D4R deficiency × time interaction, F(5,25) = 5.802, p < 0.001; *p < 0.001, SNK post hoc test; n = 4–6 mice; A), Npas2−/− mice (two-way ANOVA, NPAS2 deficiency × spatial frequency interaction, F(5,25) = 19.276, p < 0.001; *p < 0.001, SNK post hoc test; n = 4–6 mice; B), and Adcy1−/− mice (two-way ANOVA, AC1 deficiency × spatial frequency interaction, F(5,25) = 45.067, p < 0.001; *p < 0.001, SNK post hoc test; n = 4–6 mice; C). There was a significant reduction in mid-day contrast sensitivity at multiple spatial frequencies in Drd4−/−, Npas2−/−, and Adcy1−/− mice (*p < 0.001, SNK post hoc test; n = 4–6 mice), while the mid-night contrast sensitivity was preserved. D, As in WT mice, visual acuity measurements (as defined by spatial frequency thresholds) were normal and arrhythmic in Npas2−/−, Adcy1−/−, and Drd4−/− mice (n = 6–8 mice) in the LD cycle. Data are expressed as the mean ± SEM.
- Figure 4.
A–C, Drd4−/− (A), Npas2−/− (B), and Adcy1−/− (C) mice display similar deficits in mid-day contrast sensitivity in DD2. Compared with controls, contrast sensitivity is rhythmic but reduced in Drd4−/− mice (two-way ANOVA, D4R deficiency × spatial frequency interaction, F(5,25) = 45.067, p < 0.001; *p < 0.001 at 0.03, 0.064, 0.092, and 0.103 cycles/°, SNK post hoc test; n = 3–6 mice), in Npas2−/− mice (two-way ANOVA, NPAS2 deficiency × spatial frequency interaction, F(5,34) = 46.215, p < 0.001; *p < 0.001 at 0.03, 0.064, 0.092, and 0.103 cycles/°, SNK post hoc test; n = 3–6 mice), and in Adcy1−/− mice (two-way ANOVA, AC1 deficiency × spatial frequency interaction, F(5,24) = 94.952, p < 0.001; *p < 0.001 at 0.03, 0.064, 0.092, and 0.103 cycles/°, SNK post hoc test; n = 3–6 mice). There was a significant reduction in mid-day contrast sensitivity at multiple spatial frequencies in Npas2−/−, Adcy1−/−, and Drd4−/− mice (*p < 0.001 at 0.03, 0.064, 0.092, and 0.103 cycles/°, SNK post hoc test; n = 4–6 mice), while the mid-night contrast sensitivity was preserved (for both Adcy1−/− and Drd4−/− mice; *p < 0.05 only at 0.272 cycles/°, SNK post hoc test; n = 4–6 mice). Data are expressed as the mean ± SEM.
- Figure 5.
Adcy1 transcript rhythms in different retinal layers and whole retinas of WT, Npas2−/−, and Drd4−/− mice. A, In WT mice, Adcy1 transcripts are robustly rhythmic the in GCL (solid red; one-way ANOVA on ranks, H4 = 15.548, p = 0.004) and PRL (short-dashed red; one-way ANOVA, F(4,23) = 18.627, p < 0.001), but not in the INL (long-dashed red). B, Adcy1 transcripts are arrhythmic and stay at low levels in the GCL of Npas2−/− (green; one-way ANOVA, F(4,20) = 0.975, p = 0.443; two-way ANOVA, NPAS2 deficiency × time interaction, F(4,40) = 6.809, p < 0.001) and Drd4−/− mice (blue; one-way ANOVA, F(4,18) = 0.644, p = 0.638; two-way ANOVA, D4 receptor deficiency × time interaction, F(4,38) = 5.082, p = 0.002). C, In the PRL of Npas2−/− mice, the Adcy1 transcript expression (green) is rhythmic and not significantly different from WT (red) (one-way ANOVA, F(4,19) = 4.092, p = 0.015; two-way ANOVA, NPAS2 deficiency × time interaction, F(4,42) = 2.760, p = 0.055). In the PRL of Drd4−/− mice (blue; one-way ANOVA, F(4,18) = 0.896, p = 0.487; two-way ANOVA, D4R deficiency × time interaction, F(4,41) = 7.270, p < 0.001), the Adcy1 transcript expression is arrhythmic and stays at low levels. D, The rhythmic expression of Adcy1 transcripts in the whole retina is not significantly different between WT and Npas2−/− mice (p = 0.407, two-way ANOVA). Data are expressed as the mean ± SEM. n = 5–6 mice per time point.
- Figure 6.
Regulation of mAdcy1 promoter by NPAS2/BMAL1. A, Luciferase reporter plasmids containing either a 610 bp mAdcy1 promoter (mAdcy1 610), which contains a circadian E-box, or a circadian E-box lacking 280 bp mAdcy1 promoter (mAdcy1 280), was used for the luciferase activity assays. NPAS2/BMAL1 activated mAdcy1 promoter (*p < 0.001 vs empty plasmid transfected control group), and the deletion of the circadian E-box region substantially reduced the luminescence level. B, Insertion of the circadian E-box into the mAdcy1 280-luc vector (mAdcy1 b280) confers high luciferase activity with NPAS2/BMAL1 (*p < 0.001 vs empty plasmid transfected control group), while insertion of a mutated circadian E-box into the mAdcy1 280-luc vector (mAdcy1 m280) had no effect. C, Adcy1 promoter activation by NPAS2/BMAL1 was dose dependent. The activation of the 610 bp Adcy1 promoter increased with higher levels of expression vectors (in micrograms) of NPAS2 and BMAL1. The presence (+) or absence (−) of the reporter and expression plasmids is shown. All values are the mean ± SEM (n = 3). Representative data of at least three independent experiments.
- Figure 7.
A model for mid-day contrast sensitivity regulation. Dopamine, through a D4 receptor pathway, regulates the rhythmic expression of Npas2 in the GCL. NPAS2 in the retinal ganglion cells regulates the rhythmic expression of the Adcy1 gene in the GCL, which ultimately modulates daytime contrast sensitivity.


