

Article Figures & Data
Figures
- Figure 1.
Voxelwise category encoding model. To construct the basis for the category model, the salient object and action categories in each 1 second epoch of movies were labeled using 1705 unique terms from the WordNet lexicon (Miller, 1995). The stimulus time courses were constructed in matrix form, with rows and columns representing distinct categories and epochs, respectively. Regularized linear regression was used to describe individual voxel responses as a weighted sum of these time courses. The fit model weights characterize the category responses of individual voxels to the corresponding object and action categories.
- Figure 2.
Significance of tuning for nonface categories and of heterogeneous category tuning. a, Separate voxelwise face-presence models were fit to assess the significance of tuning for nonface categories. The face-presence model captured responses to the graded presence of faces in the movies (see Materials and Methods). The full category model (i.e., including 1705 categories) was compared with the face-presence model in terms of response predictions. Bar plots show the percentage difference in explained variance across the population of FFA voxels for subjects S1–S5 (mean ± SEM). The full model increases the explained variance in each subject (p < 10−4, bootstrap test). This result indicates that tuning for nonface categories is significant. b, A separate control analysis was performed to assess the significance of heterogeneous category tuning within FFA. The full category model for each voxel was compared with an aggregate model obtained by averaging the voxelwise models across the remaining voxels. Bar plots show the percentage difference in explained variance across the population of FFA voxels for subjects S1–S5 (mean ± SEM). The voxelwise models increase the explained variance in each subject (p < 10−4, bootstrap test). This result indicates that the heterogeneity of category tuning among FFA voxels is significant.
- Figure 3.
The number of clusters. A stability-based validation technique was used to determine the optimal number of clusters for multiple FFA definitions based on varying localizer thresholds: a, p < 1 × 10⁻⁶. b, p < 5 × 10⁻⁶. c, p < 1 × 10⁻⁵. d, p < 5 × 10⁻⁵. e, p < 1 × 10⁻⁴. For each FFA definition, the cluster stability was determined separately for several numbers of clusters (k). This validation technique measures the cluster stability against random perturbations in the dataset. Specifically, stability was measured as the similarity of clustering solutions that are performed on random subsamples (i.e., 80%) of FFA voxels pooled across subjects. The pairwise similarities (J) between the clustering solutions were histogrammed to generate the cumulative distribution functions (CDFs) shown in the left column. If the solutions are stable, then the distributions will be concentrated around 1. If the solutions are instead unstable, the distributions will be widespread. Thus, the optimal number of clusters can be identified by a sudden transition from narrow to more widespread distributions. To detect such transitions, we calculated the percentage of similarity measurements that were below a high similarity threshold (i.e., J < 0.8) for each number of clusters. The differences in this percentage value between consecutive numbers of clusters are plotted in the right column. The optimal number of clusters was determined as the point where the difference in maximized (green dot).
- Figure 4.
Similarity of cluster centers across subjects. To examine whether the functional subdomains within FFA are consistent across subjects, clustering analysis was performed for each subject individually. The cluster centers computed in individual subjects were compared across subjects and compared with the group cluster centers. Similarity measurements were performed between cluster centers estimated separately from responses to the first and second halves of the movies. FFA voxels were defined using a localizer threshold of p < 10−4. The similarities (as measured by correlation) of cluster centers are displayed with separate matrices. The row and column labels identify the group (All) and individual-subject (S1, S2, S3, S4, and S5) cluster centers. The color scale ranges from black for negative correlation (−1) to white for positive correlation (1). The group and individual-subject cluster centers are quite similar (p < 10−4, bootstrap test). This indicates that the functional heterogeneity within FFA is reliable for individual subjects and consistent across subjects.
- Figure 5.
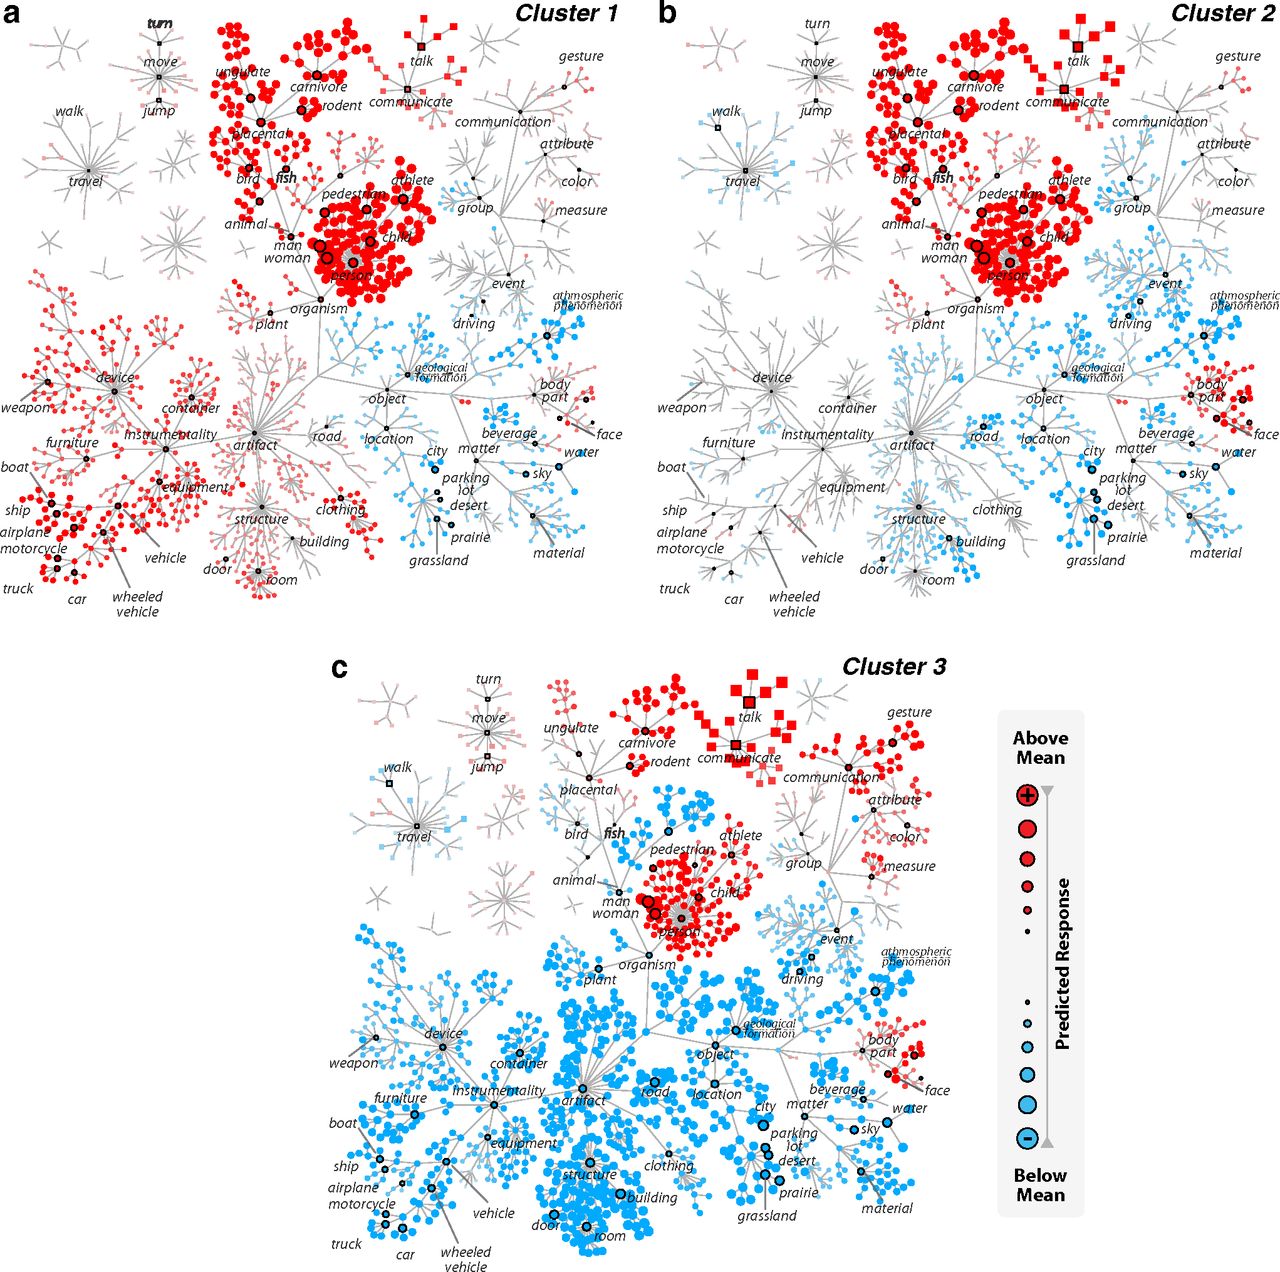
The cluster centers. Spectral clustering analysis among FFA voxels reveals three functional subdomains. a–c, Mean tuning profiles across voxels within each cluster are shown using a series of graphs for object (main tree, circular vertices) and action (smaller trees, square vertices) categories. Subsets of the categories are labeled to orient the reader. The size of each vertex indicates the magnitude, whereas its color indicates the sign (red represents +; blue represents −) of the category response (see legend). a, Responses of the first cluster are strongly enhanced by humans and animals and weakly enhanced by man-made instruments, including vehicles (p < 0.05, Monte Carlo test, FDR corrected). b, Responses of the second cluster are strongly enhanced by humans and animals (p < 0.05) and weakly enhanced by body parts and communication verbs, including primary faces (faces that are the most salient object in the scene). c, Responses of the third cluster are strongly enhanced by humans, placental mammals, communication verbs, gestures (i.e., facial gestures), and faces but strongly suppressed by man-made artifacts, particularly structures, such as buildings and rooms (p < 0.05). Responses of all three clusters are suppressed by many natural objects, such as geological landscapes and natural materials (p < 0.05).
- Figure 6.
Response levels to object and action categories in each cluster. The responses of each cluster to eight distinct categories were computed, including humans, animals, body parts, communication, vehicles, structures (e.g., building, room), natural materials (e.g., water, soil), and geographic locations (i.e., mountain, city). The response to each category was computed as the mean response to all of its subordinate categories. Individual voxel responses were averaged within each cluster to compute the average category responses (mean ± SEM, across voxels within each cluster). The first cluster is broadly tuned for humans, animals, and vehicles. The second cluster is tuned for humans and animals. Finally, the third cluster is tuned for humans, body parts, and communication.
- Figure 7.
Spatial distribution of clusters. The spatial distribution of clusters shown in the volumetric brain spaces of individual subjects (S1–S5). FFA voxels were defined using a localizer threshold of p < 10−4. Separate clusters are labeled with blue, green, and red colors overlaid onto anatomical images (see legend). Consecutive axial slices at the ventral occipitotemporal areas are grouped in montage format. The clusters are spatially segregated in the brain space of each subject (p < 10−5 for S1–S3 and S5, p < 0.02 for S4, bootstrap test). The first cluster that has the strongest tuning for instruments, vehicles, and structures among the three clusters is located anteriorly relative to the remaining clusters, and closer to regions along the ventral collateral sulcus that are assumed to be selective for scenes with man-made structures (p < 10−4, bootstrap test). The second cluster that has the strongest tuning for humans and animals is located posteriorly and closer to regions along the middle temporal sulcus that are known to be selective for animate motion and bodies (p < 10−4). Last, the third cluster that has the strongest tuning for communication verbs and human body parts and weakest selectivity for animals is located centromedially (p < 10−4). There is no significant hemispheric lateralization for any of the three clusters (p > 0.34, bootstrap test).
- Figure 8.
PCA. To assess the important dimensions of category tuning, a PCA was performed across tuning profiles of FFA voxels. The tuning profiles were pooled across subjects before PCA. The first three PCs account for 55.8 ± 8.6% (mean ± SD across subjects) of the variance in category responses of FFA voxels (first PC, 32.1%; second PC, 12.0%; third PC, 11.9%). These PCs are presented in separate graphs, each formatted as in Figure 5. a, The first PC is broadly tuned for categories that appear in civilized contexts, such as humans, animals, vehicles, indoor spaces, roads, and devices (p < 0.05, Monte Carlo test, FDR corrected). b, The second PC distinguishes categories related to living things and their interactions, such as animals, humans, body parts, and communication verbs from nonliving categories, such as vehicles, indoor spaces, devices, and events (p < 0.05). c, The third PC distinguishes people from animals and nonliving categories, including vehicles and devices (p < 0.05).
- Figure 9.
Projections of voxelwise tuning profiles onto PCs. To independently assess the functional heterogeneity in FFA, voxelwise tuning profiles were projected onto the first two PCs. Each point in these plots corresponds to a distinct voxel. Voxels assigned to distinct clusters by the spectral clustering analysis are annotated with a unique shape-color combination (see legend). Voxels in separate clusters have segregated distributions in the PC space as well. The first and second PCs distinguish voxels in the first and second clusters. In contrast, the second PC primarily distinguishes the third cluster from the rest. Therefore, the group structure revealed by the clustering analysis can be more confidently interpreted as a reflection of functional subdomains within FFA.
- Figure 10.
Cortical flatmaps of category tuning within and outside FFA. To examine the cortical distribution of category tuning within and outside FFA, voxelwise tuning profiles were projected onto the first three PCs measured from tuning profiles of FFA voxels (Fig. 8). Top row, Projections of tuning profiles onto the 3D space defined by PCs 1–3 are shown for subjects S1–S3. Projections onto the first, second, and third PCs determined the value of the red, green, and blue channels, respectively (p < 0.05, χ2 test, FDR corrected). Here, voxels with similar category tuning have similar projections onto the PCs and are assigned similar colors (see legend). Insignificant voxels are shown in gray (p > 0.05). Category tuning is heterogeneously distributed within FFA. Individual FFA voxels are tuned for humans, artifacts, animals, gestures, and verbal communication. Bottom row, Projections of tuning profiles onto individual PCs are shown with separate cortical flatmaps for subject S2 (Fig. 15 for remaining subjects). Voxels with positive projections appear in red, and voxels with negative projections appear in blue (see legend). Brain areas identified using functional localizers are annotated with white lines and labeled (PPA; EBA; FBA, fusiform body area; OFA, occipital face area). Major sulci are denoted with black lines and labeled (CoS; ITS; MTS). Regions of fMRI signal dropout are indicated with dark gray patches. Voxels in areas along CoS (e.g., PPA) and the medial bank of ITS have positive projections onto the first PC. Voxels in areas along MTS (e.g., EBA) and the lateral bank of ITS have positive projections onto the second PC. Finally, voxels in areas along ITS, located centrally within FFA, have positive projections onto the third PC. These patterns suggest that broader gradients of category tuning across ventral–temporal cortex underlie the organization of the functional subdomains within FFA.
- Figure 11.
Temporal stimulus correlations between categories in natural movies. To assess whether category models are biased by stimulus correlations present in natural movies, PCs of category model weights were compared with stimulus PCs. To account for temporally lagged stimulus correlations, multiple delayed stimulus time courses were generated for each category using lags from −5 to 5 s. The delayed time courses for all categories were concatenated to form a stimulus matrix. Stimulus PCs were obtained from this matrix. Line plots show the mean explained variance and 68th percentile bands across the population of FFA voxels. Model PCs account for a significantly larger proportion of variance in the model weights compared with stimulus PCs (p < 10−4, bootstrap test), regardless of the number of PCs used. This result indicates that the category model weights are not biased by category co-occurrences.
- Figure 12.
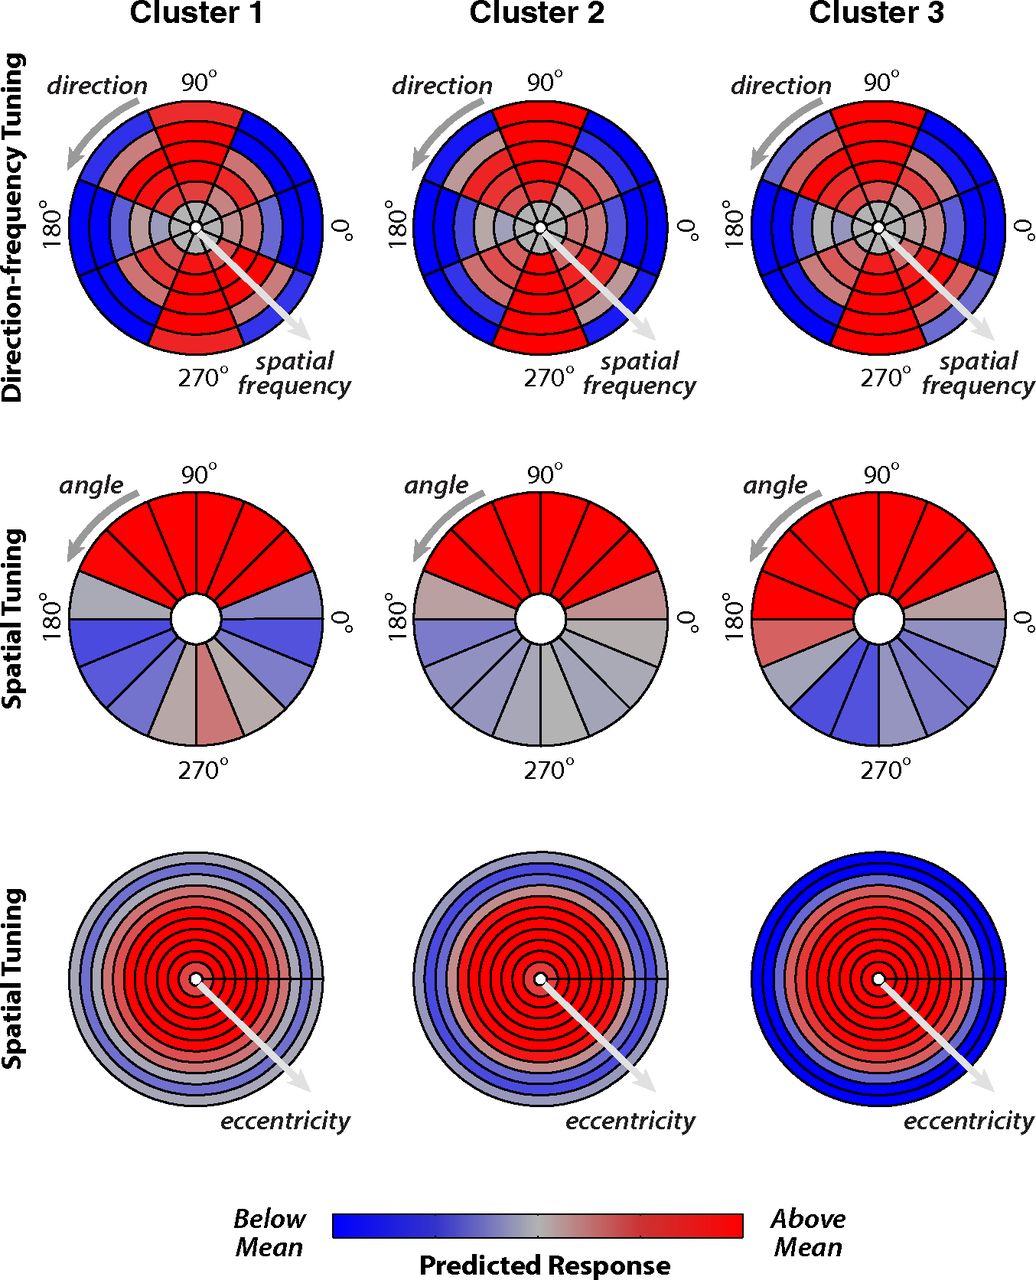
The cluster centers computed from the motion-energy model. The mean motion-energy tuning across voxels assigned to each cluster shown in Figure 5. The motion-energy tuning is shown with bull's-eye plots for a temporal frequency of 0 Hz. The tuning was nearly identical for other temporal frequencies (2, 4 Hz; data not shown). Top row, The radial component represents increasing spatial frequency (0, 2, 4, 8, 16, and 32 cycles/image), and the angular component represents direction (0 and 180 degrees indicate the horizontal direction). Middle row, The angular component represents polar angle. Bottom row, The radial component represents eccentricity (0, 1.2, 2.4 … 12.0 degrees). Red represents visual features that evoke above-mean responses; blue represents features that evoke below-mean responses. The mean motion-energy tuning is highly similar across the voxel clusters in FFA.
- Figure 13.
Cluster centers of individual subjects. Mean tuning profiles across voxels within each cluster (p < 0.05, Monte Carlo test, FDR corrected) are shown separately for each individual subject (S1–S5). Formatting is identical to Figure 5.
- Figure 14.
Group cluster centers. a–c, Mean raw model weights across voxels within each cluster (p < 0.05, Monte Carlo test, FDR corrected) are shown separately. Formatting is identical to Figure 5.
- Figure 15.
Group PCs of FFA voxels. a–c, The raw model weights for the first three principal components of category tuning profiles (p < 0.05, Monte Carlo test, FDR corrected) are shown separately. Formatting is identical to Figure 8.
- Figure 16.
Cortical flatmaps of category tuning within and outside FFA. To examine the cortical distribution of category tuning within and outside FFA, voxelwise tuning profiles were projected onto the first three PCs measured from tuning profiles of FFA voxels (Fig. 8). Projections of tuning profiles onto individual PCs are shown on the cortical flatmaps for subjects S1, S3, S4, and S5 (p < 0.05, χ2 test, FDR corrected). Formatting is identical to Figure 10.


Tables
Total Cluster 1 Cluster 2 Cluster3 p < 10−6 220 140 80 0 S1 70 43 27 0 S2 67 46 21 0 S3 16 12 4 0 S4 48 24 24 0 S5 19 15 4 0 p < 10−5 266 172 94 0 S1 82 51 31 0 S2 82 59 23 0 S3 21 14 7 0 S4 60 31 29 0 S5 21 17 4 0 p < 10−4 328 121 129 78 S1 97 32 37 31 S2 103 51 49 9 S3 28 12 8 8 S4 63 15 27 25 S5 23 11 8 5 ↵aThe numbers of voxels in each cluster are listed for three different localizer thresholds used to define FFA: p < 10−6, p < 10−5, and p < 10−4. The first row in each panel indicates the total number of voxels summed across subjects. The remaining rows indicate the number of voxels in individual subjects (S1–S5).


