

Abstract
A crucial aspect of cognitive control and learning is the ability to integrate feedback, that is, to evaluate action outcomes and their deviations from the intended goals and to adjust behavior accordingly. However, how high-learners differ from low-learners in relation to feedback processing has not been characterized. Further, little is known about the underlying brain connectivity patterns during feedback processing. This study aimed to fill these gaps by analyzing electrical brain responses from healthy adult human participants while they performed a time estimation task with correct and incorrect feedback. As compared with low-learners, high-learners presented larger mid-frontal theta (4–8 Hz) oscillations and lower sensorimotor beta (17–24 Hz) oscillations in response to incorrect feedback. Further, high-learners showed larger theta connectivity from left central, associated with motor activity, to mid-frontal, associated with performance monitoring, immediately after feedback (0–0.3 s), followed by (from 0.3 to 0.6 s after feedback) a flux from mid-frontal to prefrontal, associated with executive functioning. We suggest that these results reflect two cognitive processes related to successful feedback processing: first, the obtained feedback is compared with the expected one, and second, the feedback history is updated based on this information. Our results also indicate that high- and low-learners differ not only on how they react to incorrect feedback, but also in relation to how their distant brain areas interact while processing both correct and incorrect feedback. This study demonstrates the neural underpinnings of individual differences in goal-directed adaptive behavior.
Introduction
The success of adaptive goal-directed behavior depends on continuous monitoring of our action outcomes and their deviations from the intended goals, and incorporating this information for adjustment of subsequent actions. For the last two decades, a large body of research literature in neuroimaging has focused on the neural correlates of such a performance monitoring system (Nieuwenhuis et al., 2004; Cohen, 2008). Most studies have focused on the feedback-related negativity (FRN), a negative event-related-potential (ERP), starting around 145 ms following the presentation of incorrect feedback, with a mid-frontal topography (Miltner et al., 1997). The anterior cingulate cortex (ACC), especially dorsal ACC, is the most likely generator of the FRN (Miltner et al., 1997; Luu et al., 2003; Potts et al., 2010), along with other areas in the medial prefrontal and posterior cingulate cortex (Müller et al., 2005; Nieuwenhuis et al., 2005; Cohen and Ranganath, 2007).
Beyond the FRN, neuronal oscillations can provide complementary information on the various features of feedback-guided learning (Cohen et al., 2007, 2011; Christie and Tata, 2009; van de Vijver et al., 2011). Theta power (4–8 Hz) increases from 200 to 500 ms following negative feedback (Cohen et al., 2007; Cavanagh et al., 2010, 2012a), while beta power (15–30 Hz) increases from 200 to 500 ms following positive feedback (Cohen et al., 2007; Marco-Pallares et al., 2008; van de Vijver et al., 2011).
Cohen et al. (2011) proposed a framework for understanding feedback-guided learning based on a set of core predictions: (1) learning is associated with increases in synchronization between the stimulus and motor areas for which the associations are formed, (2) these changes are driven by prefrontal cortical regions at specific frequencies, and (3) these changes are reflected in within-subjects and between-subjects differences. According to this third prediction, participants that learn better have stronger intersite synchronization that might reflect differences in synaptic plasticity.
We tested some of these predictions by investigating the electroencephalogram (EEG) correlates of feedback processing in high- and low-learners. We analyzed ERPs, oscillations, and brain connectivity patterns. Note that the latter aspect has been addressed by only a few studies (Cavanagh et al., 2010; van de Vijver et al., 2011) investigating feedback processing in humans, and the directed connectivity, to the best of our knowledge, remains uncharacterized. We used the phase slope index (PSI) to measure directed connectivity (Nolte et al., 2008), which allowed us to infer the direction of the synchronization. Special emphasis was laid on revealing the dynamics of brain connectivity patterns related to feedback processing.
The objectives of this study are threefold: (1) to analyze the ERPs, the oscillations, and the directed connectivity following correct and incorrect feedback; (2) to compare the ERPs, oscillations, and connectivity between high- and low-learners; and (3) to correlate these brain responses with task performance. We predicted that incorrect feedback will be associated with larger FRN, increased theta power, higher beta desynchronization, and stronger directed connectivity. We expected all of these effects to be enhanced in the high-learners group.
Materials and Methods
Subjects
Thirty-six healthy human participants (all right-handed, mean age = 23.11 years, SD = 6.67, 11 males) with normal hearing (self-reported) and normal or corrected-to-normal vision voluntarily participated in the experiment. All participants were recruited by the university's participations research scheme and all received course credits. The sample was divided into two groups according to the task performance, as explained later. Performance measures resulted in a high-learners group (n = 18, mean age = 23.17 years, six males) and a low-learners group (n = 18, mean age = 23.06 years, five males). The study was approved by the local ethics committee of the Department of Psychology at Goldsmiths and conducted in accordance with the Declaration of Helsinki. All participants provided written informed consent.
Experimental task
We used a modified version of a time-estimation task (Miltner et al., 1997). In the original task, the participant is required to estimate the time interval of 1 s after the presentation of a sound. In our study, the participants were required to estimate the time interval of 1.7 s. This modification from 1 s to 1.7 s was made for the following two reasons: (1) with integer second durations, subjects tend to rely more on counting than on feedback while trying to adjust their estimation and (2) brain mechanisms for subsecond and suprasecond time estimations are different, with the suprasecond durations being less automatic than the subsecond ones (Lewis and Miall, 2003).
Each trial started with a fixation cross, whose duration varied randomly between 300 and 900 ms, followed by an auditory beep (800 Hz, 50 ms), which indicated the beginning of the target time interval. The participants pressed a button with their right thumb whenever they thought 1.7 s had elapsed. Six hundred milliseconds after the response, the participants received a feedback indicating whether the estimation was “too short,” “too long,” or “correct.” The cutoffs for these three feedback categories were determined in an adaptive way based on the difference between the participant's estimation and the target; a response was initially considered correct if it fell in a time window 200 ms above or below the target (1500–1900 ms). After a correct response, the time window was reduced by 20 ms each side. For example, if the time window for correct was +/−200 ms around the target and the participant estimated an interval of 1600 ms (100 ms = correct), than, the next cutoffs would be 180 ms (1520–1880 ms). Similarly, each time an incorrect (too short or too long) response was given, the time window was increased by 20 ms each side. This adaptive procedure resulted in a similar number of trials belonging to three feedback categories. The feedback was presented for 1 s.
To investigate the learning, we included six blocks of 20 trials each without any valid feedback (instead of feedback, the word “OK” was presented for 1 s). There were six feedback blocks with 80 trials each, interspersed with six no-feedback blocks of 20 trials each. We were principally interested in the nonfeedback blocks because the performance on these trials is expected to represent the maintenance of the internal representation of the time interval learned during the feedback trials, since no external feedback was available to guide any subsequent adjustment. Thus, there were in total 480 feedback trials and 120 nonfeedback trials. The task started with a nonfeedback block and ended with a nonfeedback block. A small break was provided between the sixth and seventh block (half way), both with feedback, i.e., the task restarted with a feedback block. The experimental task lasted around 1 h.
The participants were divided into two groups based on their performance in the last three nonfeedback blocks. We calculated two measures for the evaluation of learning: (1) the error magnitude, measured as the average of the absolute difference between the participant's estimations and the target time interval (1700 ms) and (2) the response variability, measured as the SD of the error (difference between participant's estimation and the target) in each block. Response variability was used in the criteria as performance consistency is an important marker of learning (Wolpert et al., 2011). The error magnitude and variability were highly correlated in both feedback (r = 0.951, p < 0.001) and nonfeedback blocks (r = 0.893, p < 0.001). These two measures were normalized between 0 and 1 (rescaled to minimum-maximum) and averaged to have a single measure accounting for both error and variability. Using a median split, the top 50% of this combined measure was classified as the low-learners group (larger error and high response variability) and the bottom 50% as the high-learners group (lower error and low response variability).
We further analyzed the performance in relation to how efficiently the participants adjusted their estimations based on the feedback. The adjustment efficiency (AE) was calculated as follows:
 where e is the absolute error in the current (i) or preceding (i − 1) trials. This AE measure provided information on how well the adjustments were made, on average, by each group (low- and high-learners) and during feedback and nonfeedback blocks. The AE was calculated for each individual trial and then averaged for each block.
EEG Recording and analysis
Continuous EEG signals were acquired using 64 active electrodes placed according to the extended 10–20 system of electrode placement, and amplified by a BioSemi ActiveTwo amplifier. The vertical and horizontal electro-oculograms were recorded using four additional electrodes to monitor eye blinks and horizontal eye movements. The EEG signals were recorded with a sampling frequency of 512 Hz, bandpass filtered between 0.16 Hz–100 Hz. The task was presented on a PC using the MATLAB-based toolbox Cogent 2000 (http://www.vislab.ucl.ac.uk/cogent.php). The EEG data were processed and analyzed by the MATLAB-based custom scripts and the following toolboxes: EEGLAB (Delorme and Makeig, 2004) for data preprocessing including Independent Component Analysis (ICA), and FieldTrip (Oostenveld et al., 2011) for data analysis and statistical comparisons.
Preprocessing.
The EEG data were re-referenced to the arithmetic average of the two earlobes, and highpass filtered at 0.5 Hz. The data were epoched around feedback with an epoch length of 2.6 s (from 1.6 s before the feedback to 1 s after the feedback stimulus). The artifacts were treated in a semi-automated fashion: visual inspection was initially made to remove large muscle artifacts, followed by an ICA to correct for eyeblink artifacts. Afterward, any epochs containing amplitudes exceeding 80 μV were discarded. The average number of trials used in the analysis was as follows: 133 too short trials (SD = 34), 131 too long trials (SD = 32), and 139 correct trials (SD = 27). A 2 × 3 mixed ANOVA on the number of trials with group (high- and low-learners) as a between-subjects factor and feedback (too long, too short, correct) as a within-subjects factor revealed no significant effect of feedback (F(1.6, 34) = 0.805, p = 0.451), group (F(1,34) = 1.144, p = 0.292), nor interaction (F(1.6, 34) = 1.693, p = 0.198). In addition, there was no effect for group, indicating that the two groups did not differ in the number of trials for each condition (F(1,34) = 1.144, p = 0.292). For all subsequent analysis, responses to both too long and too short feedback categories were merged into one “incorrect” category, since there was no difference between these two feedback categories.
ERP analysis.
For the ERPs only, the data were lowpass filtered at 35 Hz and averaged over trials and baseline corrected (baseline being 200 ms before feedback). The FRN was measured as the mean ERP amplitude at FCz between 200 and 300 ms after feedback, and the P300 was measured as the mean ERP amplitude at Pz between 300 and 400 ms. In addition, we measured the N2 peak as the most negative peak between 145 and 250 ms, and the P3 peak as the most positive peak between 250 and 400 ms, both at FCz. This electrode and time windows were chosen based on the visual inspection of the main FRN results. We calculated the N2–P3 peak-to-peak amplitude by subtracting the N2 peak from the P3 peak.
Time-frequency analysis.
The time varying spectral content of the EEG data was estimated by wavelet-based time-frequency representation (TFR). The signal was first convolved with complex Morlet wavelet on a single-trial basis and was later averaged across trials. We analyzed frequencies from 2 to 35 Hz in steps of one, using four cycle wavelets. To deal with filtering edge effects, we extended the data by half of the length of each wavelet using zero padding. The TFR was normalized by dividing the spectral power in each frequency by its baseline value, 200 ms before feedback till its onset.
Connectivity analysis.
The directed functional connectivity was estimated by the recently introduced PSI (Nolte et al., 2008), which is based on the concept that a nonvanishing imaginary part of the coherency cannot be explained as a mixing artifact caused by volume conduction. Therefore, the PSI can only detect noninstantaneous functional relations. Because volume conduction is an instantaneous effect, it cannot lead to phase differences other than 0 or π, with the latter corresponding to a sign switch, and for both cases the contribution to the imaginary part of coherency vanishes (Nolte et al., 2004). The PSI measures connectivity between two signals based on the slope of the phase of their cross-spectrum. For signals y1 and y2, the cross-spectrum S12 is as follows:
 where 〈·〉 denotes the expectation operator. If the signals are just delayed versions of each other, i.e., y2(t) = y1(t − τ), the phase-spectrum Φ(f) = 2πfτ is linear and proportional to the time delay τ. For positive (negative) slope of Φ(f)the causal direction is from y1 to (from) y2. Based on this observation, the PSI is defined as an average phase slope as follows:
 where f is the frequency, δf is the frequency resolution, ℑ(·) denotes taking the imaginary part, and F is a set of frequencies over which the slope is summed. The C12 is the complex coherence (normalized cross-spectra) as follows:
 As the PSI is based on the imaginary part of the coherence, it is insensitive to artifacts of volume conduction (the imaginary part is shifted in time). The PSI is then normalized by its SD, which is estimated using the jackknife method. The PSI is normalized to the estimate of its SD. For Gaussian distributions with unit SDs, absolute values larger than 1.96 are significant detections corresponding to the significance value α = 0.05, which we adopted here. Choosing a slightly more conservative threshold of 2 rather than 1.96 was done for simplicity and following the procedure in Nolte et al. (2008). Therefore, absolute PSI values larger than 2 are considered as significant (Nolte et al., 2008).
It should be noted here that the PSI does not show instantaneous connectivity. If connectivity is present in both directions, PSI can be interpreted as the net direction. More precisely, one direction can be established while the question of additional information flow in the opposite direction is just left open. In fact, a nonvanishing PSI requires an asymmetry between the respective time series. While not all causal effects can be detected this way, the idea is that the measure does not confuse mixing of independent sources (which results in symmetric cross-spectra) with true causality. The PSI has been found to be sensitive and robust in detecting true interactions (Nolte et al., 2008).
The 1500 ms epoch (600 ms before to 900 ms after feedback) was divided into five nonoverlapping segments of 300 ms each, and the PSI was calculated on each of these segments, from 3.33 to 40 Hz (frequency resolution 3.33 Hz). First, we analyzed the PSI from FCz to all electrodes for all frequencies (see Fig. 7b), and identified the frequency at which the PSI value was maximum, which led us to choose the frequency in the theta band (4–8 Hz) as the frequency of interest, seeing that it was verified as a peak in connectivity at this range. Subsequently, the PSI at that frequency was visualized using the “head-in-head” plot (Nolte et al., 2004). The topographical distribution of the connectivity observed in these plots guided the choice of the tested electrode pairs for each time window. The PSI values for each pair in each time window were subsequently analyzed to identify the dynamics of the connections in each stage of the feedback processing (pre-feedback and post-feedback). This procedure resulted in three main statistical analysis for the patterns found: (1) from mid-frontal (FCz) to left central (C3) immediately after the response (−600 to −300 ms), (2) from left central (C3) to mid-frontal (0 to 300 ms), and (3) from mid-frontal (FCz) to prefrontal (F5). These specific electrode pairs were chosen based on the peak PSI values for the observed topographies shown in the head-in-head plots.
Statistical analysis
Brain responses to correct and incorrect feedback were compared using a 2 × 2 mixed ANOVA with a between-subjects factor learning group (high-learners vs low-learners) and feedback as the within-subjects factor (correct vs incorrect). When the dependent variables belonging to the same analysis showed moderate correlations, a multivariate ANOVA (MANOVA) was used instead. When interactions were observed, paired t tests and independent t tests were used for the contrasts. The dependent variables of each ANOVA/MANOVA used are described along with the results. These statistical analyses were done using the Statistical Package for the Social Sciences (Version 18.0; SPSS).
To test the correlations between ERPs and TFRs with task performance, the nonparametric Spearman's ρ was used. The correlations were tested for the whole epoch, correlating amplitude (for ERP) or relative spectral power (for TFR) with averaged error in the last three feedback and nonfeedback blocks. A correlation was considered meaningful if it remained significant for at least 50 ms.
Results
Behavioral results
The task performance differences between high- and low-learners as measured by error magnitude, variability, and adjustment efficiency are shown in Figure 1. We conducted a mixed 2 × 2 × 2 MANOVA with stage (first vs second half of the task), feedback (feedback vs nonfeedback), and learning group (high- vs low-learners) as independent variables and the three behavioral measures (mean absolute error, variability, and adjustment efficiency) as dependent variables. Even though differences between high- and low-learners in the last three nonfeedback blocks were expected, because the groups were divided based on those trials, this analysis was necessary to check whether both groups improved from the first to the second half of the task, and to check for any interaction between the way they performed in the feedback and nonfeedback blocks. Assessing the interactions between learning and performing the feedback and nonfeedback blocks answers questions such as the following: Did the high-learners improve more than the low-learners? Did the high-learners present a smaller decrement in performance when no feedback was available?

Performance measures of both groups, high-learners (blue) and low-learners (red), across blocks, feedback, and nonfeedback (gray shadows). Performance was measured by absolute error magnitude (a), response variability (b), and adjustment efficiency (c).
There was a significant multivariate effect for learning group (F(1,32) = 11.085, p < 0.001, η2 = 0.510), since the high-learners showed lower absolute error (F(1,32) = 33.632, p < 0.001, η2 = 0.497), variability (F(1,32) = 25.722, p < 0.001, η2 = 0.431), and higher adjustment efficiency (F(1,32) = 30.447, p < 0.001, η2 = 0.472) than the low-learners. We also found multivariate within-subjects effects for stage (F(1,32) = 6.791, p = 0.001, η2 = 0.708), feedback (F(1,32) = 25.846, p < 0.001, η2 = 0.708), and interactions between feedback and learning group (F(1,32) = 4.318, p = 0.012, η2 = 0.288) and stage and feedback (F(1,32) = 4.476, p = 0.010, η2 = 0.296). The first interaction indicated that the difference in performance between feedback and nonfeedback blocks was higher in the low-learners group. The second interaction indicated that the differences between feedback and nonfeedback reduced during the second half of the task. Interestingly, in the univariate effects, the variable with the largest effect size from the first to the second half of the task was the adjustment efficiency (F(1,34) = 19.013, p < 0.001, η2 = 0.359). In addition, there was a significant interaction between stage and learning group for this variable (F(1,34) = 7.345, p = 0.010, η2 = 0.178), indicating that only the high-learners group increased the adjustment efficiency significantly in the second half of the task. This interaction showed a trend for the absolute error (F(1,34) = 3.846, p = 0.058, η2 = 0.102) and error variability (F(1,34) = 3.260, p = 0.080, η2 = 0.080).
ERP results
We found a negative deflection on the ERPs resembling an FRN: a negative going component starting around 145 ms with a mid-frontal topography (Fig. 2c). This negative component was present only in response to incorrect feedback for both high- and low-learners (Fig. 2a). In addition, a positive component resembling P300 was also found (Fig. 2b), with larger amplitudes for positive feedback (correct) with a P300-like topography (Fig. 2d).

ERPs for high-learners (solid) and low-learners (dashed) following correct (blue) and incorrect (red) feedback. a, Waveforms in FCz for high- and low-learners following correct and incorrect feedback. b, Waveforms in Pz for high- and low-learners following correct and incorrect feedback. c, Top, FRN topography for the differences between correct and incorrect feedback for high-learners (left) and low-learners (right). Bottom, The same differences between correct and incorrect, but in the P300 time window (300–400 ms). d, Mean and confidence intervals for the peak amplitude from 250 to 400 ms at FCz for low- and high-learners.
A mixed ANOVA on the mean FRN amplitude revealed a main effect of feedback (F(1,34) = 71.259, p < 0.001, η2 = 0.504), but not of learning group nor interaction (F < 1, n.s.). Similar analysis on P300 revealed similar results: a main effect of feedback (F(1,34) = 111.71, p < 0.001, η2 = 0.615), but no effects for learning group (F(1,34) = 0.035, p = 0.853) nor interactions (F(1,34) = 2.068, p = 0.142).
In addition, we tested these effects for the N2-P3 peak-to-peak difference and also for each peak (N2 and P3) at FCz, individually. For N2–P3 peak-to-peak amplitude, we found a significant interaction between learning group and feedback (F(1,34) = 5.70, p = 0.023, η2 = 0.144), but no main effects for feedback (F(1,34) = 1.22, p = 0.277) and learning group (F(1,34) = 1.34, p = 0.255). Independent t tests indicated that the groups only differed in the N2–P3 peak–peak difference following incorrect feedback (t(34) = −2.05, p = 0.048), but not following correct feedback presentation (t(34) = 0.722, p = 0.475). For N2 peak amplitude, we found a main effect of feedback (F(1,34) = 57.96, p < 0.001, η2 = 0.630), but no effect of learning group or interaction (F < 1, n.s.). For the P3 peak amplitude, we found a main effect of feedback (F(1,34) = 41.33, p < 0.001, η2 = 0.549), but no effect of learning group (F < 1, n.s.); however, we observed an interaction between feedback and learning group (F(1,34) = 7.58, p < 0.001, η2 = 0.182; Fig. 2d), which was due to the difference in the P3 peak between correct and incorrect feedback being larger for the low-learners (t(17) = 6.18, p < 0.001) than for the high-learners (t(17) = 2.74, p = 0.014). This interaction can be visualized in Figure 2d.
Next we investigated correlations between ERPs at FCz//Pz and task performance in the first and second half during feedback and nonfeedback blocks. No correlation was found to be statistically significant (p > 0.1).
Time-frequency decompositions
Compared with correct feedback, incorrect feedback was associated with larger theta band (4–8 Hz) power in both groups (Fig. 3a). However, this effect was more conspicuous in the high-learners, with a mid-frontal scalp distribution (Fig. 3c). The effect of feedback (correct vs incorrect) on theta relative power averaged over FCz from 200 to 500 ms was statistically significant (F(1,34) = 13.445, p = 0.001, η2 = 0.283), as was the interaction with learning group (F(1,34) = 8.688, p = 0.006, η2 = 0.204), but there was no effect of learning group alone (F(1,34) = 3.115, p = 0.077). Paired t tests indicated that only the high-learners presented a significant increase in theta power following incorrect feedback in comparison with correct feedback (t(17) = 3.780, p = 0.001); this difference was not statistically significant (t(17) = 0.742, p = 0.468) in the low-learners. Further, the two groups differed in their theta power following incorrect feedback (t(34) = −2.645, p = 0.012), but not following correct feedback (t(34) = 0.321, p = 0.750).

a, TFRs of EEG spectral power following correct (left) and incorrect feedback for high-learners (first row) and low-learners (second row). b, On the left side the time course of theta power averaged over FCz and Fz for high-learners (solid) and low-learners (dashed) following incorrect (red) and correct (blue) feedback. On the right side the mean and confidence intervals of theta power averaged over electrodes for the shadowed time window on the left side. c, Topographical distribution of theta relative power averaged from 200 to 500 ms following feedback.
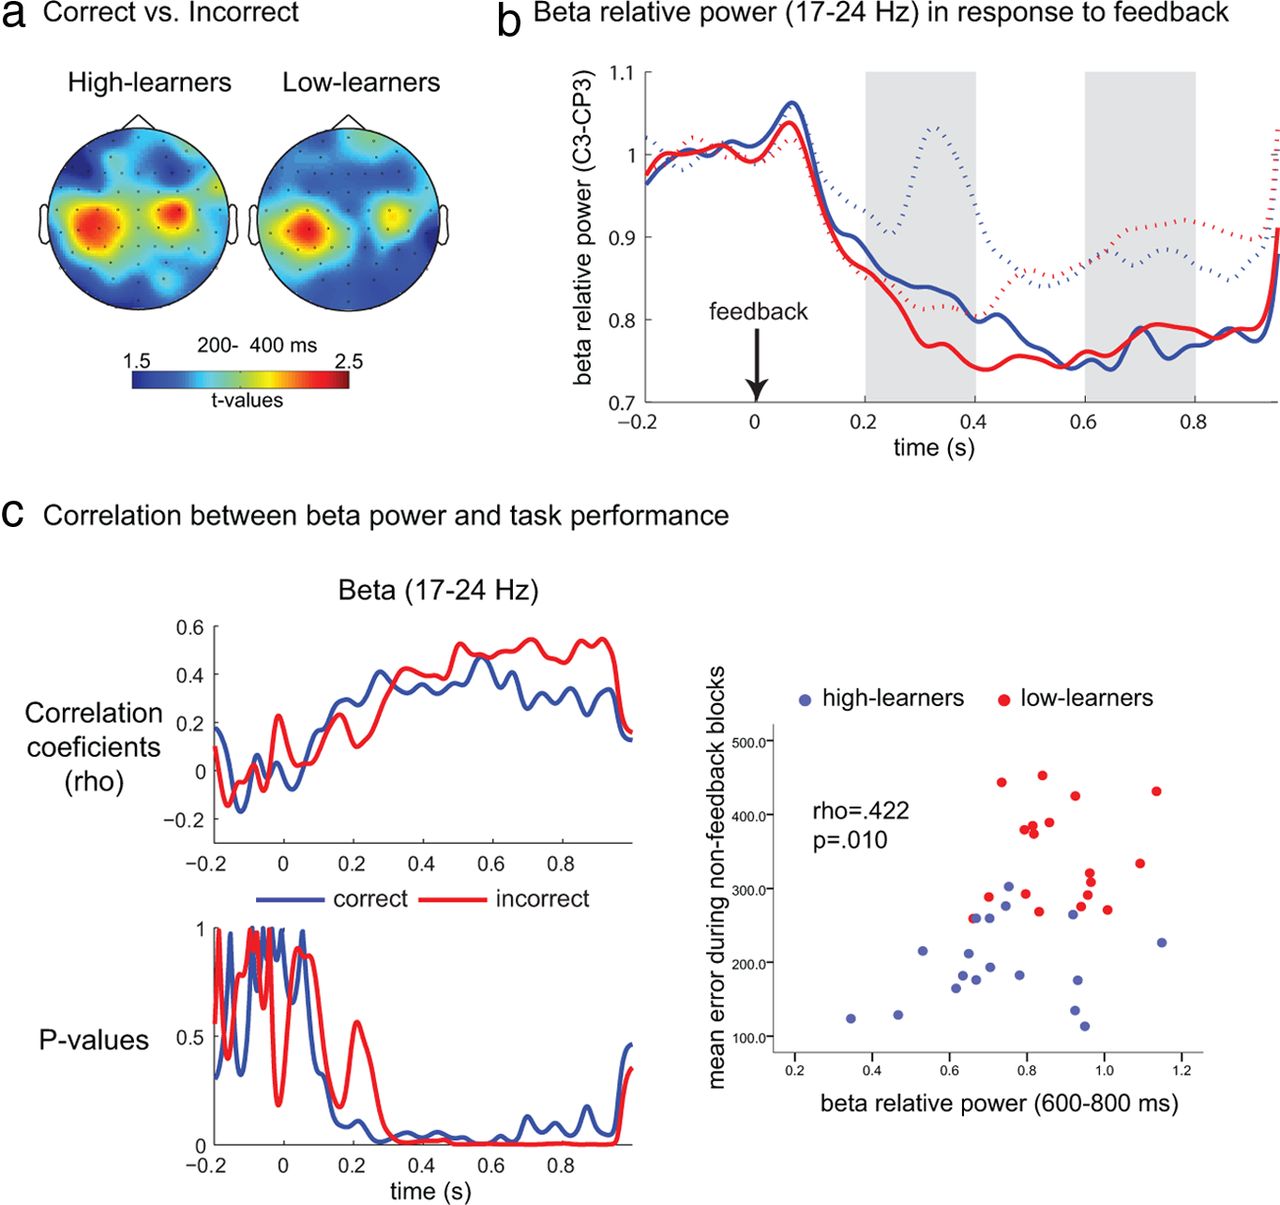
In the higher frequencies a general reduction of spectral power was observed. Typically, beta band (17–24 Hz) power showed larger desynchronization following incorrect compared with correct feedback, and this difference was mainly located over the left central electrode regions (C3, CP3), which are usually associated with sensorimotor functioning (Fig. 4a). The differences between incorrect and correct feedback were larger from 200 to 400 ms (Fig. 4b), and the differences between high- and low-learners became evident from 400 ms with the high-learners showing sustained lower relative beta power.

a, Topographical distribution of differences (t values between incorrect and correct feedback) in the beta range (17–24 Hz) averaged from 200 to 400 ms following feedback. b, Time course of the beta power averaged over C3 and CP3 for high-learners (solid lines) and low-learners (dotted lines) for correct (blue line) and incorrect (red line) feedback. c, Time profile of the correlations between beta relative power and average performance on the nonfeedback blocks from the second half of the task. The top plot shows the correlation coefficients, whereas the bottom indicates the respective p values in which the dashed line represents the α level (0.05). d, Scatterplot for the correlation between performance (mean absolute error) averaged over the nonfeedback blocks of the second half of the task and beta relative power from 600 to 800 ms after feedback.
Next we statistically analyzed the beta power averaged over C3 and CP3 from 200 to 400 ms and from 600 to 800 ms after feedback. For the first time window, there was a main effect of feedback—beta power was lower for incorrect feedback (F(1,34) = 6.543, p = 0.015, η2 = 0.161). No interactions with learning group (F(1,34) = 1.256, p = 0.270) nor between-subject effects of learning group (F(1,34) = 1.479, p = 0.232) were observed. For the second time window, we observed a main effect of learning group (F(1,34) = 6.800, p = 0.013, η2 = 0.167), but no effect for feedback (F(1,34) = 0.827, p = 0.370). Independent t tests indicated that high- and low-learners differed in beta power following incorrect feedback (t(34) = 2.656, p = 0.012), but not following correct feedback (t(34) = 1.560, p = 0.128).
Next we investigated correlations between theta/beta at FCz/C3–CP3 and task performance (averaged over the last three nonfeedback blocks), and found that only the beta power was correlated with performance (Fig. 4c): the lower the beta power over the left sensorimotor areas, the lower the estimation error in the last nonfeedback blocks, i.e., participants who had larger beta desynchronization in response to feedback performed better when no feedback was available.
Connectivity
We analyzed the directed interactions as measured by the PSI from −600 ms pre-feedback to 900 ms post-feedback period equally divided into five nonoverlapping windows. In the first (−600 to −300 ms), third (0–300 ms), and fourth (300–600 ms) time windows, larger PSI values were observed between FCz and other electrodes in the theta frequency range (for frequencies see Fig. 7b). Importantly, the PSI values were higher in the high-learners group, for both incorrect and correct feedback.
Immediately following the response (−600 to −300 ms), we found an increase in connectivity from the mid-frontal to the central and parietal electrode regions (Fig. 5a), maximal over C3. During the second time window (from −300 to 0 ms), the theta PSI topography remained the same, but the PSI values decreased. In the time window immediately after feedback (0–300 ms), however, the direction of the connections between mid-frontal and central regions reversed, showing that the mid-frontal was receiving inputs from left central regions, with peak connectivity at electrode C3 (Fig. 5b). In the subsequent time window (from 300 to 600 ms), the connectivity patterns in the theta range indicated a flux from mid-frontal to prefrontal regions, with peak value at electrode F5 (Fig. 6a).

PSI for the high-learners group (a) from −600 to −300 ms (0–300 ms after the response) and (b) from 0 to 300 ms following correct feedback. In these plots, each mini topoplot represents a channel with the colors inside representing the connections with that channel. Blue colors indicate that this channel is driven by those areas, whereas red colors indicate that the given channel drives those areas.

PSI for the high-learners group (a) 300–600 ms following incorrect feedback presentation (too long and too short merged) and (b) PSI in the same time window but following correct feedback. Note that the connections are from mid-central to prefrontal areas, especially left prefrontal areas.
As we were particularly interested in the connections with frontocentral regions (FCz), which is often implicated in performance monitoring (Cavanagh et al., 2010; van de Vijver et al., 2011), we analyzed the PSI values from and to FCz. The time course of the connectivity with this area for high- and low-learners is shown in Figure 7a. The connectivity was larger in the high-learners group, which presented a distinct topography in response to feedback. Figure 7b shows the flux to (negative PSI) and from (positive PSI) FCz in all analyzed frequencies in the relevant time windows.

a, Topographical distribution of the PSI referenced to FCz for high-learners (first row) and low-learners (second row). Areas colored red are driven by FCz, whereas areas colored blue are the drivers of FCz. b, PSI values in each analyzed frequency for the connection between FCz and all central and posterior channels in the specified time windows: positive peaks indicate a flux from FCz to other channels for each frequency in the x-axis, while negative peaks indicate a flux from other channels to FCz. It is evidenced in these plots that the peak connectivity happens in the theta frequency band, which is highlighted in gray. c, Error graphs for the mean PSI in all time windows analyzed following correct (left) and incorrect feedback for high-learners (blue lines) and low-learners (red lines). The solid gray line in both plots indicates the zero value for PSI.
To compare the feedback conditions and groups, we extracted the PSI for the FCz–C3/C5 (averaged) pair for all comparisons. In Figure 7c, one can see that after correct and incorrect feedback, FCz started receiving inputs from C3, but only in the high-learners group. The pair FCz–F5 was also analyzed, because of the connections seen in the 300–600 and 600–900 ms time windows. Considering that we found three different connectivity patterns in the theta range, and that in the second (−300 to 0 ms) and in the last time window (600–900 ms), no interesting or distinct pattern was found, we conducted statistical and correlation analysis using the following time windows: (1) − 600 to −300 ms from feedback, (2) from 0 to 300 ms after feedback, and (3) from 300 to 600 ms after feedback.
For the first time window, we found no significant effects for feedback (F(1,34) = 2.217, p = 0.146), group (F(1,34) = 2.785, p = 0.104), and an interaction (F(1,34) = 2.836, p = 0.101). However, there was a significant correlation between the PSI following the response and adjustment efficiency on the feedback blocks, regardless of the feedback category. The larger the PSI in the theta band from FCz to C3/C5, the more efficient the adjustments were made in the first (Spearman's ρ = 0.421, p = 0.011) and in the second (ρ = 0.434, p = 0.008) half of the tasks on correct trials, and also on incorrect ones (first half: ρ = 0.447, p = 0.006; second half: ρ = 0.399, p = 0.016). It was also found that the larger the PSI for this connection on correct trials, the lower the error (ρ = −0.393, p = 0.018) and variability (ρ = −0.425, p = 0.010) in the nonfeedback blocks of the second half of the task.
Following feedback, the direction of the connectivity between FCz and C3/C5 reversed, yielding negative PSI values. The results showed that PSI did not differ significantly between incorrect and correct feedback (F(1,34) = 0.591, p = 0.591), and there was no interaction between feedback and group (F(1,34) = 0.721, p = 0.591). There was, however, a significant effect of group (F(1,34) = 6.198, p = 0.018, η2 = 0.154), indicating more negative PSI values (i.e., a larger flux from C3/C5 to FCz) in the high-learners. Independent sample t tests showed a significant difference in the PSI between high- and low-learners following correct (t(34) = 2.567, p = 0.015) and incorrect (t(34) = 2.109, p = 0.042) feedback. There were significant correlations between PSI and adjustment efficiency in the second half of the task, following incorrect (ρ = −0.553, p < 0.001) and correct feedback (ρ = −0.439, p = 0.007). In addition, the more negative the PSI between FCz and C3/C5 following feedback, the lower the error on the second half of the feedback blocks, following both incorrect (ρ = −0.448, p = 0.006) and correct (ρ = 0.398, p = 0.016) feedback.
To analyze whether the PSI for FCz–C3/C5 significantly changed before and after feedback, we compared the simple effects between pre- and post-feedback by means of paired t tests for low- and high-learners, separately. Only the high-learners group presented significantly increased connectivity after feedback in relation to the baseline (−300 to 0 ms), for both feedback categories: correct (t(17) = 3.551, p = 0.002) and incorrect (t(17) = 3.524, p = 0.003). No statistically significant difference was found in the low-learners group for all feedback conditions (p > 0.4).
From 300 to 600 ms following feedback, the analysis was focused on the connection between FCz and F5. Statistical analysis revealed a significant effect for feedback (F(1,34) = 6.160, p = 0.018, η2 = 0.153) and an interaction between feedback and group (F(1,34) = 5.831, p = 0.021, η2 = 0.146). The main effect of feedback was due to a higher connectivity following correct than incorrect feedback (t(34) = −2.327, p = 0.026). The interaction was due to the fact that only the low-learners group showed significantly higher connectivity following correct compared with incorrect feedback (t(17) = 3.595, p = 0.002), whereas the high-learners group demonstrated increased connectivity in all feedback conditions, with no significant difference between correct and incorrect feedback (p > 0.3). It is important to notice, however, that the high-learners showed larger PSI values for this pair in response to both correct and incorrect feedback. The low-learners, on the other hand, only showed increased PSI values for this connection following correct feedback only.
Discussion
In this study we investigated the individual differences in feedback processing during a time-estimation task. The behavioral results indicated that the high-learners not only exceeded the low-learners at performing the task, but they were also more efficient at making performance adjustments. Furthermore, the worse performance in the nonfeedback blocks indicates that the execution of this task is highly dependent on feedback. Interestingly, the interaction effect showed that low-learners suffered larger decrements in performance for nonfeedback blocks, indicating that high-learners developed and maintained a better internal representation of the learned skill.
Our ERP results demonstrating a larger FRN following incorrect feedback is consistent with previous findings demonstrating that the FRN is primarily triggered by negative or error feedback (Miltner et al., 1997; Bellebaum and Daum, 2008; Heldmann et al., 2008; Chase et al., 2011). We also found a larger P300 following correct feedback, which is in agreement with other studies showing an increase in P300 following positive feedback (Hajcak et al., 2007; Bellebaum and Daum, 2008; Sailer et al., 2010; van der Helden et al., 2010). One possibility is that a correct feedback triggers a P300 component that enhances attention to promote memory operations in temporoparietal areas (Polich, 2007). The N2-P3 complex did not differ between correct and incorrect feedback conditions but interacted with learning, since low-learners demonstrated a larger difference in the P3 peak (larger following correct feedback) between correct and incorrect feedback. Considering that the P3 or the P3a (more frontocentral than the P3b), is related to the novelty and significance of stimulus (Friedman et al., 2001; Polich, 2007), we suggest that low-learners were expecting less correct than incorrect feedback, even though they did not receive significantly different feedback compared with the high-learners.
The TFR analysis showed an increase in theta power following incorrect feedback, and more so in high-learners. Negative feedback was found to be associated with larger theta power over the mid-frontal areas (Cohen et al., 2007, 2009; Christie and Tata, 2009; Cavanagh et al., 2010, Cavanagh et al., 2012a,Cavanagh et al., 2012b; van de Vijver et al., 2011). Since theta oscillations are supposed to reflect the activity of the performance monitoring system (Cavanagh et al., 2012a), we suggest that the individual differences on the mid-frontal reactivity to negative feedback distinguished high- and low-learners. However, the theta power did not correlate with the task performance, indicating that this oscillation might serve more for performance monitoring purposes than for developing internal representations of an implicit skill.
The TFR analysis also showed that the beta power was larger following correct than incorrect feedback. Larger beta power was earlier associated with correct feedback (van de Vijver et al., 2011) and wins in gambling tasks (Cohen et al., 2007; Marco-Pallares et al., 2008, 2009), and it has been suggested to serve as a neural marker of reward originating in the ventromedial orbitofrontal cortex (Marco-Pallares et al., 2008). In our study, rather than synchronization (i.e., an increase in spectral power) following the correct feedback, desynchronization (i.e., decrease) was observed following the incorrect feedback in the lower beta band (17–24 Hz) over the contralateral sensorimotor regions. Therefore, our beta effects were possibly related to a cognitive process that is different from the one investigated in the gambling studies mentioned previously (Cohen et al., 2007; Marco-Pallares et al., 2008, 2009).
Considering that the beta desynchronization over the left central electrode regions is associated with sensorimotor activation for purposes like motor imagery, planning, and preparation (Pfurtscheller et al., 1994; Pfurtscheller and Neuper, 1997; Wheaton et al., 2005; Velasques et al., 2007; Tombini et al., 2009; Yuan et al., 2010), our participants might have activated sensorimotor areas in response to feedback. A recent study (Galea et al., 2011) using transcranial direct current stimulation provided evidence that the motor cortex is important for consolidating learning; specifically, it was shown that while the cerebellum is involved in fast adaptation, the motor cortex has a major role in consolidating what is learned during the task. Therefore, it is possible that the feedback-elicited learning processes are related to motor consolidation. Another possibility is that the beta band desynchronization reflected a signal from the motor cortex indicating its status quo. In a recent review article, Engel and Fries (2010) suggested that beta oscillations over the motor cortex reflect a status quo signal indicating whether its status should be maintained or changed. According to this proposition, beta desynchronization reflects a signal indicating the need for a change, which could explain why beta power was lower following incorrect trials in our study. These two possibilities, activation of the motor cortex related to learning consolidation and the motor cortex signals indicating whether to change or keep the current status quo, could explain why the larger the desynchronization the better the learning consolidation and why a larger desynchronization was observed following incorrect compared with correct feedback.
Directed connectivity pattern and its time profiles have not been reported in any study on feedback processing in humans. Using a recently introduced index of measuring directed connectivity, we found three main patterns in three time periods: (1) immediately following the response (−600 to −300 ms), (2) immediately after feedback (0–300 ms), and (3) from 300 to 600 ms following feedback. Following the response, there was a flux from mid-frontal to sensorimotor regions, and this connectivity was correlated with task performance, indicating that the higher this flux the more efficiently the interval was corrected in the immediate trial. Considering that intersite synchronization can reflect communication between distinct brain areas (Fries, 2005), that the ACC is extensively connected to the motor cortex (Rushworth et al., 2007a), and that synaptic plasticity can result in increased synchronization (Cohen et al., 2011), we suggest there is a communication from the ACC to motor cortex after the response that could reflect a “check” of the status quo of the motor system for performance monitoring purposes. There is evidence indicating that learning elicits an error-related negativity (locked to the response), while it attenuates the FRN, which means that the system can check the performance without the need for external feedback information (Heldmann et al., 2008). What we suggest is that the increased connectivity between the mid-frontal and the motor-related electrodes could reflect this “internal” check of performance. Following feedback, we found that the left motor areas influenced the mid-frontal, only in the high-learners. This pattern was also correlated with task performance, since the participants with larger PSI values performed better even when no feedback was available. Our results are in agreement with a further study (van de Vijver et al., 2011), which found increased theta synchronization between mid-frontal and sensorimotor regions, suggesting that the medial prefrontal cortex shapes motor plans to improve the action selection for the next trial. Considering the previously mentioned connections between ACC and motor cortex, and our discussion about performance monitoring by means of internal and external information, we suggest that the mid-frontal and the sensorimotor areas interact when there is a need to assess performance, which involves the comparison between expected and actual action outcomes. It is difficult to know whether the increased synchronization between those areas facilitates learning or whether it increases as a consequence of learning; that remains a question to be investigated.
In the third time window (300–600 ms following feedback), there was an increase in the connectivity from mid-frontal to prefrontal areas. We suggest that this synchronization could reflect the update of the feedback history based on the mid-frontal assessment of the mismatch between expected and obtained feedback. This interpretation is based on the known role of the dorsolateral prefrontal cortex (DLPFC) in building up expectations (Rahnev et al., 2011) and the role of the ACC in learning response/stimulus-outcome associations, not only in the presence of error feedback or punishment, but also in case of positive rewards or correct responses (Rushworth et al., 2004, 2007b). Although we did not have enough spatial resolution to define the specific brain region behind our findings, a recent study demonstrates that the DLPFC is best targeted with transcranial magnetic stimulation by placing the coil over the F5 electrode (Rusjan et al., 2010). This connectivity pair (FCz–F5/F6) was also investigated by others (Cavanagh et al., 2009, 2010; van de Vijver et al., 2011) who suggested that the connection between the mid-frontal and the DLPFC reflects the need for increasing cognitive control. According to this view, the ACC communicates with the DLPFC to implement necessary adjustments in performance (Ridderinkhof et al., 2004). However, if this was the case, the increase would be higher after incorrect feedback, which was not found in the present study. Hence, we propose that the increased synchronization between FCz and F5 reflects the update of the feedback history, which should be independent of the feedback valence. However, more studies are needed to address this issue.
Conclusion
In this study, we demonstrated that oscillatory activity in the theta and the beta frequency range is sensitive to individual differences (high-learners vs low-learners) related to learning of a time-estimation task, while the ERP components, FRN and P300, were only sensitive to feedback valence (correct vs incorrect), but unrelated to task performance and insensitive to group differences. We suggest that while mid-frontal theta oscillations have an important role in monitoring errors, beta oscillations over the sensorimotor areas are more closely related to acquiring an internal representation of the skill being learned. We also demonstrated distinct patterns of directed intersite connectivity that may reflect the dynamics of feedback processing, unspecific to its valence. High-learners presented not only larger oscillatory responses to error feedback in the theta band, but also higher increases in intersite connectivity in response to feedback. We conclude that the ERPs, the oscillatory responses to incorrect feedback, and the connectivity between mid-frontal and task-related areas, can reveal different aspects of learning from feedback information.
Footnotes
C.D.B.L. was supported by the Coordenação de Aperfeiçoamento de pessoal de Nível Superior (CAPES) (PDEE program, process number: 1428-10-1) to perform the experiment at Goldsmiths, University of London. This work received partial funding by the ESRC (EP/H01294X/1) and by the Deutsche Forschungsgemeinschaft (DFG:SFB936). We are thankful to Job Lindsen for his help with the data analysis and to Dr. Stuart Derbyshire for proofreading the paper.
The authors declare no competing financial interest.
- Correspondence should be addressed to Dr. Caroline Di Bernardi Luft, Federal University of Santa Catarina, UFSC Campus Trindade, Centro de Filosofia e Ciencias Humanas Florianopolis, Santa Catarina, 88040-500 Brazil. caroluft21{at}yahoo.com.br or j.bhattacharya{at}gold.ac.uk


