

Article Figures & Data
Figures
- Figure 1.
Intracellular injection of Aβ42 oligomers into Xenopus oocytes evokes increases in cytosolic [Ca2+]. A, Overview of the experimental system, constructed around an Olympus IX71 inverted microscope. Fluorescence excited in the specimen by the 488 nm laser beam was collected through the objective lens and imaged by a Photometrics Cascade 128+ camera. An oocyte loaded with fluo-4 dextran was positioned animal hemisphere down on a coverglass forming the base of the imaging chamber. A two-electrode voltage clamp allowed the membrane potential to be stepped to strongly negative potentials to enhance Ca2+ influx through the plasma membrane. Microinjection into oocytes was performed using a Drummond nanoinjector mounted on a hydraulic micromanipulator. A glass pipette filled with Aβ42 solution was inserted vertically down through the entire oocyte to a pre-established position, with the tip positioned a few micrometers inward from the plasma membrane and centered within the image field. B, Aβ42 oligomers, but not monomer, evoke cytosolic Ca2+ signals. The traces represent the mean time course of Ca2+-dependent fluorescence recorded from oocytes injected with 10 nl of Aβ42 monomer (red trace; n = 3 oocytes) or oligomers (black trace; n = 6 oocytes), both at a concentration of 1 μg/ml. The arrow indicates the time of Aβ injection. Measurements were obtained as the average fluorescence throughout the imaged field and are plotted as the ratio of fluorescence changes at any given time (ΔF) over the mean fluorescence before injection (F0). C–E, Line-scan (kymograph) images illustrating different spatiotemporal patterns of fluorescence Ca2+ signals evoked by Aβ42 oligomer injections. Panels depict fluorescence measured along a line on the video record as the y-axis, with time running left to right along the x-axis. Increasing fluo-4 pseudo-ratio signals (increasing free [Ca2+]) are represented by warmer colors as depicted by the color bar and by increasing height of each pixel. The trace(s) above each panel show fluorescence signals monitored from small regions along the line scan, positioned as marked by the horizontal arrow(s). The timescales of these traces are the same as the calibration bar for the line-scan images, and the amplitudes of the fluorescence ratio changes (F/F0) correspond to the heights of the color bars. Aβ42 oligomers were injected 1 s after the beginning of the record in C. Records in D and E were obtained beginning 2–5 min after injection of Aβ42 oligomers. F, Corresponding line-scan image and fluorescence traces recorded in response to injection of 10 nl of 100 pm IP3. The injection was delivered ∼2.5 s before the beginning of the record. Responses are representative of records in five oocytes. G, Traces of average fluorescence ratio changes (ΔF/F0) from ∼20 × 20 μm regions of interest in individual oocytes, showing Ca2+ signals evoked by 10 nl injections of Aβ42 oligomers at concentrations of 3, 10, and 30 μg/ml, as indicated. Responses are representative, respectively, of records in four, four, and five oocytes.
- Figure 2.
Intracellular injections of Aβ42 oligomers induce localized Ca2+ transients resulting both from influx of extracellular Ca2+ and from liberation of intracellular Ca2+. A, Recordings from an oocyte bathed in solution including 1.8 mm Ca2+ and voltage clamped at −80 mV. Traces show simultaneous fluorescence ratio measurements from small (5 × 5 pixel; 1.5 × 1.5 μm) regions of interest positioned within the imaging field where indicated on the inset panel. Traces 1 and 2 illustrate regions showing puff-like activity, which we interpret to result from Ca2+ liberation from intracellular stores, whereas traces 3 and 4 show channel-like activity, resembling signals previously observed from plasmalemmal Ca2+-permeable pores formed by extracellular application of Aβ42 oligomers. B, Fluorescence traces from three representative regions displaying channel-like activity, recorded sequentially while the membrane potential was clamped at −20 mV (top) and −80 mV (bottom). C, Mean amplitudes of channel-like fluorescence signals at membrane potentials of −20 and −80 mV. Data are measurements of peak amplitudes of individual events from, respectively, 11 and 17 regions in three oocytes.
- Figure 3.
Local Ca2+ signals evoked by intracellular Aβ42 oligomers resemble Ca2+ puffs evoked by photorelease of IP3. A, The top trace is a representative example of local fluorescence signals from a site generating Ca2+ puffs after photorelease of IP3 from a caged precursor. The arrow marks the time of the photolysis flash. Bottom traces show selected puffs (marked by gray shading on the top trace) on an expanded timescale. Image panels show the spatial spread of the fluorescence signals at the time the puffs were maximal. B, C, Graphs showing the distributions of amplitudes and durations (at half-maximal amplitude) of IP3-evoked puffs (mean amplitude, ΔF/F0 = 0.41 ± 16.4; mean duration, 369 ± 16 ms; n = 137 puffs, 6 oocytes). D, Corresponding traces and images recorded from a different oocyte after injection of Aβ42 oligomers 5 min before recording. E, F, Graphs showing the corresponding measurement distribution for amplitudes and durations for Aβ-evoked puffs (mean amplitude, ΔF/F0 = 0.76 ± 5.2; mean duration, 213 ± 8.6 ms; n = 297 puffs, 9 oocytes).
- Figure 4.
Local intracellular Ca2+ signals evoked by Aβ42 oligomers are inhibited by the IP3R antagonist caffeine. A, Ca2+ signals recorded from 40 × 40 μm regions of interest in response to strong photorelease of IP3 by 50 ms ultraviolet flashes delivered when marked by the arrows. Top trace shows a control response; the bottom trace was recorded from the same oocyte 10 min after bath application of 10 mm caffeine. B, The top panel shows superimposed traces recorded from 5 × 5 pixels regions at 36 representative sites from a total of 86 that showed activity after intracellular Aβ injection. The lower panel shows superimposed traces from all (n = 7) sites that continued to show activity during application of 10 mm caffeine. C, Mean numbers of sites within the 40 × 40 μm imaging field showing local Ca2+ signals in response to injection of Aβ42 oligomers before, during, and after washing out caffeine (10 mm). Data are paired measurements from four oocytes in control and during caffeine application; washout measurements were obtained from two of the oocytes.
- Figure 5.
Intracellular Ca2+ signals evoked by Aβ42 oligomers are inhibited by intracellular injection of heparin. A, Local Ca2+ signals recorded from three representative regions of interest after intracellular injection of Aβ42 oligomers. B, Recordings from the same regions ∼2 min after intracellular injection of heparin. C, Mean numbers of sites within the 40 × 40 μm imaging field showing local Ca2+ signals in response to injection of Aβ42 oligomers before and after injection of heparin (n = 5 oocytes). D, Top trace shows repetitive Ca2+ waves evoked after injection of Aβ42 oligomers, monitored from a 40 × 40 μm region of interest. Bottom trace was measured from the same region 3 min after intracellular injection of heparin.
- Figure 6.
Ca2+ signals evoked by intracellular Aβ42 oligomers are suppressed by inhibiting IP3 production, whereas responses to photoreleased IP3 are unaffected. A, The trace on the left shows a transient, global Ca2+ signal evoked by strong photorelease of IP3 (50 ms flash, delivered when marked by the arrow), monitored from the entire imaging field. Superimposed traces on the right show local Ca2+ signals monitored from 1.5 × 1.5 μm regions of interest at 57 representative sites in response to injection of Aβ42 oligomers into the same oocyte. B, Corresponding records showing responses to an identical photolysis flash and injection of Aβ oligomers obtained from an oocyte from the same donor frog after incubation with PTX (2 μg/ml) for 24 h. The superimposed traces on the right show all five sites within the imaging field at which any activity could be discerned. C, Bar graphs showing mean numbers of sites showing detectable activity in control oocytes (n = 5) and in oocytes pretreated with PTX (n = 5). D, Suppression of Aβ-evoked Ca2+ signals by incubation with Li+. Bar graphs show mean numbers of sites showing detectable activity in control oocytes (n = 4) and in oocytes pretreated with Li+ (n = 5). Responses evoked by photoreleased IP3 were not significantly different (mean ΔF/F0, 2.70 ± 0.29 and 3.06 ± 0.27, respectively).
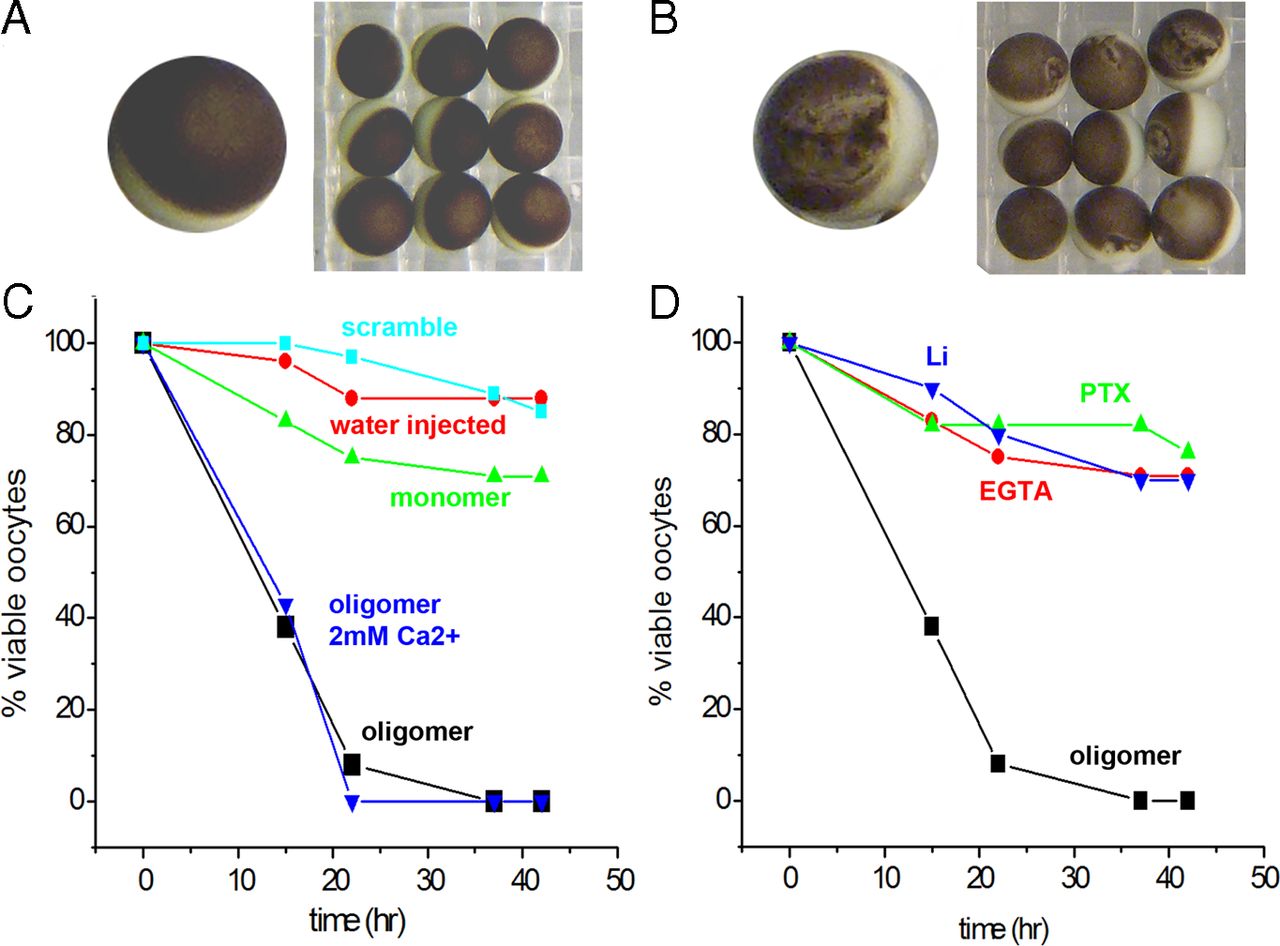
- Figure 7.
Intracellular Aβ42 oligomers cause cytotoxicity, which is protected by blocking IP3 production and by buffering cytosolic Ca2+. Toxicity was assessed by visual inspection of oocytes. Healthy oocytes display uniform black pigmentation in the animal hemisphere, whereas cell death is preceded by breakdown of the pigmentation. A, A group of healthy oocytes before injection and a single oocyte shown at higher magnification. Oocyte diameter is ∼1 mm. B, Corresponding images 12 h after injection of Aβ42 oligomers. Only three of the nine oocytes in the group were scored as viable at this time. C, Percentages of oocytes scored as viable at increasing times after injections of Aβ42 oligomers (black squares, n = 39 oocytes); Aβ monomer (green triangle, n = 32); water control, including DMSO at the same concentration as in the oligomer preparation (red circles, n = 27); scrambled Aβ sequence (cyan squares, n = 29); and Aβ42 oligomers with oocytes bathed in 2 mm Ca2+ Ringer's solution (blue triangles, n = 7 oocytes). In all cases except the latter, oocytes were maintained in Ca2+-free solution. D, Protection against cytotoxicity by suppressing IP3 production and by buffering cytosolic Ca2+. All data are from oocytes injected with Aβ42 oligomers that were maintained in Ca2+-free solution. Data from otherwise untreated oocytes (black squares) are reproduced from C. Blue triangles show viability of oocytes (n = 20) incubated with 100 μm Li+, green triangles are oocytes (n = 17) incubated with PTX (2 μg/ml), and red circles are oocytes (n = 24) that were injected with EGTA to a final cytosolic concentration of ∼3 mm at the time of Aβ injection. PTX and Li treatments followed the same procedures as described for the Ca2+ imaging experiments.


