

Article Figures & Data
Figures
- Figure 1.
The telencephalic vesicles of E9.5 PACAP−/− mice exhibit reduced S-phase labeling but no change in cell survival. a, b, BrdU immunohistochemical staining of E9.5 WT (a) and PACAP−/− (b) VZ analyzed on coronal sections from the mid-dorsolateral cortex. BrdU-positive cells (green) and total cells (PI; red) were counted blind in the VZ on these confocal images. c, Quantification of BrdU LI. PACAP−/− exhibited a 47% LI compared with 60% in the WT. d, e, TUNEL staining of E9.5 WT (d) and PACAP−/− (e) VZ. TUNEL-positive cells (green) and total cells (DAPI; blue) were counted blind. f, Quantification of TUNEL-labeled cells per section. n = 3 for each genotype. Results are expressed as mean ± SEM. **p < 0.01. Scale bars, 10 μm.
- Figure 2.
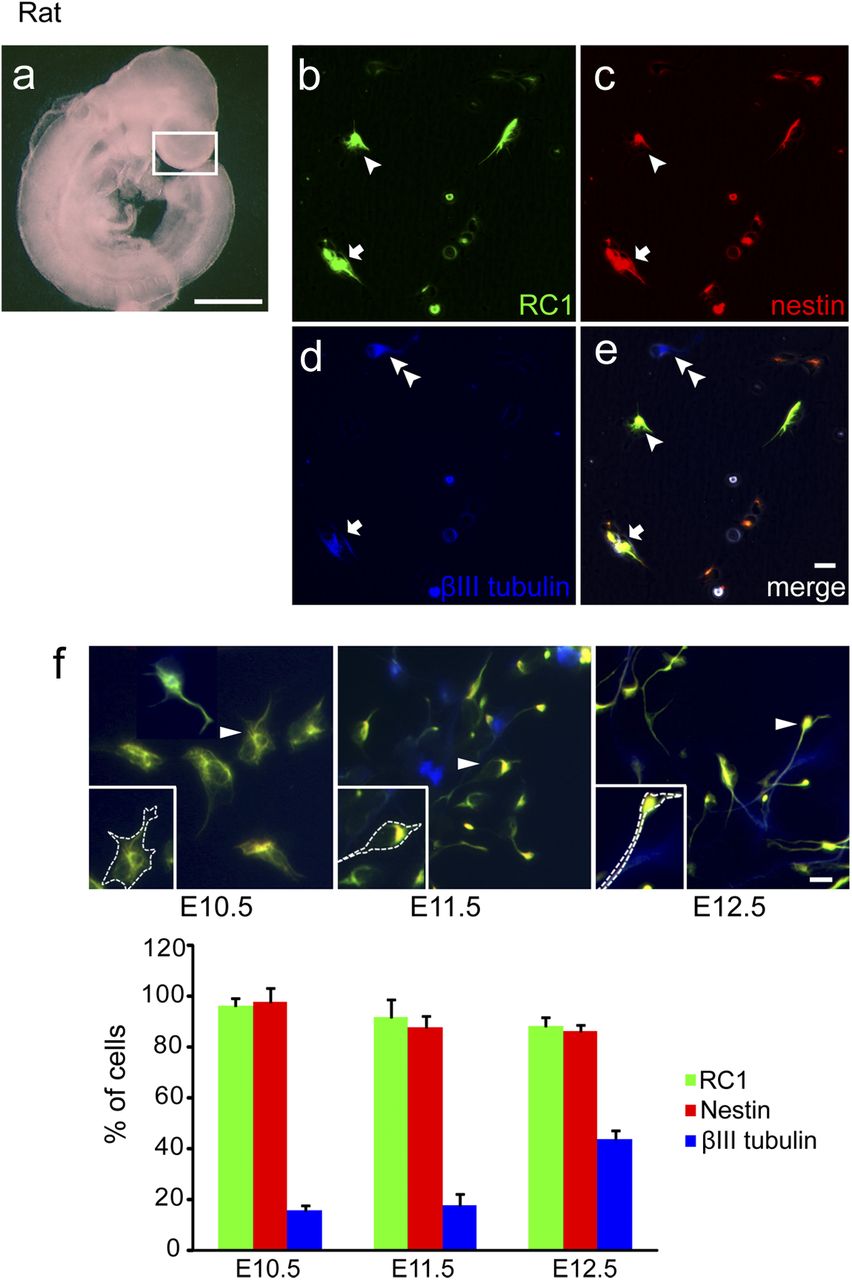
Characterization of a new precursor culture model. a, Photomicrograph of a rat embryo at E10.5. White box indicates the telencephalic region dissected for culture. Scale bar, 1000 μm. b–f, Cortical cultures consist of neural precursors and differentiating neurons at 24 h. Immunocytochemical analysis of cell-type-specific markers: b, RC1; c, nestin; d, β-III tubulin; e, merged. Arrowheads indicate RC1 and nestin double-positive cells, double arrowheads indicate β-III tubulin-positive cells, and arrows indicate triple-positive cells. Scale bar: e, 10 μm. f, Examples of typical triple immunostaining of E10.5–E12.5 precursors are shown. Cells identified by arrowheads are magnified in the insets, with dashed lines emphasizing their general morphology. Bottom, The percentage of labeled cells at 24 h is quantified. Note that a greater proportion of cells exhibit β-III tubulin at E12.5, when we observe many cells with extended processes. Data were obtained from three separate experiments, 100–150 cells analyzed per staining. Scale bar, 10 μm.
- Figure 3.
PACAP exhibits age-dependent effects on DNA synthesis and promotes G1 cyclins and G1/S-phase progression in vitro. a, Effects of PACAP exposure on DNA synthesis at 24 h in rat and mouse precursors from different ages. The timeline above the graphs details the experimental paradigm. DNA synthesis was assessed using [3H]thymidine incorporation. Data were obtained from five experiments for each species, using three wells (25,000 cells per well) per group for each experiment. Data are expressed as percentage control: control (Con) values ranged from 4000 from 12,000 cpm. *p < 0.05, **p < 0.01. b, PACAP treatment increases the proportion of E10.5 rat precursor cells engaged in S phase. BrdU-positive cells (green) and total cells (phase) were counted in 10 randomly selected fields. Scale bar, 10 μm. PACAP exposure increased the BrdU LI from 36% in control to 45% in the PACAP group at 24 h. c, Flow cytometric analysis of BrdU immunolabeling of control and PACAP-treated E10.5 rat precursors. PACAP treatment increased S-phase labeling from 43 to 50% at 24 h. d, Flow cytometric analysis of DNA content using PI indicates that more cells were engaged in S phase in response to PACAP exposure at 24 h. e, Real-time PCR analysis indicates that PACAP treatment increased cyclin D1 mRNA by 221%, cyclin mRNA D2 by 116%, and cyclin mRNA D3 by 118%, but not cyclin E (data not shown), at 24 h. Data were obtained using total RNA (50–75 embryos for each isolation) obtained from three separate experiments. f, PACAP treatment increased protein levels of cyclin D1 by 58% and D2 by 74% at 24 h, as defined by Western blot analysis. Quantifications were performed on three to four separate blots for each protein, cyclins D1, D2, D3, and E.
- Figure 4.
Effects of PACAP on cell division, cell number, and cell survival. a, Quantification of total BrdU-positive cells: vehicle [control (Con)] or PACAP was added at cell plating. Precursors in S phase were labeled with BrdU from hours 20 to 24, and one group of sister control and PACAP cultures were fixed at 24 h. A parallel set of control and PACAP cultures were rinsed twice with PBS, incubated in fresh control or PACAP medium for another 12 h, and then fixed at 36 h. At 24 h, 59% more cells were in S phase in the PACAP exposed group compared with control, consistent with increased BrdU LI in Figure 3b. At 36 h, the number of BrdU-positive cells increased in both groups, indicating that cells that entered S phase subsequently went on to divide. b, Quantification of total cell number in control and PACAP-treated cultures at 24 and 36 h. The y-axis corresponds to the total number of cells counted in 10 random fields. Whereas no difference in cell number among groups was observed at 24 h, a 61% increase was detected in the PACAP group at 36 h compared with its 24 h value, suggesting cell proliferation. Note that there was no change in control cell numbers between 24 and 36 h. c, Effects of PACAP on cell survival and cell death. PI and FDA were used to distinguish dead cells (arrowheads) and living cells (arrows), respectively. Scale bar, 10 μm. Percentage cell survival was determined as the ratio of FDA-stained cells at 24 h over 2 h. Results are expressed as mean ± SEM. *p < 0.05, **p < 0.01. Data were derived from three different experiments, two dishes per group per experiment.
- Figure 5.
Developmental transition of PAC1 receptor mRNA isoform expression during corticogenesis and regulation by RA. a, At E10.5, the level of the hop isoform is 24-fold greater than short; at E14.5, short is 15-fold greater than hop. Values are presented as fold difference when compared with the E10.5 hop mRNA levels arbitrarily set at 100. Values are representative of three experiments, three to eight animals per group for each experiment. ***p < 0.001. b, RA exposure increased differentially the short and hop isoforms at 24 h, detected using real-time PCR. Data represent three experiments, two dishes per group, n = 6 (2 × 10⁶ cells per dish) for RNA quantification. c, E10.5 precursors were incubated with either vehicle (ethanol) or RA (30 nm) at plating. At 24 h, cultures received either PACAP vehicle (Con) or PACAP (10 nm), and DNA synthesis was assessed at 48 h. In the presence of RA, PACAP increased precursor DNA synthesis, whereas the peptide had no effect in the RA vehicle group. Note that RA alone had no effect on DNA synthesis. Data represent three wells per group (25,000 cells per well) in each of three experiments for [3H]thymidine incorporation. *p < 0.05, ***p < 0.001.
- Figure 6.
shRNA knockdown of PAC1 hop expression. a, pEAK rapid HEK-293 cells were transfected with control vector or full-length rat hop or short expression vectors without and with hop shRNAs. PAC1 antibody detects both hop and short proteins including both human as well as rat. Data were derived from three experiments. Transfection efficiency was 50–60% per group. b, E10.5 precursors were transfected with either control shRNA or both hop shRNAs 2 h after plating, in the absence of PACAP (Vehicle) or the presence of PACAP (10 nm). BrdU was added at 22 h, and cells were fixed at 24 h. Cells that were transfected with control shRNA or hop shRNAs can be visualized by red fluorescence. The four groups were analyzed by one-way ANOVA, followed by Tukey's multiple comparison test. Six transfections from three experiments were performed, and transfection efficiency was 10–15% in E10.5 precursors. The number of cells analyzed from each experiment was 20–35 per dish. Scale bar, 10 μm. *p < 0.05, **p < 0.01.
- Figure 7.
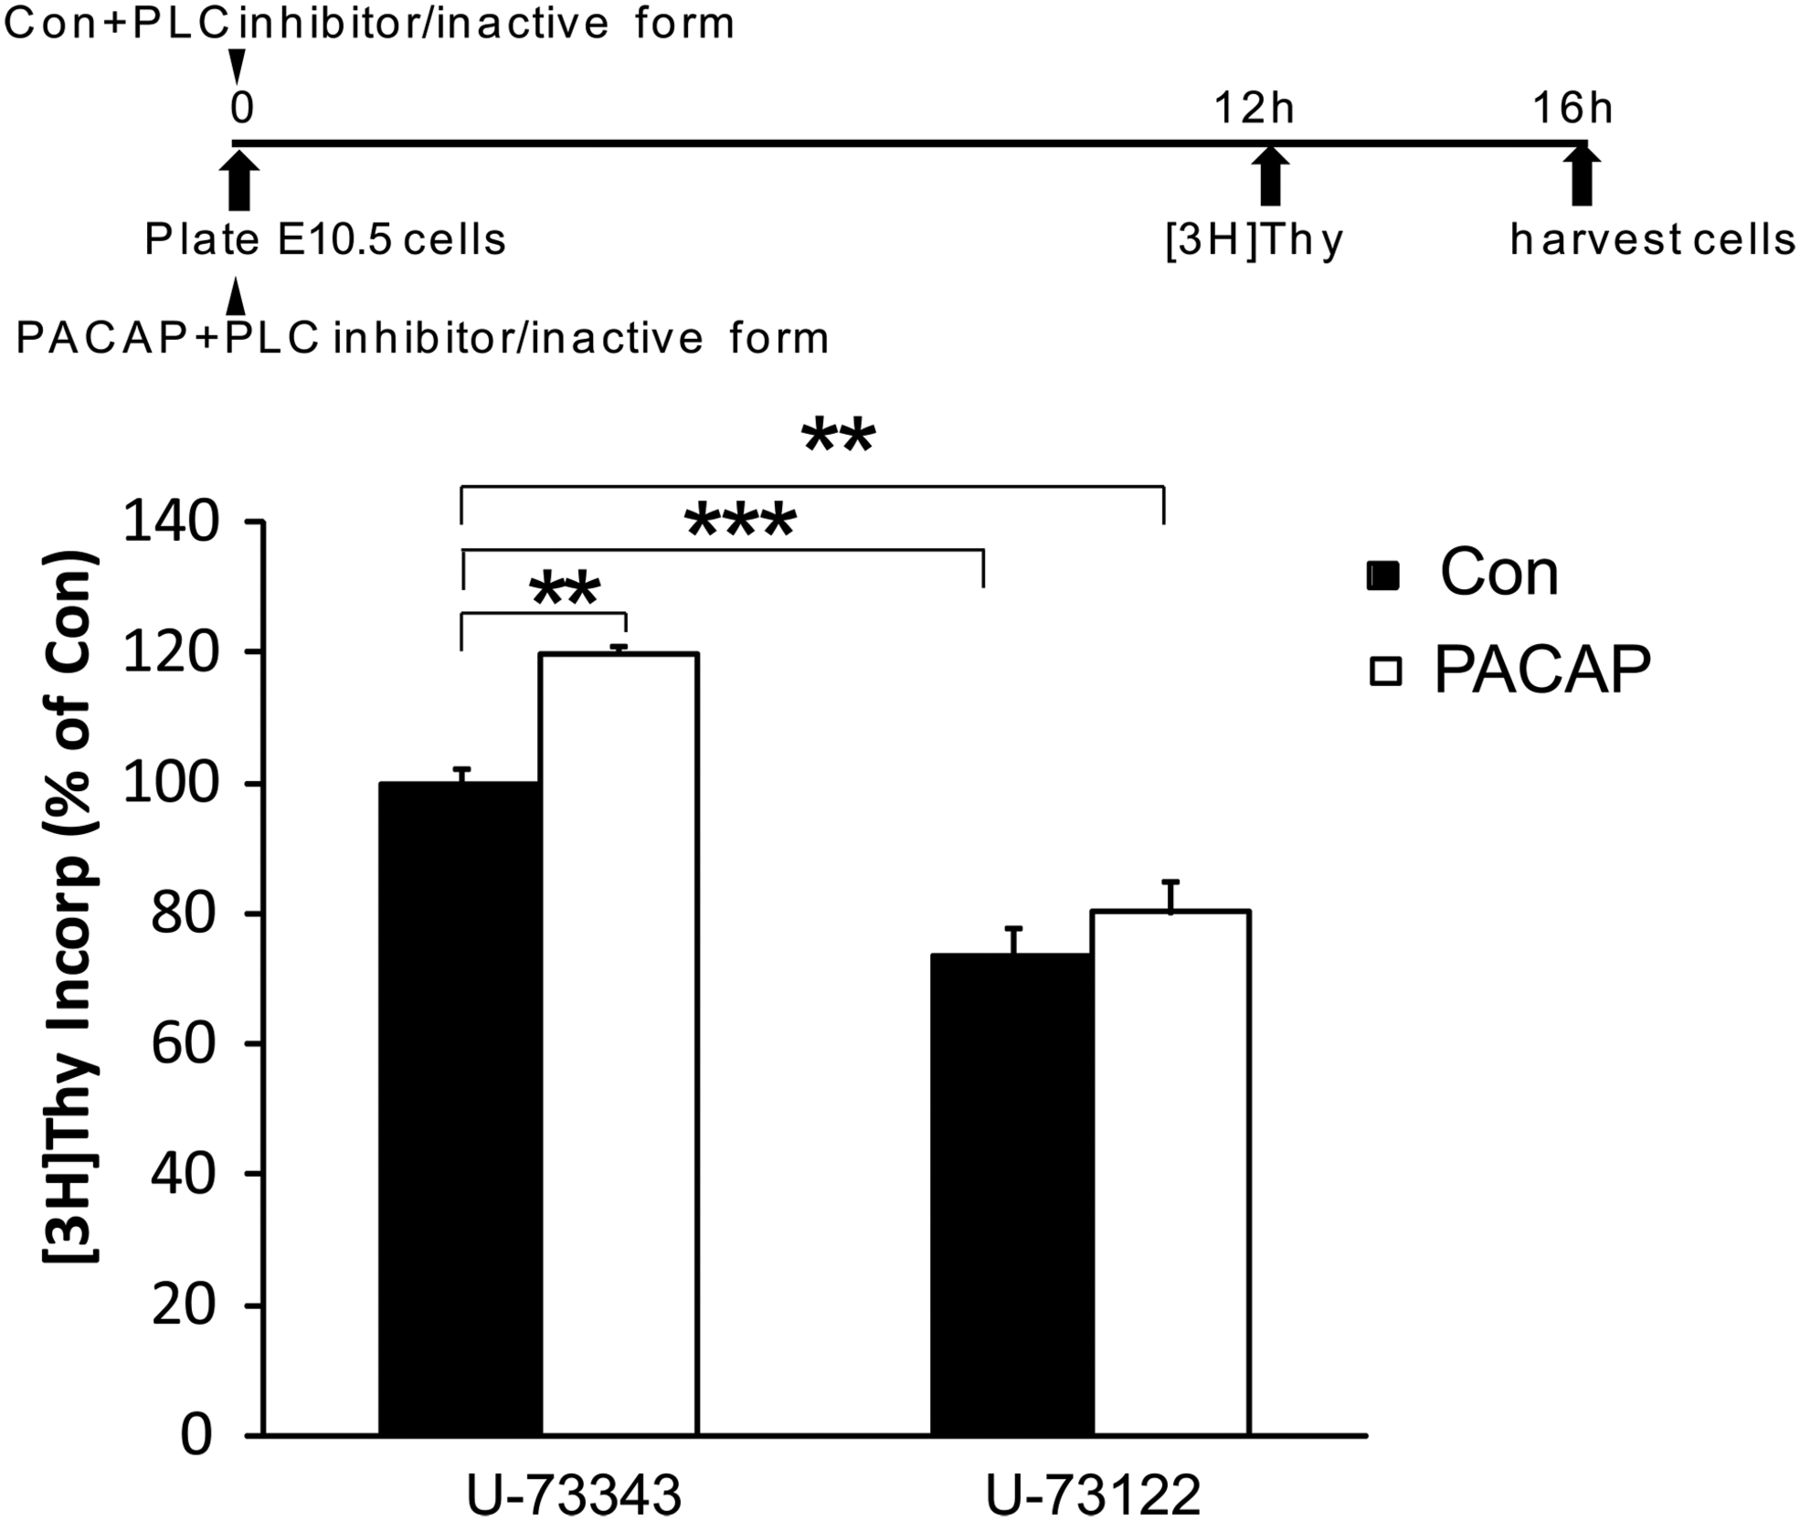
The role of PLC activation in the pro-mitogenic effects of PACAP at E10.5. In the presence of the inactive analog U-73343 (2 μm) for 16 h, PACAP increased DNA synthesis by 22%, whereas the peptide-induced increase in DNA synthesis was blocked by the PLC antagonist U-73122 (2 μm). All data bars are normalized to the control treatment (vehicle) in the presence of inactive analog U-73343, which was arbitrarily set at 100%. Control (Con) values ranged from 2800 to 7500 cpm. The four groups were analyzed by one-way ANOVA, followed by Tukey's multiple comparison test. Data were derived from four experiments, three wells per group for each experiment. **p < 0.01, ***p < 0.001.
- Figure 8.
PACAP induces intracellular Ca2+ fluxes in E10.5 but not E14.5 cortical precursors. a–c, Representative color-coded images of intracellular Ca2+ fluxes. Cells were preloaded with Ca2+ fluorescent indicator Fluo-4 AM and recorded for 110 s after reagent addition. d–g, Representative traces of intracellular [Ca2+] changes, which are reflected by ΔF/F0, ΔF = F − F0; F0 is fluorescence intensity before addition of reagents. PACAP (10 nm) exposure increased intracellular calcium levels in E10.5 (a, d) but not E14.5 precursors (b, e) at 2 h culture. KCl (40 mm) elicited increased intracellular Ca2+ in both E10.5 (f) and E14.5 (c, g). Cells were monitored by BD Pathway 855 BioImager, at 37°C/5% CO2. Data were derived from three independent experiments using parallel cultures of E10.5 and E14.5 precursors in 96-well plates. One hundred to 150 cells per group were randomly chosen in each experiment, and fluorescence intensity values were quantified.
- Figure 9.
PACAP activates PKC in early E10.5 cortical precursors but not in E14.5 cells. a, Patterns of phospho-PKC staining in E10.5 and E14.5 cortical precursors 30 min after treatment with vehicle (Con), PACAP (10 nm), and PKC agonist TPA (200 nm). PACAP exposure increased phospho-PKC-positive cells by twofold compared with vehicle in 2 h cultures, comparable with the PKC agonist at E10.5. In contrast, PACAP did not elicit changes in phospho-PKC-positive cells at E14.5, whereas both ages responded to agonist TPA. Positive cells are indicated by arrows and negative cells by arrowheads. b, Quantification of phospho-PKC immunostaining. Cells were plated in 35 mm dishes in defined media without growth factors, and reagents were added at 2 h for 30 min. Data are representative of three experiments, three dishes per group per experiment. ***p < 0.001.
- Figure 10.
PACAP did not activate phospho-ERK, whereas bFGF exposure led to ERK activation in both E10.5 and E14.5 precursors. a, Examples of phospho-ERK staining in E10.5 and E14.5 10 min after treatment with vehicle (Con), PACAP (10 nm), and bFGF (10 ng/ml). b, Quantification of phospho-ERK immunostaining. Cells were plated in 35 mm dishes in defined media without growth factors, and reagents were added at 2 h for 10 min. Data are representative of three experiments, three dishes per group.**p < 0.01, ***p < 0.001. Scale bar, 10 μm.


Tables
Calcium fluxes E10.5 E14.5 PACAP-responsive cells 201 of 220 (91%) 7 of 306 (2%) PACAP-induced oscillations 172 of 201 (86%) 0 of 306 (0%) KCl-responsive cells 137 of 168 (82%) 398 of 412 (97%) Precursors were preloaded with Ca2+ fluorescent indicator Fluo-4 AM and recorded on a BD Pathway 855 BioImager for 110 s after addition of PACAP (10 nm) or KCl (40 mm).


