

Abstract
Regions in the occipitotemporal cortex (OTC) show clear selectivity to static images of human body parts, and upper limbs in particular, with respect to other object categories. Such selectivity was previously attributed to shape aspects, which presumably vary across categories. Alternatively, it has been proposed that functional selectivity for upper limbs is driven by processing of their distinctive motion features. In the present study we show that selectivity to static upper-limb images and motion processing go hand in hand. Using resting-state and task-based functional MRI, we demonstrate that OTC voxels showing greater preference to static images of arms and hands also show stronger functional connectivity with motion coding regions within the human middle temporal complex (hMT+), but not with shape-selective midtier areas, such as hV4 or LO-1, suggesting a tight link between upper-limb selectivity and motion processing. To test this directly, we created a set of natural arm-movement videos where kinematic patterns were parametrically manipulated, while keeping shape information constant. Using multivariate pattern analysis, we show that the degree of (dis)similarity in arm-velocity profiles across the video set predicts, to a significant extent, the degree of (dis)similarity in multivoxel activation patterns in both upper-limb-selective OTC regions and the hMT+. Together, these results suggest that the functional specificity of upper-limb-selective regions may be partially determined by their involvement in the processing of upper-limb dynamics. We propose that the selectivity to static upper-limb images in the OTC may be a result of experience-dependent association between shape elements, which characterize upper limbs, and upper-limb-specific motion patterns.
Introduction
The functional organization of the ventral visual pathway is characterized by strong selectivity for particular object categories, including the human body and its parts. However, the basic properties and stimulus dimensions that determine this functional specificity are still hotly debated (Op de Beeck et al., 2008; Rajimehr et al., 2011). Some studies suggest that this selectivity stems from differences in basic shape characteristics between object categories (Tanaka, 1996; Kourtzi and Kanwisher, 2001). For example, the extrastriate body area (EBA), defined by its preference to images of the human body over other objects (Downing et al., 2001), responds to body images in either static or moving form (for review, see Downing and Peelen, 2011). It is also activated by point-light biological motion (Peelen et al., 2006), in which explicit shape information is unavailable (Johansson, 1973). Peelen et al. (2006) suggested that in that case, structure-from-motion enables the reconstruction of body shape, thereby leading to EBA activation. On the other hand, EBA partially overlaps with the motion-sensitive human middle temporal complex (hMT+; Downing et al., 2001, 2007; Ferri et al., 2012). It has been argued that EBA is directly involved in the processing of human motion kinematics (Kable and Chatterjee, 2006; Jastorff et al., 2009) and in the integration of body-shape elements with their specific motion pattern (Jastorff and Orban, 2009).
If biological motion kinematics are explicitly represented in EBA, this should be most evident in the representation of upper limbs, which are the most articulated parts of the human body and have complex kinematics. Recently, a clear functional distinction between representations of different nonfacial body parts (e.g., upper limbs and torso) has been shown both within EBA (Chan et al., 2010) and across the occipitotemporal cortex (OTC; Op de Beeck et al., 2010; Orlov et al., 2010). Notably, the preference for static images of upper limbs (but not torsos) over other objects was consistently registered in the lateral OTC (Bracci et al., 2010; Orlov et al., 2010), in close proximity to hMT+ (Weiner and Grill-Spector, 2011).
We therefore hypothesized that the functional specificity of the upper-limb area (ULA) within the OTC can largely be attributed to its involvement in the processing of upper-limb dynamics. Static views of upper limbs are strongly associated with their specific motion patterns through our lifetime of visual experience. We suggest that the observed selectivity to static images of upper limbs in ULA may reflect this coupling between limb-shape characteristics and limb-specific kinematics. Importantly, this integrative representation will critically depend on motion processing in hMT+. We therefore predicted that OTC voxels showing stronger functional connectivity with hMT+ would also show greater upper-limb selectivity to static images of body parts.
Indeed, we demonstrate here that the degree of selectivity of OTC voxels to static upper limbs is positively correlated with their strength of functional connectivity with the motion-coding region hMT+, but not with shape-selective regions (hV4/LO-1). Furthermore, we show that ULA represents the velocity profile of observed arm movements, suggesting that the functional specificity of this region is likely to reflect its involvement in the processing of upper-limb dynamics.
Materials and Methods
Participants.
Fourteen right-handed volunteers (age, 24–30 years; mean age, 27 years; five females) with no history of neurological, psychiatric, or visual deficits participated in a series of functional MRI (fMRI) experiments. All participants were scanned during a set of localization and mapping fMRI paradigms (see below). Eleven of the participants took part in the arm-motion experiment (mean age, 27 years; five females). A further subset of 11 participants (mean age, 27 years; four females, of which eight also took part in the arm-motion experiment) underwent additional resting-state scans. The Helsinki Ethics Committee of Hadassah Hospital, Jerusalem, Israel, approved the experimental procedure. Written informed consent was obtained from each participant before the procedure.
Stimuli and experimental setup.
Visual stimuli were back projected via an MR-shielded projector (Hyperion MRI Digital Projection System, Psychology Software Tools) onto a screen located behind the participants. The screen was made visible to the participants via a tilted mirror, positioned above the participants' faces.
Static body-parts localizer.
Static images of four different body-part categories (faces, upper limbs, torsos, lower limbs), as well as inanimate objects, were presented in a block-design fashion. The object images included a large range of man-made items, such as furniture, musical instruments, crockery, home appliances, food, etc. Each block lasted 6 s and comprised six images (0.8 s per image with a 0.2 s interval of gray screen). The images were selected out of a pool of 240 colored photographs, and were presented centrally, spanning 10 × 10°. Each block was presented eight times, and the five experimental conditions were counterbalanced and interleaved with “baseline” blocks comprising phase-scrambled versions of the images, while preserving the original power spectra of the images. Participants were instructed to fixate on a central fixation point, and to press a button whenever the same image (either intact or scrambled) appeared twice consecutively (a “one-back” task). This occurred on average once per block/baseline block.
Early visual cortex mapping.
We defined the early visual areas using a polar angle mapping scan (Sereno et al., 1995; Engel et al., 1997). The polar angle stimuli consisted of a clockwise rotating wedge composed of monochromatic checkerboard patterns with counter-phasing flicker frequency of 6 Hz. The radial size of the pattern segments was adjusted [using log(radius)] to approximate the cortical magnification factor (Sereno et al., 1995). Each wedge covered 45° of arc at the circumference, and extended from fixation to 14° into the visual periphery. Each scan comprised eight cycles of the rotating wedge of 48 s duration. Participants were instructed to fixate on a central fixation point. To ensure fixation was maintained throughout the run, the color of the fixation point changed for 100 ms 21 times and participants were instructed to indicate the change with a button press.
Motion localizer.
The hMT+ localizer was similar to that used by Huk et al. (2002). Participants were presented with a dot pattern that was either moving at 8°/s [alternating direction radially inward and outward from fixation once per second (10 s)] or stationary (10 s). Participants were instructed to fixate on a central fixation point and covertly count the number of fixation point blinks (presented 25 times throughout the scan). During a motion block, 1200 white dots on a black background were presented within a 14 × 14° aperture, centered at the fixation point. Each dot appeared for 100 ms and was then replaced by another dot at a randomly selected position. The moving/stationary pair of blocks was repeated 10 times.
Resting-state fMRI.
Participants were asked to lie still for 6 min. The scan was repeated twice, once with eyes open and once with eyes closed. The open-eye and closed-eye scans were counter-ordered across participants.
Arm-motion experiment.
Cortical sensitivity to the velocity profile of seen arm movement was assessed using a set of arm-motion videos in an event-related fMRI paradigm. A set of videos was designed to parametrically manipulate kinematic properties while minimizing variance in arm shape.
To create a parametric set of arm movements, a natural left-arm extension movement, performed by an actor, was filmed from a side view, showing the full horizontal spread of the movement. The speed of the arm extension movement was manipulated using a time-remapping function of Adobe Premiere software (Adobe Systems) that skips or creates the necessary interpolated frames to speed up or slow down a clip, respectively. This resulted in the generation of four arm “extension” video clips of 4, 8, 12, and 16 frames long.
Next, the order of the frames in each of the four clips was reversed, resulting in four corresponding arm flexion movements. The “extension” and “flexion” clips were then concatenated to produce four videos of equal length (20 frames at the rate of 25 frames/s, lasting 800 ms) with different “flexion”/”extension” speed ratios (ranging between 0.25 and 4; see Fig. 3; Movie 1; the leftmost frames in Fig. 3 are from the first clip in the video, etc.). The four videos were further flipped horizontally to obtain four additional right-arm videos with the same kinematic parameters in the opposite direction. In total, eight speed-based morphs were used. In each trial, a single morphed video was repeatedly presented (for three consecutive presentations). The videos were displayed at the center of the screen, such that the arms were moving within a window 9 × 4°, and the middle of the movement trajectory was approximately at the position of a fixation point, superimposed on the videos.
Each of the eight morphed videos was presented 48 times over the course of six runs in a counter-balanced manner, using Optseq procedure. The trials (2400 ms) were pseudorandomly embedded with rest periods (a black screen with a fixation) ranging from 1600 to 7600 ms. Each run was 318 s long (159 volumes), beginning with a 6 s fixation period and ending with a 10 s fixation period.
Participants were required to maintain their gaze on the fixation point. To ensure fixation was maintained throughout the experiment, the color of the fixation point changed for 300 ms in 25% of the trials and participants were instructed to indicate the change with a button press. In addition, the eye position of four (of 11) participants was tracked using the eye-tracking device (SensoMotoric Instruments), sampling the eye position at 50 Hz. The average shift in eye position from the fixation during trials ranged between 0.2 and 0.6° across participants (with SD ranging between 0.3 and 1.3°), indicating that fixation was relatively stable.
While effort was made to keep arm-shape information consistent across the videos, the frames across those video pairs were not identical (with the exception of speed ratios 0.25 vs 4 and 0.67 vs 1.5, in which the individual single frames were identical, but played in reverse). To estimate shape similarity between the single frames, a shape description algorithm was applied (Belongie et al., 2002). Shape-similarity scores (estimated for all possible frame pairs, n = 780) were classified as “within” or “between” the videos and then compared using a two-tailed t test.
To assess the degree of kinematic (dis)similarity across the videos, we ran an edge detector algorithm to sample the edges of the arm over two frames in each video separately (showing an arm at maximally flexed and maximally extended positions). We then extracted the edges of the fist and elbow from each of these two frames (see Fig. 3, left, blue dots) and determined the speed of each of the four edge points during the extension and flexion episodes, separately. The speeds were then averaged across the four edge points, yielding extension and flexion speed values for each of the morphed videos.
To estimate a degree of (dis)similarity for each pair of movements, we first calculated the difference in their contour speeds for extension and flexion components separately. We then calculated the Euclidean distance between the speed vectors across video pairs to yield an overall (dis)similarity estimate (D): D = (Δextension2 + Δflexion2)̂ 0.5.
Since human speed discrimination thresholds follow Weber's law (De Bruyn and Orban, 1988) and speed tuning curves of MT neurons in monkeys are bell-shaped as a function of the logarithm of speed (Nover et al., 2005), we added a logarithm term to the (dis)similarity measure: D = ln[(Δextension2 + Δflexion2)̂ 0.5].
MRI acquisition.
The blood oxygenation level-dependent (BOLD) fMRI measurements were acquired using a Siemens whole-body 3 tesla Magnetom Trio scanner and a 32 channel head coil. The fMRI protocols were based on multislice gradient echo-planar imaging with the following timing parameters: TR, 2 s; TE, 30 ms; flip angle, 90°, imaging matrix, 64 × 64; FOV, 192 × 192 mm. Thirty to thirty-four slices with 3 mm slice thickness (and 0.3 mm gap) were oriented in the axial plane, covering the whole cortex, with partial coverage of the cerebellum. The functional voxels thus measured 3 × 3 × 3 mm. T1-weighted anatomical images were obtained using a magnetization-prepared rapid acquisition gradient echo sequence (160 slices; TR, 2300 ms; FOV, 256 × 256 mm; matrix size, 256 × 256; flip angle, 9°; TE, 4.25 ms; 1 mm slice thickness).
fMRI data preprocessing.
fMRI data were processed with BrainVoyager QX software (version 2.6, Brain Innovation). Subsequent analyses were performed using Matlab (version 7.11, The Mathworks) and SPSS (version 16.0 for Windows, SPSS). For each run, the 2D functional data were examined for motion and signal artifacts. Head-motion correction, high-pass temporal filtering in the frequency domain (3 cycles/total scan time), and slice scan time correction were applied. The slice-based functional images were coregistered with the high-resolution 3D anatomical image. The complete functional datasets were then resampled into a standard 3D space (Talairach and Tournoux, 1988) with 3 mm isotropic resolution. Individual participant data in the arm-motion experiment were smoothed using a Gaussian 4 mm FWHM kernel to improve signal-to-noise ratio in further multivoxel pattern analysis (MVPA). Other functional data were analyzed with no spatial smoothing. The cortical surface of each participant was reconstructed from the high-resolution T1-weighted scan, which was transformed into the standard brain template. The obtained mesh was corrected for topological errors and morphed to create the inflated cortex surface.
Selection of regions of interest and OTC mask.
Eleven regions of interest (ROIs) were defined using the motion, static body-part, and retinotopic localizers. These included low-level, retinotopic areas V1–V3; shape-sensitive cortical regions hV4, LO-1, and lateral occipital complex (LOC); motion-sensitive areas V3A and hMT+; and ULA, a cortical region showing preference to upper-limb images (over other image categories). In addition, two face-selective cortical regions were defined as control ROIs with respect to ULA [the fusiform face area (FFA) and a region in the posterior superior temporal sulcus (STS) and adjacent medial temporal gyrus (MTG), termed here STS/MTG]. All ROIs were identified as isolated clusters of voxels, defined in brain volumes on a participant-by-participant basis, after alignment to standard space in the Talairach coordinate system (using linear transformations as implemented in Brain Voyager software). All above ROIs were used for MVPA, and half of them (hV4, LO-1, LOC, hMT+, and V3A) served as seeds in functional connectivity analysis.
hMT+, ULA, LOC, FFA, and STS/MTG ROIs.
To localize hMT+, ULA, and LOC individually for each participant, we applied a conventional general linear model (GLM). A predictor time course was obtained by convolution of a condition box-car time course with a two-gamma function (Friston et al., 1998). hMT+ was defined bilaterally based on its greater BOLD response to moving dots compared with stationary dot patterns, as well as on anatomical landmarks that enabled dissociation from other (lower level) motion-responsive regions. Using the static body-parts localizer, we defined the ULA ROI bilaterally by identifying voxels in the dorsolateral OTC that were selectively more responsive during passive viewing of arm images, relative to other image categories (faces, torsos, lower limbs, and man-made objects), as defined using a single weighted contrast (significant voxels in the ventral OTC were not included in the ROI since they were not reliably identified in all participants). LOC was defined bilaterally based on its greater BOLD response to object images compared with their scrambled counterparts (Grill-Spector et al., 1999). The LOC ROI comprised the voxels located in the lateral occipital cortex (excluding voxels in the posterior fusiform gyrus; Grill-Spector et al., 1999; Sayres and Grill-Spector, 2008). We also identified voxels showing greater responses to face images than objects to localize FFA and the face-selective STS/MTG region (Kanwisher et al., 1997). While the hMT+, ULA, LOC, and FFA ROIs were identified bilaterally in all 11 subjects who participated in the arm-motion experiment, the STS/MTG ROI was only identified in seven participants (in two of them, in the right hemisphere only). Relevant voxels were defined in brain volumes, after alignment to standard space in Talairach coordinate system. The resulting ROIs were isolated clusters of voxels fitting a false discovery rate (FDR) criterion to correct for multiple comparisons (Benjamini and Hochberg, 1995). The threshold t values for the ROIs were set to meet the FDR criterion of q(FDR) < 0.05. To achieve approximately equal hMT+, ULA, and LOC ROI sizes across all participants, the statistical threshold of the localizers' GLM contrast in some participants was elevated, such that the ROIs consisted of ∼100–150 voxels with 3 mm isotropic resolution. In total, across participants from both arm-motion and resting-state experiments, hMT+ and ULA, hMT+ and LOC, and ULA and LOC shared 13–37% (mean, 25%), 1–14% (mean, 7%), and 2–15% (mean, 7%) of their voxels in Talairach space, respectively (where 100% is the total amount of voxels in each pair of ROIs). Furthermore, LOC shared voxels with retinotopically defined LO-1 [0–21% (mean, 7%); Sayres and Grill-Spector, 2008]. In rare cases, some overlapping voxels were also found between hMT+/ULA and LO-1, or between LOC and V3. Due to these spatial overlaps, a second set of bilateral hMT+, ULA, and LOC ROIs was constructed for each individual, excluding any overlapping voxels (mean ± SD: 64 ± 15, 67 ± 22, and 67 ± 28 voxels with 3 mm isotropic resolution, respectively). This assured that hMT+, ULA, and LOC ROIs consisted of independent voxel sets. Group-mean x-y-z Talairach center-of-mass coordinates for the ROIs in the left and right hemispheres were the following: hMT+: −44, −72, 3 and 43, −67, 2; ULA: −50, −70, 3 and 46, −66, 2; LOC: −42, −77, −5 and 37, −76, −4; FFA: −39, −58, −18 and 34, −54, −16; STS/MTG: −48, −72, 11 and 44, −66, 10, respectively.
Visual cortex retinotopic mapping.
We used a phase-encoding approach (Sereno et al., 1995; Engel et al., 1997) to construct retinotopic maps, as implemented by BrainVoyager QX software. The individual polar maps (overlaid on corresponding inflated cortical surfaces of participants) were used to manually delineate the borders of retinotopic areas (Wandell et al., 2007). In each individual map, we were able to reliably identify V1, V2, V3, hV4, V3A, and LO-1 bilaterally using cortical surface meshes (i.e., voxel data were assigned to surface vertices using nearest neighbor interpolation). Then the delineated areas were projected back to volume space and the corresponding volume-based ROIs were defined. V3A was first delineated, based on its retinotopic boundaries, and was then restricted to voxels showing greater BOLD response to moving dots, compared with stationary dot patterns. The threshold t values for the V3A ROIs were set to meet a criterion of q(FDR) < 0.05. Any overlapping voxels between the retinotopically and functionally defined ROIs (e.g., between LO-1 and LOC) were excluded (see above).
OTC target mask.
To identify patterns of upper-limb selectivity and functional connectivity (FC) across the OTC, an individual target mask was created in the left and right OTC for each participant, using the static body-parts localizer. We identified voxels that significantly responded to any of the nonfacial body-part image categories (upper limbs, torsos, lower limbs) or man-made objects, relative to the scrambled versions of these images [q(FDR) < 0.05 for all]. Voxels overlapping with retinotopically defined V3, V3A, hV4, and LO-1, and voxels overlapping with hMT+ localizer were excluded from the participants' masks. When the individual LOC ROIs were used as seeds, LOC localizer voxels were excluded from the masks instead of LO-1 voxels. Note also that all voxels shared between ULA and hMT+ were removed. For the purpose of the FC investigation, we were interested in comparing nonrigid, highly dynamic objects (such as limbs) with less flexible or typically inert objects (such as torsos and man-made objects). Since faces included both relatively rigid (e.g., nose) and articulated features (e.g., lips), we excluded this category from the analysis. For each of the remaining four categories (upper limbs, torsos, lower limbs, and objects), we next defined a voxelwise category selectivity index within the individual masks, using the t value resulting from the contrast between each category condition and the mean of the three other conditions (as implemented in BrainVoyager QX GLM analysis).
Resting-state fMRI.
To account for non-neuronal noise that might bias FC analysis, we extracted the resting-state time series of BOLD response underlying white matter (extracted from bilateral masks in the centrum semiovale) and CSF (extracted from the lateral ventricles) using the preprocessed (high-pass filtered) resting-state individual scans (Zhang et al., 2008). The first eigenvector was calculated for each of these two regions, in each scan separately (O'Reilly et al., 2010; these eigenvectors best characterize the majority of observed signal variation across the set of voxels within the regions; Friston et al., 1996). Time series representing scan-specific head motion (in six directions) were also extracted. In total, there were eight confound time series for each run. The confound time series were regressed from the preprocessed functional data for each run separately, before the connectivity analysis. The resulting time-series residuals were z-transformed and the two resting-state scans (eyes open and eyes closed) were concatenated for each brain voxel, in each individual participant.
We used the individually defined hMT+ (exclusively comprising hMT+ voxels, while excluding voxels overlapping with ULA and LOC) and the hV4 seed ROIs to calculate FC maps across the OTC during rest. To construct seed time series, the first eigenvector was calculated for the left and right hMT+ and hV4, extracted from the concatenated voxel's residuals. Figure 1A (inset) depicts the time series of the hMT+ (blue line) and hV4 (green line) eigenvectors in one representative participant, superimposed on the resting-state time course of an example target voxel of that participant (black line, after correcting for confounds as mentioned in the previous paragraph). Next, for each voxel in the OTC target mask, a partial correlation score was calculated between its time series and the first eigenvector in each of the ipsilateral seeds, while accounting for the partial contribution of the other seed. In the same way, partial correlation scores were calculated for the contralateral seeds. This approach has been previously shown to correctly estimate the true functional connections between target voxels and multiple seeds (Smith et al., 2011). The obtained partial correlation coefficients (after applying Fisher's z-transform) represented the index of FC between each seed region and every voxel in the bilateral OTC.
We then examined the relationship between category selectivity of individual OTC voxels and their functional connectivity with the four seed regions. First, for each target OTC voxel, we assessed a connectivity preference index (by calculating difference between its hMT+ and hV4 connectivity indices), for ipsilateral and contralateral seed pairs separately. This index represented whether a given voxel is more connected to hMT+ or hV4, yielding ipsilateral and contralateral FC preference maps for each hemisphere, in each participant. We then calculated a Pearson's correlation coefficient between each of the FC preference maps and each of the categorical selectivity maps. The obtained correlation coefficients (after applying Fisher's z-transform) were averaged, first across hemispheres (per ipsilateral and contralateral seeds, separately) and then across participants. The significance of the group-mean correlations was assessed by two-tailed paired t tests (using Šidák correction for multiple comparisons). Furthermore, to verify that these correlations are significantly higher than expected by chance, we ran a permutation analysis where the identity of the four category conditions in the static body-parts localizer (i.e., “upper limbs,” “torsos,” “lower limbs,” and “objects”) were randomly reassigned (the “scrambled” intervals and “face” condition were not changed). We repeated this procedure 1000 times, and calculated a “chance” category preference for each voxel in each permutation. We then performed the correlation analysis between each of the functional connectivity maps and the permuted category indices, resulting in a distribution of expected group-mean correlations merely due to noise.
The above FC analyses were repeated with LO-1, LOC, and V3A as seeds (see Results). We also repeated the analyses with hMT+ and hV4 seeds, while excluding all ULA voxels from the target OTC mask (not only those that overlap with hMT+).
In an additional control analysis, we applied the same approach as above, but this time only the highest connectivity value across the hMT+ and hV4 seeds (the maximal connectivity index) was chosen to represent the connectivity between the OTC voxel and the seeds. For each OTC voxel, we first identified a voxel in each of the four seed ROIs (i.e., ipsilateral and contralateral hMT+ and hV4), which maximally correlated with it (as assessed by Pearson's correlation). Next, partial correlation scores were calculated for the ipsilateral hMT+ and hV4 voxels (accounting for the partial contribution of the other seed voxel), as well as for the contralateral ones.
ROI-based MVPA.
Data from the six event-related runs in the arm-motion experiment were analyzed using a split-half analysis (Haxby et al., 2001). However, rather than splitting the data once into odd and even runs, we iterated this process through 10 different splits of the six runs (Chan et al., 2010). For each half of the data in each split, a standard GLM procedure was used. The magnitude of response (β weights) was calculated for each of the eight task conditions (i.e., four movies with different “extension”/”flexion” speed ratios for left and right arms). The calculation was performed in individual voxels within each of the 11 ROIs (i.e., V1, V2, V3, V3A, LO-1, hV4, hMT+, ULA, LOC, FFA, and STS/MTG), for the left and right hemisphere separately. These β weights were then normalized (by subtracting the voxel's mean activation level across conditions) and cross-correlated against their corresponding halves within each ROI separately. The obtained correlation coefficient values were normalized (using Fisher's z-transform) and averaged across the 10 different splits. Then 16 correlations for each arm (from 64 correlations in total) were further averaged across the left and right arm movements with identical extension/flexion speed ratios, resulting in a 4 × 4 correlation matrix. The normalized correlation coefficients for each matrix cell were averaged across hemispheres for each participant. Cells corresponding to same or different arm-motion videos (see Fig. 6B, inset) were averaged for each individual participant within each ROI resulting in Same and Different correlations. Finally, the correlations were averaged across participants; the means were subtracted and divided by the pooled SD to obtain Cohen's d values (see Fig. 6C).
The ability to discriminate between the videos was assessed using two-tailed paired t tests (and Šidák correction for multiple comparisons). In addition, we used a permutation analysis to test whether the Cohen's d values in the ROIs are significantly higher than expected by mere chance (e.g., had there been no discrimination between the videos). The matrix correlation coefficients were randomly assigned to each entry in the correlation matrix for each arm in each participant. This procedure was repeated 1000 times, and the same analysis as described in the previous paragraph was repeated, resulting in a chance distribution of Cohen's d values for each ROI. Given this chance distribution, we could assess the significance of d identified in the ROIs.
To estimate the role of movement kinematics in modulating multivoxel activation patterns, we applied an ordinary least-squares regression on the correlation coefficient in the 4 × 4 matrix described above (after applying Fisher's z-transform). We used a parametric predictor based on the degree of kinematic (dis)similarity across the videos (i.e., the Euclidean distances between speed vectors of video pairs; see above). We therefore assigned a corresponding predictor value (see Fig. 6D, inset) to each correlation entry in the 4 × 4 correlation matrix for each participant. We then concatenated individual correlation matrices and calculated r2 values (across participants) for each ROI to estimate how much variance in the matrix is explained by the kinematic (dis)similarity predictor. An F test was used to determine whether the observed r2 is statistically reliable.
Finally, we probed the degree to which the identity of the moving arm (left vs right) can be decoded from the multivoxel activation patterns. To that end, in each participant we separately averaged all (normalized) correlation coefficients that corresponded to the same arm identity, and the ones with different arm identity, regardless of their kinematics, resulting in a 2 × 2 correlation matrix. Cells corresponding to the same or different arm identity were further averaged across hemispheres for each participant within each ROI. Finally, the correlations were averaged across participants. The ability to discriminate between left and right arm movements was assessed using two-tailed paired t tests (and Šidák correction for multiple comparisons).
Whole-brain searchlight MVPA.
To test sensitivity across the entire brain to the kinematics of arm movement, we applied a volume-based searchlight analysis (Kriegeskorte et al., 2006). For this purpose the data from six runs were divided according to the 10-split procedure described above in every voxel in Talairach space. For each participant, we iteratively searched through the brain with a search window defined as a sphere of radius 6 and 9 mm (i.e., two and three voxels, as in Kriegeskorte et al., 2006), resulting in an ROI of 33 and 123 isotropic voxels of 3 × 3 × 3 mm, respectively. On each iteration the window was centered on a new Talairach voxel, and multivoxel correlation analysis was performed as described for the ROI-based MVPA. To create a group searchlight map, individual correlation values for Same and Different comparisons were z-transformed and averaged across participants (for each search window separately). Clusterwise t tests were used to identify search windows showing significant difference between Same and Different correlations [FDR corrected, q(FDR) < 0.001]. We then compared the obtained group searchlight map with ULA and EBA groupwise localizers (defined using random effects GLM analysis; the functional datasets for the groupwise localizers were spatially smoothed using a Gaussian 4 mm FWHM kernel). To localize ULA at the group level, we applied the same contrast as for individual ULA localizers, while EBA was defined by contrasting the body categories (upper limbs, lower limbs, and torsos) versus the objects category (p < 0.001 for all, cluster size corrected at p < 0.05; this was calculated taking into account the probability of a false detection for any given activation cluster and accomplished by Monte Carlo simulation incorporated in BrainVoyager QX).
To create individual searchlight maps, the difference between Same and Different correlations (Δ) was calculated for each search cluster (defined as a sphere with a 9 mm radius) in each participant's brain. To eliminate false-positive search clusters that may result from spurious, noisy BOLD responses, we first applied a signal-to-noise test, thereby pruning the least-reliable search clusters (Mitchell et al., 2004). To that end, for each voxel in each participant's brain, we calculated a t value of the voxel's BOLD response to each of the eight task conditions (estimated relative to rest periods). Brain voxels were ranked according to this t value for each condition separately. A search cluster was chosen for the analysis if ≥1 voxel in the cluster had a high t value rank (i.e., it was within 5000 “best” voxels for ≥1 task condition). This resulted in ∼1.2 × 10⁴ search clusters for each participant. To infer statistical significance on a single participant level, a further permutation analysis was performed (Stelzer et al., 2013): for each search window, the specific 4 × 4 matrix correlation coefficients were randomly assigned to each matrix entry for each arm. This procedure was repeated 1000 times, and the same analysis as described in the previous paragraph for the ROI-based MVPA was performed, resulting in a chance distribution of Δs between Same and Different correlations, for each individual searchlight cluster. Given this chance distribution, we could assess the significance of each search cluster in its ability to discriminate between same and different arm-movement videos. The resulting maps were corrected for multiple comparisons by applying permutation testing (Monte Carlo simulations implemented in BrainVoyager QX) to estimate the cluster-size threshold corresponding to the error probability of p < 0.05.
Results
Functional connectivity of OTC voxels with hMT+, but not hV4/LO-1, reflects upper-limb selectivity patterns
Since the sources of feedforward information into OTC (e.g., hV4 and hMT+) are somewhat specialized for processing different aspects of visual stimuli (Ungerleider and Mishkin, 1982; Van Essen et al., 1992; Nassi and Callaway, 2009), their degree of connectivity with OTC voxels may affect the voxels' preference to particular object categories. If selectivity to static upper limbs in the OTC is driven by shape information, then voxels showing greater selectivity to upper limbs should also show increased connectivity to hV4. However, if OTC representation of upper limbs is driven by their ability to move, then this selectivity should be associated with increased connectivity to hMT+. We therefore studied the relationship between FC patterns of OTC voxels with hMT+ and hV4, and their selectivity in representing certain object categories.
To address this working hypothesis, for each participant we generated FC maps across the OTC with two bilateral seed regions: hV4 and hMT+ (any voxels in the hMT+ seed that were shared with ULA were excluded from the analysis). To estimate the degree of FC between each voxel in the target OTC mask (see Materials and Methods) and the seeds, we calculated the partial correlation between each voxel's time series and the first eigenvector of each seed (Fig. 1A, top). This approach was designed to parcel out common source components and measure the unique (and potentially even direct; Smith et al., 2011) temporal relationship between the target voxels and the seeds. This analysis was carried separately for each seed, resulting in a connectivity index (i.e., a partial correlation coefficient) for each target voxel within each seed FC map. Figure 1A (bottom) shows a map of voxelwise connectivity indices in the OTC of a representative participant with each of the designated seed ROIs (hMT+ and hV4: left and right maps, respectively; the corresponding seeds are shown in white contours).

The relationship between OTC voxel patterns of selectivity (to specific image categories) and connectivity (with hMT+ or hV4) in an individual participant. A, Top, The resting-state time course of an example OTC voxel in one participant showing strong selectivity to upper limbs (black line) and the primary eigenvector time series of the hMT+ (blue line) and hV4 (green line) seeds in the same participant. Note that only voxels that did not overlap with ULA were included in the hMT+ seed. The (partial) correlation coefficient between each seed eigenvector and the voxel's time course is taken as the measure of functional connectivity between that voxel and the seed (i.e., connectivity index). Bottom, Color-coded maps indicate the degree of connectivity between each voxel in the OTC target region and hMT+ (left) or hV4 (right) seeds, shown on the participant's inflated right hemisphere (from the ventrolateral view). The location of the example voxel is marked by a white square and the locations of the seed ROIs are indicated by white contours. B, Color-coded maps depict voxelwise selectivity to static images of upper limbs (left) or man-made objects (right) within the OTC region. C, Scatter plots depict the difference (Δ) between voxel connectivity with hMT+ and hV4 (abscissa), against the selectivity of the same voxels (ordinate) to images of upper limbs (top, purple plots) and objects (bottom, gray plots). Positive voxels' Δs (black arrow to the right) indicate stronger FC to hMT+ while negative Δs (the arrow to the left) indicate stronger FC to hV4. Upper-limb selectivity (top) resulted in a positive correlation with connectivity Δ, suggesting that upper-limb selectivity is positively associated with hMT+ connectivity. Object selectivity (bottom) resulted in a negative correlation with connectivity Δ, suggesting that object selectivity is positively associated with hV4 connectivity. The same example voxel (out of 599 in this specific hemisphere) is indicated by a red dot in each plot. The best regression line and the correlation coefficient for the fit are presented for each case.
In addition, each target OTC voxel was assigned an index of its category selectivity (for each category separately: upper limbs, torsos, lower limbs, or objects), by calculating a t value for the difference between the BOLD activation level to one specific category, and the mean activation estimate for the other three categories. The example maps in Figure 1B show the distribution of selectivity indices to upper limbs (left) and objects (right) within the OTC voxels of the representative participant.
To quantify the relationship between the patterns of selectivity and FC, we calculated for each OTC voxel the difference (Δ) between its connectivity to hMT+ and hV4 (for ipsilateral and contralateral seed pairs, separately), yielding a voxel's connectivity preference measure. The scatter plots in Figure 1C depict the connectivity preference index of each of the OTC voxels, plotted against their selectivity to upper-limb and object images, in the representative participant. Positive and negative Δs in Figure 1C indicate relatively stronger functional connections to hMT+ and hV4, respectively. Significant correlation between the voxels' Δs and their selectivity to a particular image category would indicate a relationship between image categorical selectivity within the OTC and FC patterns. Zero or near-zero correlation would point to the absence of a relationship between the voxels' categorical and connectivity preferences. For the representative participant in Figure 1C, stronger coupling with hMT+ coincided with increased selectivity to upper limbs (r = 0.67) while stronger coupling with hV4 was associated with the voxels' preference for objects (r = −0.64).
This pattern of results was replicated across participants, as indicated in Figure 2A. Colored bars show group mean Pearson's correlation coefficients (averaged across hemispheres) between OTC voxels' selectivity for a particular image category and their connectivity preference index. We first considered connectivity patterns between the OTC region and each of the ipsilateral seeds (Fig. 2A, top). The degree of target voxels' FC preference toward hMT+ was significantly associated with their selectivity to upper limbs (p < 0.001; the significance levels were calculated using a permutation test; see Materials and Methods). Selectivity to lower limbs and torsos varied independently from FC preference (p = 0.20 and p = 0.25, respectively). Conversely, voxels showing stronger FC with hV4 also showed higher selectivity to objects (p < 0.001). A similar pattern of correlations was evident when the connectivity preference index was calculated for hMT+ and hV4 seeds in the contralateral hemisphere (p < 0.001, p = 0.24, p = 0.32, and p < 0.001, respectively; Fig. 2A, bottom).

Selectivity of OTC voxels to static images of upper limbs is positively associated with their level of connectivity with hMT+. A, Colored bars show the group-mean correlations between the OTC voxels' selectivity for a particular image category (purple, upper limbs; dark blue, lower limbs; dark gray, torsos; light gray, objects) and their connectivity preference index calculated for the ipsilateral (top) and contralateral (bottom) hMT+ and hV4 seeds. Positive correlation (black arrow to the right) indicates that selectivity to a particular image category is positively associated with hMT+ connectivity. Negative correlation (arrow to the left) indicates that the selectivity is positively associated with hV4 connectivity. B, C, The same functional connectivity analysis was repeated for hMT+ and two other shape-selective regions, LO-1 (B) and LOC (C). The error bars indicate SEM. Dashed lines, Significance level for the correlations at p < 0.05, as obtained using permutation analysis. Asterisks denote significant differences when comparing the group-mean correlation coefficients for upper limbs with either objects or torsos (or for lower limbs with either objects or torsos) using a two-tailed t test. The levels of significance are indicated as follows: *p < 0.05; **p < 0.01; ***p < 0.001.
The positive association between OTC voxels' selectivity to upper-limb images and their degree of connectivity to hMT+ could potentially be due to the greater spatial proximity of ULA to hMT+, compared with its proximity to hV4 (see Materials and Methods for details about the degree of spatial overlap between these ROIs). To rule out this possibility, we repeated our FC analyses with a set of other shape-selective and motion-selective areas, namely LO-1, LOC, and V3A.
LO-1 is a retinotopically defined shape-sensitive region that is anatomically closer to ULA than hV4, yet comparable to hV4 in terms of its position in the putative visual hierarchy (Larsson and Heeger, 2006; Sayres and Grill-Spector, 2008). On the other hand, LOC serves as an ideal control to test the possible confounding proximity factor, because it is more shape-selective than hV4 or LO-1 (Grill-Spector et al., 1999; Larsson and Heeger, 2006; Amano et al., 2009) and also overlaps with hMT+ and ULA (as well as with EBA; Downing et al., 2007). The patterns of results associated with these new seed ROIs were very similar to our original observations with hV4: OTC voxels showing greater preference to static images of upper limbs showed stronger functional connectivity with hMT+, even when this was compared with their connectivity with LO-1 or LOC [Figure 2B,C; LO-1: ipsilateral seeds: p < 0.001, p = 0.16, p = 0.29, and p < 0.001 for upper limbs, lower limbs, torsos, and objects, respectively; contralateral seeds: p < 0.01, p = 0.15, p = 0.32, and p < 0.001 respectively; LOC: ipsilateral seeds: p < 0.001, p = 0.15, p = 0.15, and p < 0.05; contralateral seeds: p < 0.01, p = 0.20, p = 0.23, and p < 0.05, respectively]. Thus, cortical distance, per se, cannot explain the selectivity–connectivity relationship we observed.
To finally rule out the confounding distance factor (and to exclude possible influence of spatial blurring of the BOLD signal due to vascular drainage or partial volume effect), we repeated the FC analysis of OTC with the seed areas hMT+ and hV4, after excluding all ULA voxels from the target OTC region (in addition to those that overlap with hMT+). If cortical proximity between ULA and hMT+ is responsible for the tight relationship between the voxels' selectivity to images of upper limbs and their connectivity with hMT+, one may expect that excluding ULA voxels (which are adjacent to hMT+) may abolish this relationship. However, the overall picture remained the same: voxels within the rest of the OTC that had greater selectivity to upper limbs also demonstrated stronger connectivity to hMT+ than to hV4 (ipsilateral seeds: p < 0.01, p = 0.14, p = 0.39, and p < 0.01 for upper limbs, lower limbs, torsos, and objects, respectively; contralateral seeds: p < 0.01, p = 0.23, p = 0.54, and p < 0.001, respectively).
We also repeated the original FC analysis comparing hV4 and V3A, another cortical area sensitive to visual motion. Although both hMT+ and V3A participate in the processing of motion patterns (Huk and Heeger, 2002), hMT+, unlike V3A, has been shown to be involved in the learning and recognition of complex, articulated motion patterns (Jastorff et al., 2009; for review, see Pitzalis et al., 2012). Thus, V3A is probably less relevant for the processing of articulated upper-limb movements, and mediating upper-limb form–motion interactions. Indeed, the FC preference of OTC target voxels toward V3A (compared with hV4) was only marginally associated with their selectivity to upper limbs (p = 0.054 and p = 0.08 for ipsilateral and contralateral seeds, respectively). Yet the voxels' FC preference toward hV4 was significantly coupled with their selectivity to more rigid torsos, for both ipsilateral and contralateral seeds (p < 0.05 for both). This suggests that, unlike connectivity of voxels in the OTC to hMT+, connectivity of voxels in the OTC to V3A only weakly reflects their selectivity to articulated body parts.
To sum up, in OTC, the voxels' greater selectivity to articulated body parts (upper and lower limbs) was associated with their stronger connectivity with hMT+. In contrast, selectivity to more rigid or typically inert objects (torsos and man-made objects) was associated with increased FC with hV4, LO-1, or LOC.
The results described above were based on the first eigenvector of each seed (capturing the largest amount of explained variance across the seed voxels). However, if across the seed voxels, the resting-state response is not entirely homogenous, the first eigenvector may underestimate a portion of the seed, mediating relevant information to the target. Indeed, the resting-state time courses of 11.0 ± 1.0% of the OTC voxels (mean across participants ± SD) negatively correlated with the principal eigenvectors of the seeds, suggesting that subpopulations in the seeds may not be represented in the previous connectivity analysis. To further corroborate our results, we calculated voxelwise connectivity in the OTC with every single voxel in ipsilateral and contralateral hMT+ and hV4 ROI seeds, choosing the maximal connectivity index for each target voxel (across seed voxels) to represent its functional connectivity with the seed. Note that now, due to the choice of maximal connectivity indices per seed, >99% of the OTC voxels have a positive connectivity index with both hMT+ and hV4 seed regions. However, the selectivity of those voxels to upper-limb images was still positively associated with their connectivity preference toward hMT+ (but not hV4, p < 0.01, for both ipsilateral and contralateral seeds). This result, as well as the relationship between FC and selectivity to other image categories, corroborates the results of the previous analysis.
Cortical sensitivity to the velocity profile of seen extension/flexion arm movements
Based on the tight coupling between connectivity to hMT+ and selectivity to static images of upper limbs across the OTC, we predicted that OTC voxels selective to static upper limbs might be involved in the processing of upper-limb dynamics. To test this prediction, we examined which cortical regions of the human brain carry information about the velocity profile of visually presented natural arm movements, and the extent to which ULA is sensitive to this motion kinematic parameter.
For this purpose, participants viewed videos of arm movements (extension and flexion) while performing a fixation task. The speed of both the extension and flexion components was manipulated parametrically across four videos, such that the extension/flexion speed ratios ranged between 0.25 and 4 (Fig. 3; Movie 1; the leftmost frames in Fig. 3 are from the first clip in the movie, etc.). The videos were designed to vary arm kinematics across the video set while minimizing differences in arm shape. Accordingly, the individual frames in video pairs with extension/flexion speed ratios 0.25 versus 4 and 0.67 versus 1.5 were identical (but played in reverse). However, while very similar, the frames across the other video pairs were not identical. To account for potential dissimilarity in arm shape, shape similarity between single frames (both within and between videos) was assessed for all possible frame pairs (using a shape description algorithm; Belongie et al., 2002). There was no statistically significant difference between estimates for “within” and “between” frame pairs (t test, t(778) = 0.8, p = 0.42): the videos showed similar levels of arm contour similarity with other videos as within themselves. This ensured that shape information was constant across the videos. Furthermore, since arm movements spanned the same regions in the visual field (i.e., local motion signals were pooled across the same space), they mostly differed in their velocity profile. We used both left and right arm movements: the four original (left arm) videos were further flipped horizontally to obtain four additional (right arm) videos with the same kinematic parameters.

Velocity profile of an arm movement. Four movement videos (frames partially superimposed; Movie 1) were constructed from the same motion element [extension of the arm (Ext)]. First, the speed of the original Ext clip was changed parametrically resulting in four new video clips of 4–16 frames. Second, the order of the frames in the clips was reversed, thus creating four corresponding flexion (Flex) movements. Finally, the obtained Ext and Flex were paired together to produce four videos of equal length (20 frames, 800 ms) with different Ext/Flex speed ratios. The mean speed of the moving arm contour was calculated for Flex and Ext episodes separately (using edge points of the contour when the arm was maximally flexed or extended; left, blue dots). The mean speed of the contour ranged from 6 to 24°/s for Flex (from left to right) and Ext (from right to left), respectively. Yellow arrows, Ext and Flex velocity in each movie clip; black vertical arrow, time in seconds; black horizontal line, space in degrees; dashed red lines, the position of fixation point during clip presentation; dashed green line, color of the fixation point, which was changed periodically.
Since neurons in motion-sensitive cortical areas (such as MT) show distinct speed and direction tuning functions (Albright et al., 1984; Liu and Newsome, 2003), we hypothesized that four different videos for each arm (comprising motion within the same visual space but at different speeds in each direction) would activate different populations of these neurons. Different multivoxel activity patterns in these areas would therefore represent the (dis)similarity in arm-motion kinematics, rather than arm contours. Moreover, since elementary motion detectors in early visual cortical areas have access to a very limited portion of the visual space, and therefore do not recover the true 2D motion velocity (Movshon et al., 1985), we predicted that low-level visual ROIs should show limited speed-ratio discrimination. Only higher-order motion processing areas that integrate local motion information, such as hMT+, should show sensitivity to veridical arm velocity (Huk and Heeger, 2002; Serences and Boynton, 2007). In addition, we expected that both low-level and high-level visual areas would differentiate between left and right arm videos either due to their retinotopic organization (as these videos activated different regions within the visual field; Wandell et al., 2007; Sayres and Grill-Spector, 2008; Kravitz et al., 2010), or due to (retinotopically independent) encoding of arm identity in these areas (DiCarlo and Cox, 2007).
Whole-brain MVPA
To explore the potential scope of cortical areas that may be sensitive to seen arm- movement kinematics, we applied a volume-based searchlight MVPA (Kriegeskorte et al., 2006). Sensitivity to both low-level arm-motion aspects and global motion kinematics should be reflected in a stronger correlation between two multivoxel activity patterns (across two halves of the dataset; see Materials and Methods) evoked by the same motion video (Same correlation), compared with the correlation calculated for two different motion videos (Different correlation). For each participant, we used search windows of different sizes to search throughout the brain for voxel clusters whose activation patterns allow discrimination between same and different arm movement videos. Figure 4 depicts the groupwise statistical maps with voxels showing significant difference between Same and Different correlations (indicated by the blue patches in the maps). Thus, the searchlight voxel cluster, centered on each of those highlighted voxels, could significantly discriminate between same and different arm movement, at the group level. A large groupwise cluster with maximal sensitivity to difference in motion kinematics was observed in the right lateral OTC (x-y-z Talairach center-of-mass coordinates: 45, −64, 1), regardless of the search window size (Fig. 4B,D). Importantly, this cluster substantially overlapped with the groupwise localizer of ULA in the right hemisphere (indicated by the red contours, respectively). In addition, small clusters were found in the left lateral OTC (−48, −72, 3), right STS (46, −40, 9), right anterior parietal cortex (26, −47, 56), and left central sulcus (−28, −33, 56), as well as in the parieto-occipital junction bilaterally (−21, −86, 26, and 22, −87, 36, respectively). This whole-brain analysis at the group level suggests that ULA, as well as low-level visual areas (e.g., V1–V3), may encode information about kinematics of the arm movements, independent of arm shape.

Sensitivity to kinematic differences between arm movements in the whole brain. A–C, Group searchlight statistical t map is shown on the cortical surface of a representative participant from the left (A) and right (B) posterior lateral and top (C) views (the analysis was performed in volume space, and its results were projected on the mesh surface for presentation purposes only). A search window was defined as a sphere of radius 9 mm that included 123 isotropic voxels of 3 × 3 × 3 mm. The map indicates where in the brain (in a specific standard voxel and its neighborhood) the group-mean difference between Same and Different correlations is significant across participants. Red and black contours, Borders of the group ULA and EBA regions, respectively (p < 0.001, cluster size corrected). EBA was defined by contrasting the body categories (upper limbs, lower limbs, and torsos) versus the object category. D, An analogous t map is obtained with a smaller search window (radius 6 mm, 33 isotropic voxels). The map shows similar overlap between voxels showing significant differences between Same and Different correlations and the group ULA region, regardless of the search window size.
However, ULA and hMT+ shared 13–37% of their voxels (mean, 25%) in Talairach space, as estimated at the single participant level (see Materials and Methods). The sensitivity of ULA to arm kinematics may therefore be merely due to this partial overlap. To address this issue, we created individual searchlight maps. Figure 5 presents examples of these maps with voxels showing a significant difference between Same and Different correlations (indicated by the blue patches in the maps). A permutation test was performed to infer statistical significance of the difference at the single participant level (see Materials and Methods). The maps in Figure 5 are superimposed on the corresponding individual's localizers for hMT+ and ULA (the white and red patches, respectively). Importantly, significant voxel clusters in the lateral OTC of the participants overlap with both hMT+ and ULA voxels, which are not part of hMT+, in both hemispheres. This whole-brain analysis at the individual level suggests that ULA voxels are sensitive to arm-motion kinematics, even if they are beyond hMT+.
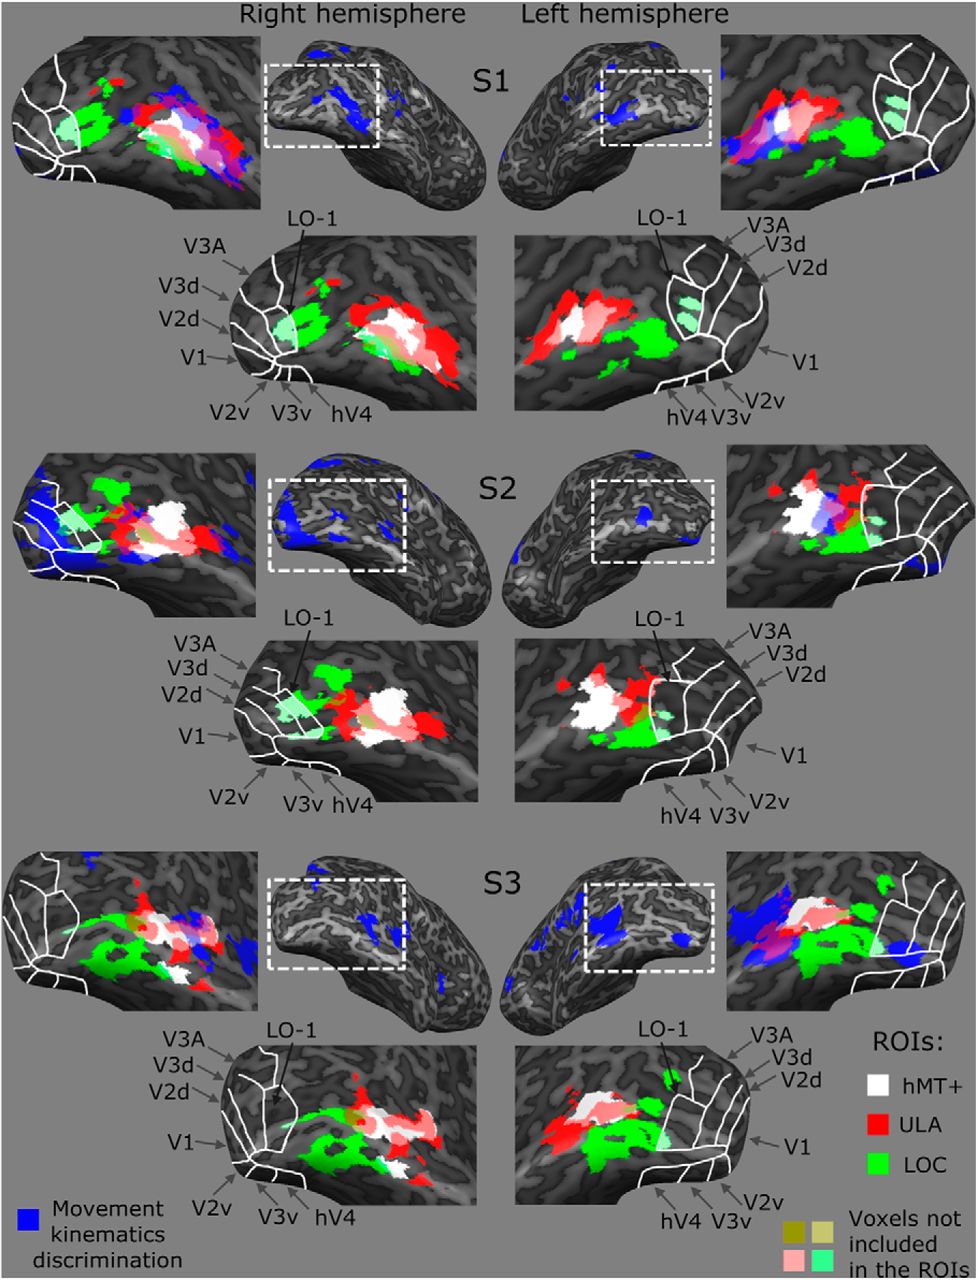
Examples of searchlight statistical maps and their overlap with classical visual areas in individual participants. Searchlight statistical maps of three participants (using a search window of 9 mm radius) are shown on an inflated cortical surface of the right and left hemispheres, from a posterior lateral view. The analysis was performed in volume space, and its results were projected on the mesh surface for presentation purposes only. The blue clusters indicate voxels (i.e., search window centers) in which significant differences between Same and Different correlations were found (using a permutation test, p < 0.01, cluster-size corrected). The enlarged maps around each hemisphere show locations of the different ROIs used in Figures 2 and 6. White lines indicate the boundaries of retinotopically defined V1–V3, V3A, hV4, and LO-1. Functionally defined hMT+, ULA, and LOC are indicated by white, red, and green patches, respectively. Note that these ROIs were restricted to exclude all overlapping voxels that are shared by the hMT+, ULA, LOC, and LO-1 localizers (some voxels shared by V3 and LOC in a few participants were also excluded). The leftmost and rightmost maps demonstrate the degree of overlap between the searchlight results showing sensitivity to arm-motion kinematics (blue) and the defined ROIs in each individual.
ROI-based MVPA
To study in more detail the relationship of various functionally defined visual areas, including ULA, to arm-velocity representation, we used a ROI-based MVPA. For this purpose, 10 bilateral ROIs (V1, V2, V3, V3A, hV4, LO-1, LOC, hMT+, ULA, and FFA) were identified for each of 11 participants, based on independent localizers. In addition, face-selective STS/MTG ROIs were identified in seven participants (in two of them, in the right hemisphere only). To exclude the potential influence of hMT+ on arm kinematics representation in adjacent ULA and LOC (due to their partial overlap; see Materials and Methods and Fig. 5), the hMT+, ULA, and LOC ROIs were restricted to nonoverlapping voxels across the localizers (Fig. 5, white, red, and green patches, respectively). Overlapping voxels between LOC and LO-1 were also excluded.
Correlations between multivoxel activation patterns evoked by the viewed movements were calculated separately for each arm and in the left and right hemispheres. We first tested whether the MVPA in the various ROIs makes it possible to distinguish between the two viewed arms, regardless of their motion profile. To that end, in each participant we separately averaged all correlations that corresponded to the same arm identity, and the ones with different arm identity. The difference between the group-averaged correlations for same and different arm views was significant in all ROIs except STS/MTG and FFA (paired t test, t(10) ranged from 4.6 to 8.1, p < 0.001 for V1–V3, V3A, LO-1, and hMT+, p < 0.01 for LOC and ULA, and p < 0.05 for hV4). This indicates that information about arm identity is present in the multivoxel patterns throughout the ventral visual stream.
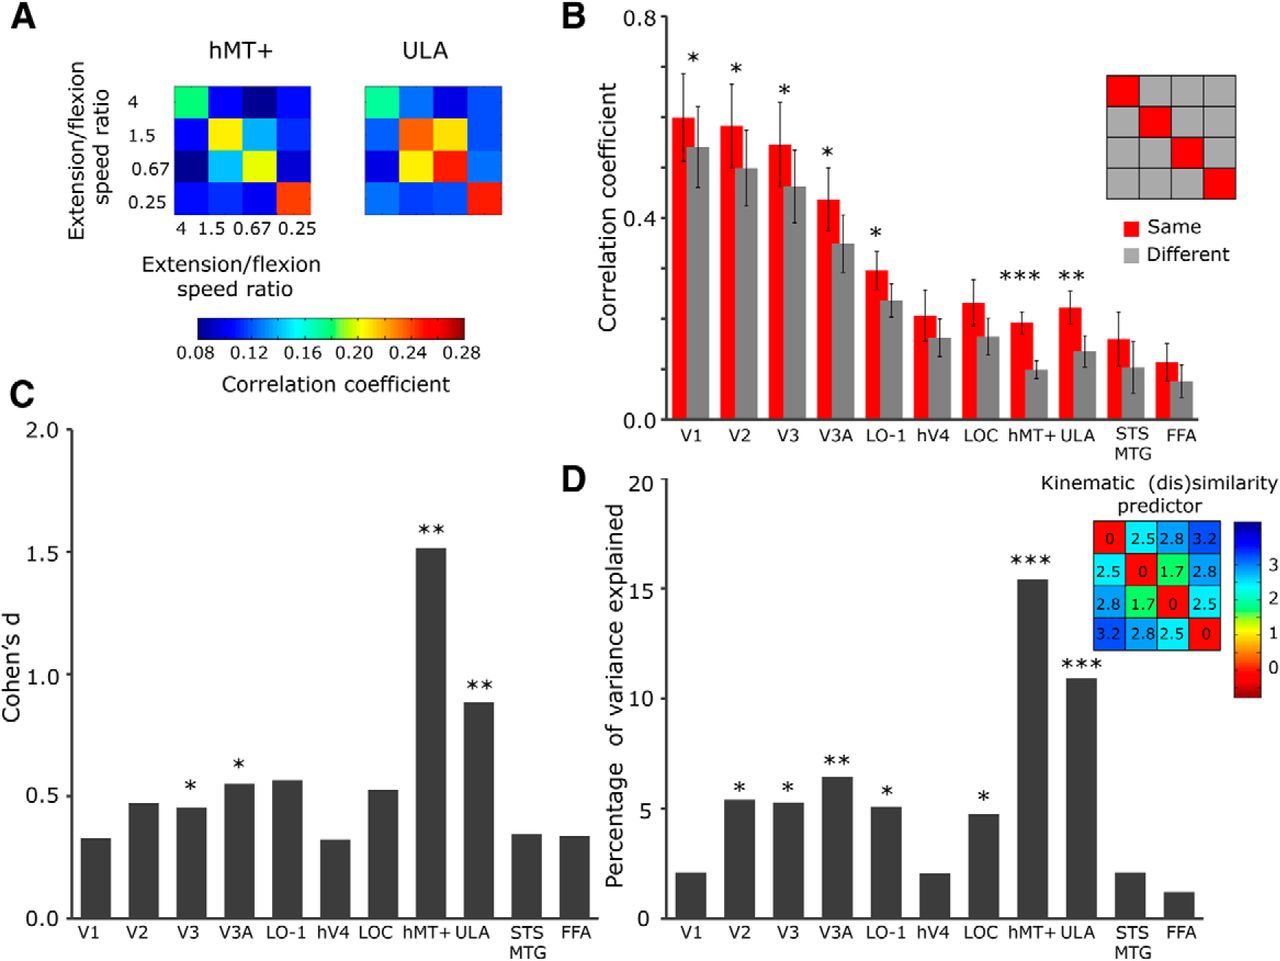
To quantify the ROIs' sensitivity to kinematics of arm movements, we averaged the correlations within each participant across the two arm views. Figure 6A shows the group-average correlations in hMT+ and ULA. X and Y axes indicate four different conditions (i.e., four extension/flexion speed ratios) in two halves of the dataset. To estimate the overall discrimination ability for each ROI, the correlation coefficients were averaged across same videos (i.e., the main diagonal of the matrices) and different videos (other correlations in the matrices; Fig. 6B). In general, the correlations were higher in V1–V3 and V3A than hMT+, probably due to a better reproducibility of multivoxel activation patterns in these fine-scale retinotopic regions. Nevertheless, the difference between correlations for same (red) and different (gray) videos was only moderately significant in these early visual areas (paired t test, t(10) ranged from 3.7 to 4.3, p < 0.05 for all), whereas hMT+ showed strong discrimination between the videos (t(10) = 8.5, p < 0.001). This pattern of correlations was replicated when studying the right and left hemispheres separately (right hMT+: t(10) = 5.9, p < 0.01; left hMT+: t(10) = 4.3, p < 0.05; right V1–V3 and V3A: t(10) = 2.4, 3.0, 3.6, and 3.4; p = 0.33, p = 0.16, p = 0.06, and p = 0.08, respectively; left V1–V3 and V3A: t(10) = 3.7, 3.6, 4.1, and 3.7; p < 0.05 for all). The difference between the left and right hMT+ in their ability to discriminate between the videos was not significant (t(10) = 0.7, p = 0.49). Importantly, we identified similar discrimination between same and different arm-motion videos in the ULA ROI (t(10) = 5.6, p < 0.01), while this discrimination in LO-1 was less prominent (t(10) = 4.5, p < 0.05). Other higher-order ROIs within the ventral visual pathway (i.e., LOC, hV4, face-selective STS/MTG, and FFA) did not show significant effects (p > 0.15 for all). Figure 6C shows effect sizes (Cohen's d) of motion discrimination within each of the 11 ROIs. A permutation test confirmed that discrimination of arm-motion videos within hMT+ and ULA (d(10) = 1.52 and 0.88, respectively) is significantly higher than expected in these ROIs by chance (p < 0.01 for both). These results suggest that ULA may code information relating to upper-limb dynamics, above and beyond its selectivity to shape.

The degree of (dis)similarity across multivoxel activation patterns in hMT+ and ULA is predicted by the degree of movement kinematics (dis)similarity. A, Group averaged correlations matrices in hMT+ (left) and ULA (right). X and Y axes indicate four movement conditions in the two dataset halves. Color bar, Level of correlation between multivoxel activity patterns evoked by the videos corresponding to the conditions in the two dataset halves. B, Red and gray bars indicate averaged correlations for the same videos (i.e., the main diagonal of the matrices in A and different videos (other correlations in the matrices), respectively. The error bars indicate SEM. C, Effect size (Cohen's d) of the difference between correlations for same and different videos across 11 ROIs. Note that the hMT+, ULA, LOC, and LO-1 ROIs were restricted to voxels that are not shared between the ROIs. The significance level for d was obtained using permutation analysis. D, The amount of variance explained by the kinematic (dis)similarity predictor (as calculated across video pairs; inset on the right) in the correlation matrices, for each ROI. Asterisks denote levels of significance as follows: *p < 0.05; **p < 0.01; ***p < 0.001.
To explore the relationship between same/different movement discrimination ability and movement kinematics processing, we created a parametric predictor, based on the kinematic (dis)similarity between arm movements in the different videos. For each pair of videos, we assessed the difference between the arm contour speeds for extension and flexion components separately, and then calculated the Euclidean distance between the speed vectors across video pairs (Fig. 6D, inset; Materials and Methods). We predicted that regions specifically coding velocity profile of an arm movement would show significant model fits to the degree of (dis)similarity across the multivoxel patterns. As Figure 6D demonstrates, the (dis)similarity predictor accounts for a significant amount of variance in the MVPA correlation matrices in both hMT+ and ULA (r2 = 0.15 and 0.11; F(1,174) = 31.7 and 20.6, respectively, p < 0.001 for both). Using the same procedure, the explained variance in V2, V3, V3A, LO-1, and LOC was ∼2 times smaller than in ULA and ∼3 times smaller than in hMT+ (r2 ranged from 0.047 to 0.064, F(1,174) = 9.9, 9.7, 11.9, 9.3, and 8.7, respectively, p < 0.01 for V3A, and p < 0.05 for all other ROIs), whereas V1, hV4, STS/MTG, and FFA did not show significant effects (p > 0.4 for all). This pattern of results is akin to that shown in Figure 6C, suggesting that the discriminative pattern of MVPA may be attributed to velocity-profile sensitivity in hMT+ and ULA.
Discussion
Body-selective areas within the OTC (e.g., EBA) are traditionally thought to be a part of the shape-selective ventral visual stream (for review, see Op de Beeck et al., 2008; Downing and Peelen, 2011; Taylor and Downing, 2011). Contrary to this view, we show that within OTC voxels, the selectivity to static images of arms and hands is positively correlated with their strength of functional connectivity with hMT+ but not with midlevel shape-selective regions (hV4 or LO-1; Figs. 1, 2). In contrast, no such positive relationship is found between the connectivity to hMT+ and the voxels' selectivity to torsos or inert man-made objects. Thus, increased selectivity of OTC voxels to images of articulated, highly dynamic upper limbs (but not more rigid or completely inert objects) coincides with their increased connectivity with hMT+. This suggests that upper-limb-selective visual processing in OTC might be tightly coupled with upper-limb articulation. Indeed, we demonstrate that upper-limb-selective voxels show discriminative patterns for viewed arm movements with different kinematics, although these movements contain similar shape elements and span the same regions in the visual field (Figs. 4⇑–6A–C). Moreover, we show that upper-limb-selective areas carry information about the dynamic profile of a seen natural arm movement, much like the classical motion area hMT+ (Fig. 6D). We therefore suggest that the functional specificity for upper-limb representation in the OTC may be determined by articulated visual motion, beyond mere selectivity to shape.
This study was motivated by the fact that EBA, an area showing preference to static images of body parts (and limbs in particular) above other objects, is in close proximity to hMT+ (Downing et al., 2001, 2007; Weiner and Grill-Spector, 2011; Ferri et al., 2012). Such proximity suggests a possible link between the perception of body form and the processing of its kinematics (Beauchamp et al., 2002; Kable and Chatterjee, 2006; Jastorff and Orban, 2009; Thompson and Baccus, 2012). For example, specific regions within the lateral OTC, including EBA, have been shown to selectively respond to body/hand motion versus object motion (Beauchamp et al., 2002; Heitger et al., 2012), to intact versus scrambled point-light biological motion (Peelen et al., 2006; Jastorff et al., 2009; for review, see Downing and Peelen, 2011), and to realistic versus artificial patterns of point-light biological motion (Jastorff and Orban, 2009). However, in these studies, differences between the global motion patterns of the compared stimuli were associated with differences in their shape. Using MVPA we provide direct evidence that motion information in ULA (rather than in adjacent LOC or face-selective STS/MTG) is related to velocity profiles of arm movements, while shape cues were maintained constant. Conversely, arm identity (i.e., left-arm vs right-arm movements regardless of their kinematics) could be discriminated in ULA, as well as in other ventral stream visual areas (hV4, LO-1, and LOC). This may stem from retinotopically independent encoding of viewed arm identity (DiCarlo and Cox, 2007), but is most likely due to differences in the retinal representation of the two moving-arm contours (Sayres and Grill-Spector, 2008; Kravitz et al., 2010). Together with the FC results, our findings indicate that OTC regions showing categorical preference to static images of upper limbs carry information about arm motion above and beyond information about arm shape.
Although in humans the computation of global direction and speed of motion can occur in both hMT+ and V3A (Huk and Heeger, 2002), we found much weaker sensitivity to the kinematics of an arm movement in V3A (Fig. 6D). Furthermore, upper-limb selectivity in OTC voxels strongly coincided with their connectivity preference toward hMT+ (relative to a range of shape-selective areas), but not toward V3A. Based on a growing body of evidence about functional differences between these two motion-sensitive areas (Serences and Boynton, 2007; Jastorff et al., 2009; Aflalo and Graziano, 2011; Fischer et al., 2012; Seymour and Clifford, 2012; Pitzalis et al., 2012), we propose that the difference in their sensitivity to arm-motion kinematics may be related to the different challenges associated with the processing of rigid versus articulated objects: since all the surface points of a rigid object have a similar speed vector, integration of local motion signals is relatively straightforward. In contrast, arm motion with its multiple joints makes the pooling of local velocities much more complicated (Neri et al., 1998). Thus, while V3A may be sufficient for vector pooling of rigid motion, the involvement of hMT+ may be critical to cope with the pooling of nonrigid motion.
It has previously been suggested that functional specificity of upper-limb-selective regions in the vicinity of hMT+ can be partly attributed to their recruitment in the processing of body-part dynamics (Orlov et al., 2010): Upper limbs, which are the most articulated parts of the human body, have been estimated to contain 40° of freedom (MacKenzie and Iberall, 1994), and the processing of their motion is unique in its importance for the interpretation of observed actions. If so, the selectivity to static upper limbs in ULA may be related to the fact that shape cues that characterize upper limbs are naturally associated through lifetime experience with arm-specific motion patterns. Indeed, OTC responses to different image categories have been thought to reflect both acquired past experience and current input (Barlow, 2001; Hasson et al., 2002; Chan et al., 2010; Zhang and Kourtzi, 2010). For example, shape selectivity can emerge in single neurons within classical MT following associative learning between the direction of motion and a static shape (Schlack and Albright, 2007), while implied motion (i.e., motion inferred from still images) has been thought to activate the same direction-selective and speed-tuned mechanisms as real motion (Shiffrar and Freyd, 1993; Kourtzi and Kanwisher, 2000; Winawer et al., 2008). According to this framework, the spatial vicinity of ULA to hMT+ is not coincidental: it could function as a local neural network that incorporates both static and dynamic aspects of upper limbs, thus minimizing wiring cost and maximizing the behavioral value of the network function (Bullmore and Sporns, 2012). Such a specialized mechanism for facilitating motion perception by form signals and vice versa, may be critical for successful action execution in a complex, dynamic environment (Giese and Poggio, 2003; Kourtzi et al., 2008). For example, integrating both static views of human body and corresponding motion signals has been thought to allow an earlier anticipation of emerging actions (Gervais et al., 2010). The tight link that we report between representation of static upper limbs and motion processing may shed light on the existence of such a mechanism in the OTC.
To what extent is this putative integrative network, which accumulates dorsal and ventral upper-limb information, specific for upper limbs? Our study was not designed to provide a conclusive answer to this question: while demonstrating sensitivity of ULA to upper-limb kinematics, our study does not include control conditions to show that the sensitivity was specific to arm movements. For example, based on our previous findings, demonstrating high responsiveness to lower-limb images in ULA (Orlov et al., 2010), it seems reasonable to assume that ULA may be also sensitive to kinematics of lower limbs to some degree. Indeed, in the present study we find that OTC voxel's connectivity with hMT+ is positively correlated with their selectivity to the images of lower limbs but not torsos or rigid objects (see Fig. 2). Thus, our results may suggest that this integrative network represents a generalized visual mechanism supporting form–motion interactions for articulated body parts, beyond upper limbs. Notably, in the lateral OTC, some regions show selectivity to moving human bodies while others prefer rigid, unarticulated objects (Beauchamp et al., 2002). Thus, the sensitivity of ULA to the velocity profile of arm movements is unlikely to generalize to other object categories, (e.g., rigid objects) even when presented in motion with similar velocity profiles, as in the arm videos used in our study. Nevertheless, the hand-selective region in the left lateral OTC defined by a previous study (which is in partial overlap to ULA) does show similarity between the multivoxel response patterns to hands and to tools, and in particular, for tools that serve as an extension of the hand (Bracci and Peelen, 2013). We therefore speculate that ULA might respond to tool motion when the tool extends the hands' reach.
In conclusion, we demonstrate that the strong category specificity that exists in the OTC for highly articulated upper limbs versus less flexible or completely rigid objects can be explained, to some degree, by the patterns of functional connectivity of OTC voxels with hMT+ and hV4/LO-1. The OTC representations of rigid, typically inert objects are likely to obey the classical hierarchy in the ventral visual stream, where V4 (or LO-1) is the main source of information for the higher level visual areas (Van Essen et al., 1992). Conversely, the functional specificity of ULA may be determined by its strong functional connections with hMT+ and its involvement in the processing of arm-motion kinematics.
Footnotes
This work was supported by the Israel Science Foundation Grant #39/09 (to E.Z.) and by the Israel Ministry of Aliyah and Immigrant Absorption (to T.O.). T.R.M. was funded by the European Commission (Marie Curie Intra-European Fellowship).
The authors declare no competing financial interests.
- Correspondence should be addressed to Tanya Orlov at the above address. tanya.orlov{at}mail.huji.ac.il


