

Article Figures & Data
Figures
- Figure 1.
LifeAct colocalizes with PSD-95-YFP in dendritic spines and displays a limited colocalization with EGFP-Tau. A, Confocal imaging of dendritic spines of primary murine cortical neuronal cultures (14 DIV) cotransfected with LifeAct-RFP and PSD-95-YFP 48 h before imaging. Merge images show the colocalization (yellow, white arrows) of PSD-95 and filamentous actin in dendritic spines. B, Dendritic spines of cortical neuron culture cotransfected with LifeAct-RFP and EGFP-Tau. Merged images show only limited colocalization of EGFP-Tau in the indicated dendritic spines (white arrows). Scale bars: top, 10 μm; bottom, 5 μm.
- Figure 2.
Synaptic activation induced by Bic/4-AP triggers translocation of tau into dendritic spines of primary cortical neuron cultures. A, Confocal imaging of cortical neurons (14 DIV) cotransfected with EGFP-Tau and LifeAct-RFP. Left, Spatial repartition of EGF-Tau (green) and LifeAct-RFP (red) in nonactivated neuron. The merged image displays only minor colocalization (yellow). Scale bar, 5 μm. Right, Higher magnification of EGFP-Tau, LifeAct in dendritic spines (designated box in the left) of a neuron after synaptic activation triggered by 15 and 30 min of Bic/4AP exposure. The merged image shows the activity driven colocalization of tau/LifeAct (yellow) in the activated dendritic spine after 15 and 30 min Bic/4-AP exposure. Scale bar, 1 μm. B, Quantification of fluorescence intensity mediated by EGFP-Tau in the head of spines during synaptic activation (Bic/4-AP treatment). The graph represents the evolution of ΔF/F0 generated by EGFP-Tau in neurons subjected to synaptic activation or not. Statistical analysis was performed by two-way ANOVA followed by Bonferroni's posttest (mean ± SEM, ***p < 0.0001, control n = 40 spines on 3 independent cultures; Bic/4-AP n = 162 spines on 5 independent cultures). C, Representative Western blot of endogenous tau expression in a whole lysate extract of cortical neurons (14 DIV) exposed to Bic/4-AP for 15 and 30 min. Quantification of tau expression normalized to actin levels does not display any change. D, Representative Western blots of protein expression from primary cortical cultures after fractionation. Presynaptic protein (synaptophysin), postsynaptic proteins (PSD-95, GluA1, GluN2A, GluN2B, Fyn), cytoskeletal protein (actin), and tau in non-PSD fraction (Triton-soluble fraction) and PSD-fraction (Triton-insoluble fraction) on primary cortical neurons treated 15 min with Bic/4-AP. E, Quantitative analysis of PSD-95, GluA1, GluN2B, GluA1, Fyn, actin, and tau in the PSD fraction under control and Bic/4-AP (15 min) treated conditions is shown in graphs (mean ± SEM, 2-tailed Student's t test,***p < 0.001, **p = 0.0026, *p = 0.0101, N ≥ 7 independent cultures).
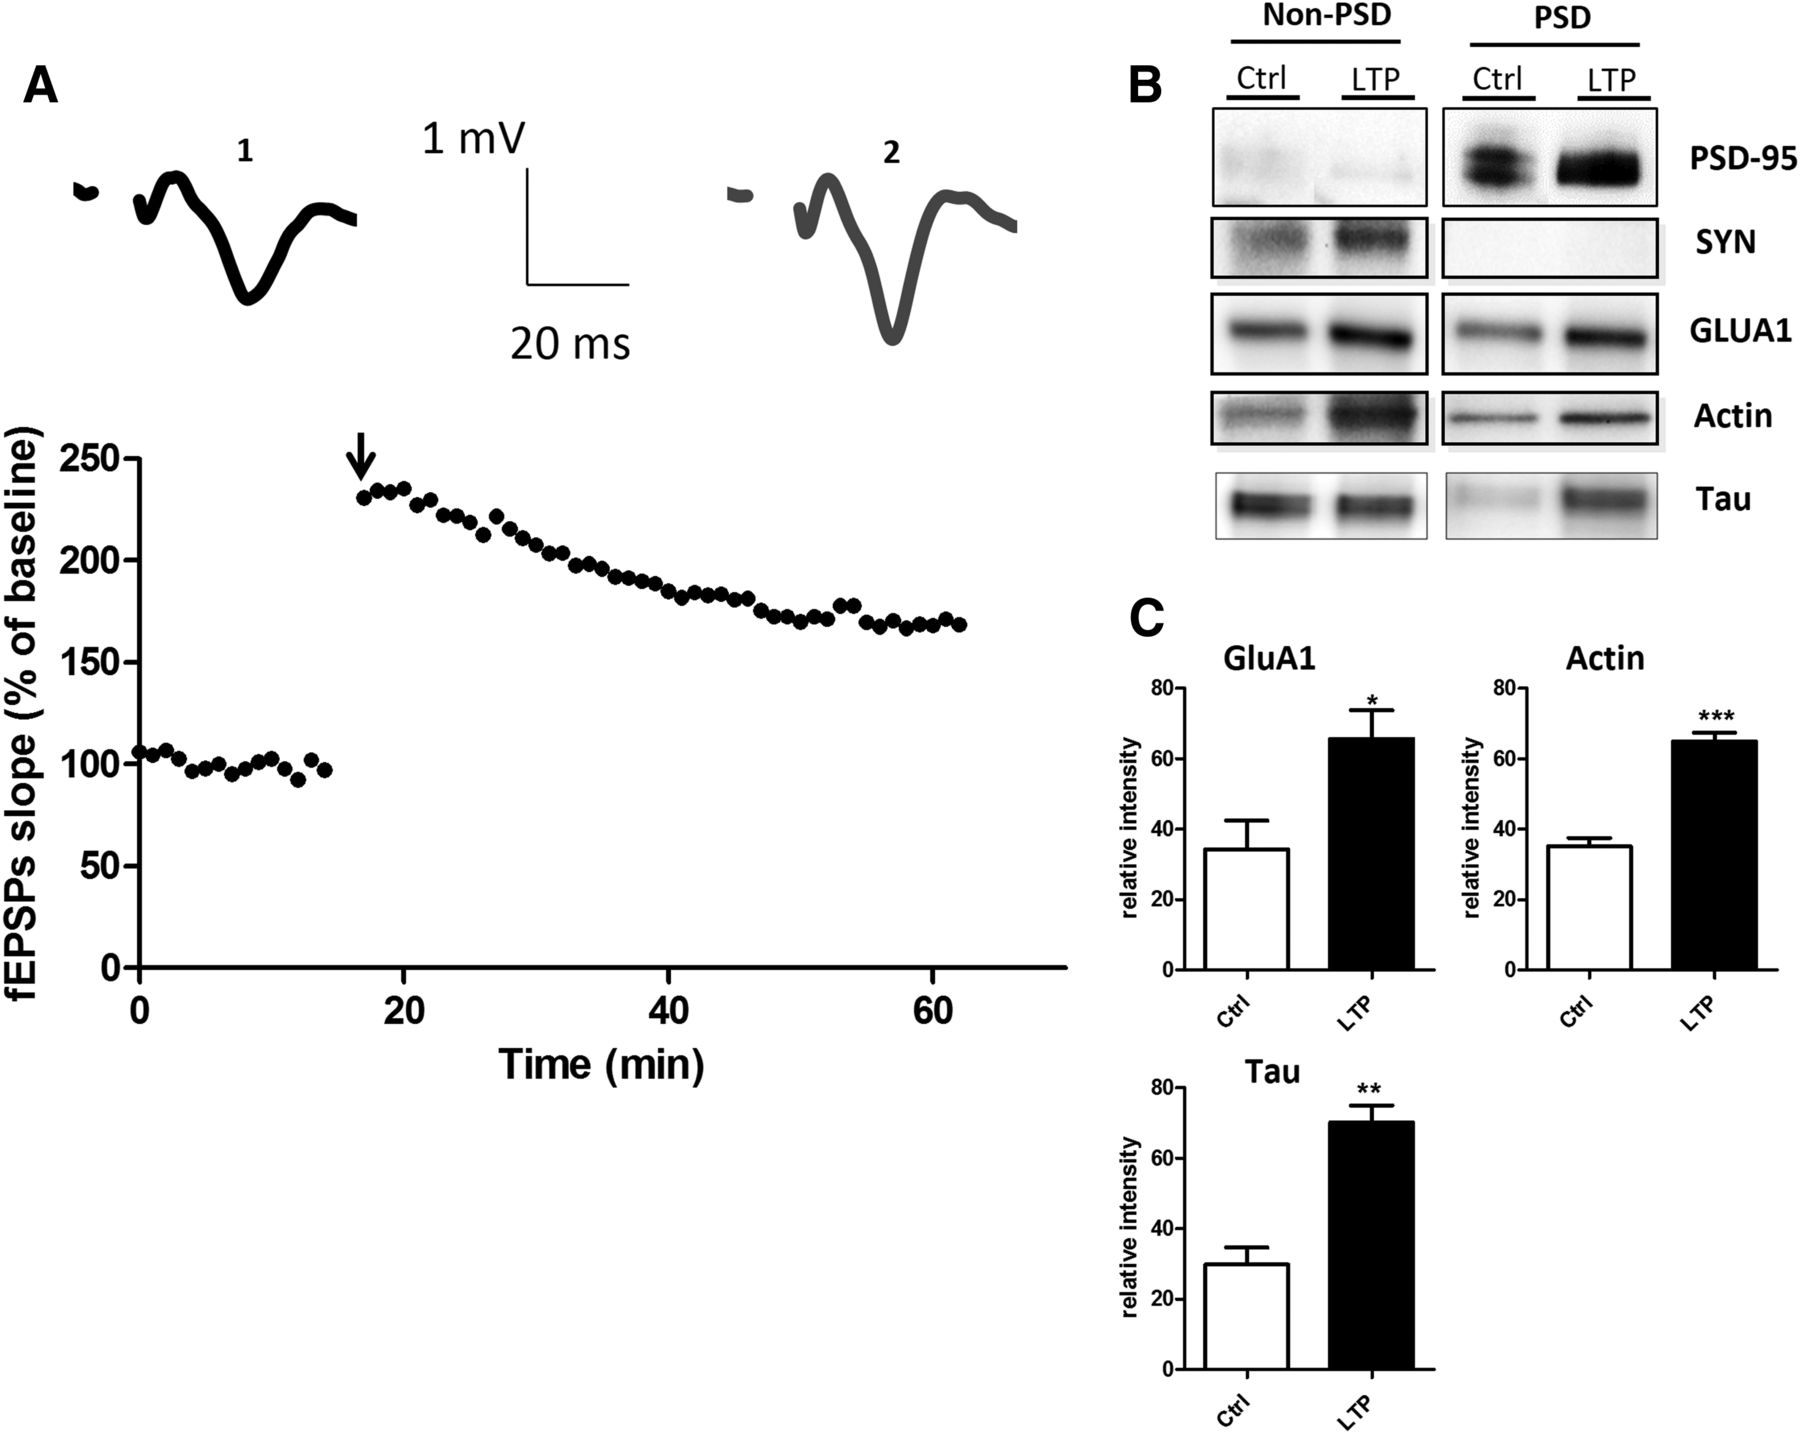
- Figure 3.
LTP in hippocampal slices triggers translocalization of tau to CA1 dendritic spines. A, Representative curve of fEPSP slope in percentage of baseline illustrating the LTP induction in CA1 region of hippocampus slices. Sample EPSPs are shown before (1) and after (2) LTP induction. B, Representative Western blots of synaptic protein expression from the CA1 region of hippocampal slices subjected to LTP protocol. C, Quantifications of Western blot from GluA1, actin, and tau in control and LTP conditions (mean ± SEM, 2-tailed Student's t test, *p = 0.0346, **p = 0.0011,***p = 0.0002, N = 4 independent slices).
- Figure 4.
Tau interacts with actin in purified system. Cosedimentation of actin filaments with tau. Actin was polymerized at 5 μm for 1 h at room temperature in the absence or in the presence of 1 μm tau. The reaction mixtures were then centrifuged at 100,000 × g to sediment actin filaments (A) or at 15,000 × g to precipitate only actin bundles (B). Supernatants (SN) and pellets (P) were applied to 10% SDS-PAGE gel and proteins were stained with Coomassie blue. C, Confocal imaging of cortical neurons (14 DIV) cotransfected with EGFP-Tau1N4R and LifeAct-RFP. Left, Spatial repartition of EGFP-Tau1N4R (green) and LifeAct-RFP (red) in untreated neurons. Scale bar, 5 μm. Right, Higher magnification of EGFP-Tau1N4R and LifeAct-RFP in a dendritic spine neuron after Bic/4-AP treatment (15 and 30 min, designated box in the left) by 15 and 30 min of Bic/4-AP treatment. The merged image shows colocalization of F-actin and tau. Scale bar, 1 μm. D, Quantification of fluorescence intensity mediated by EGFP-Tau1N4R and Tau2N4R in the head of spines during synaptic activation (Bic/4-AP treatment). The graph represents the evolution of ΔF/F0 generated by EGFP-Tau2N4R and EGFP-Tau1N4R in neurons subjected to synaptic activation or not. Statistical analysis was performed by two-way ANOVA followed by Bonferroni's posttest (mean ± SEM, ***p < 0.0001 vs control, ###p < 0.0001 vs Tau-2N4R; control n = 40 spines on 3 independent cultures; Bic/4-AP Tau2N4R n = 162 spines on 5 independent cultures, Bic/4AP Tau 1N4R n = 54 spines on 2 independent cultures).
- Figure 5.
Tau interacts with F-actin in the synaptic compartment. A, Representative Western blot showing F-actin-associated tau in cultured cortical neurons treated for 15 min with Bic/4-AP. Cell lysate was collected after treatment and F-actin precipitated with phalloidin as described in the Materials and Methods. B, Quantifications of actin and tau in control and Bic/4-AP condition (mean ± SEM, 2-tailed Student's t test, ***p < 0.001, N = 7 independent cultures). C, Confocal imaging of cortical neurons (14 DIV) cotransfected with EGFP-Tau and LifeAct-RFP treated with jasplakinolide (1 μm), a specific agent that stabilizes F-actin. Left, Cropped view of dendritic branch of transfected neuron under control condition. Scale bar, 5 μm. Right, Higher magnification of EGFP-Tau and LifeAct-RFP in dendritic spines (cropped view of dotted box in the left) of neuron before and 15 and 30 min after jasplakinolide (1 μm) treatment. The merged image shows colocalization of EGFP-Tau and LifeAct-RFP (white arrows). Scale bar, 1 μm. D, Quantification of the fluorescence intensity variation (ΔF/F0) of EGFP-Tau in the head of spines during actin network stabilization (jasplakinolide treatment). Statistical analysis was performed by two-way ANOVA followed by Bonferroni's posttest (mean ± SEM, ***p < 0.0001, control n = 40, N = 3 independent cultures, jasplakinolide n = 106, N = 4 independent cultures). E, Representative Western blots of protein expression from PSD-enriched fraction primary cortical cultures treated or not with jasplakinolide (1 μm, synaptophysin [SYN], PSD-95, GluA1, Fyn actin, and tau in PSD-fraction (Triton-insoluble fraction)). F, Quantitative analysis of Western blots of PSD-95, GluA1, actin, and tau in PSD fraction (mean ± SEM, 2-tailed Student's t test, **p < 0.01, *p < 0.05, N = 4 independent cultures).
- Figure 6.
Aβo treatment in primary cortical neuron cultures induces synaptic mislocalization of EGFP-Tau. A, Confocal imaging of cortical neurons (14 DIV) cotransfected with EGFP-Tau (full-length human tau) and LifeAct-RFP. Left, Spatial repartition of EGFP-Tau (green) and LifeAct-RFP (red) in nontreated neuron. Scale bar, 5 μm. Right, Higher magnification of EGFP-Tau and LifeAct-RFP in dendritic spine neuron after Aβ treatment (15 and 30 min, designated box in the left) by 15 and 30 min of Aβo 100 nm treatment. The merged image shows colocalization of F-actin and tau (yellow, area indicated with white arrows). Scale bar, 1 μm. B, Quantification of the fluorescence intensity of EGFP-Tau in the head of spines during the Aβo treatment. The graph represents the evolution of ΔF/F0 generated by EGFP-Tau induced by Aβo 100 nm treatment. Statistical analysis was performed by two-way ANOVA followed by Bonferroni's posttest (mean ± SEM, ***p < 0.001, control n = 40, N = 3 independent cultures; Aβo 100 nm n = 79, N = 5 independent cultures). C, Representative Western blots of protein expression from fractionated primary cortical cultures treated or not with Aβo (100 nm) for 30 min. Presynaptic protein (synaptophysin), postsynaptic proteins (PSD-95, GluA1, GluN2A, GluN2B, Fyn), cytoskeletal protein (actin), and tau in PSD-fraction (Triton-insoluble fraction) were analyzed. D, Quantitative analysis of PSD-95, GluA1, GluN2B, GluA1, Fyn, actin, and tau in PSD fractions (mean ± SEM, 2-tailed Student's t test, ***p < 0.001, **p < 0.01, n ≥ 7 independent cultures). E, Percentage of positives and negatives spines in EGFP-Tau-transfected neurons before and during synaptic activation or Aβo treatment (Bic/4-AP N = 3, n = 130 spines; Aβo N = 3, n = 142; control N = 6, n = 272; ***p < 0.0001, **p > 0.01).
- Figure 7.
Aβo treatment on primary cortical neuron cultures induces synaptic mislocalization of endogenous tau that is disrupted by synaptic activation. A, Confocal imaging of cortical neurons (14 DIV) cotransfected with EGFP-Tau and LifeAct-RFP. Left, Spatial repartition of EGFP-Tau (in green) and LifeAct-RFP (in red) in untreated neurons. Scale bar, 5 μm. Right, Higher magnification of EGFP-Tau and LifeAct-RFP in a dendritic spine (designated box in the left) neuron showing the effect of 15 min of Aβ on tau localization (green) and actin cytoskeleton (red) followed by 15 min of Bic/4-AP. Scale bar, 1 μm. B, Representative Western blots of protein expression from fractionated primary cortical neurons treated with Aβo (100 nm) and then for 15 min with Bic/4-AP. Presynaptic protein (synaptophysin), postsynaptic proteins (PSD-95, GluA1,GluN2A, GluN2B,Fyn), cytoskeleton protein (actin), and tau in PSD-fraction (Triton-insoluble fraction) were analyzed. C, Quantitative analysis of PSD-95, GluA1, GluN2B, GluA1, Fyn, actin, and tau in PSD fraction (mean ± SEM, 2-tailed Student's t test, N ≥ 7). D, Confocal imaging of cortical neurons (14 DIV) transfected with GFP membrane. Top, Untreated neurons. Scale bar, 10 μm. Middle and Right, higher magnification of GFP membrane in dendrites (scale bar, 5 μm) and dendritic spine (designated box in the middle) from a neuron showing the effect of 15 min of Aβ treatment on spines followed by 15 min of Bic/4-AP. Scale bar, 1 μm.
- Figure 8.
Aβo treatment on primary cortical neuron cultures increases the interaction of F-actin with tau, which is reduced after synaptic activation. A, Representative Western blot showing the effect of 30 min Aβo (100 nm) and the effect of 15 min pretreatment with Aβo (100 nm) then 15 min of Bic/4-AP treatment on tau associated with F-actin in cultured cortical neurons. F-actin was collected after treatment and precipitated with phalloidin. B, Western blot analysis of actin and tau in control, Aβo (100 nm), and Aβo (100 nm) + Bic/4-AP 15 min condition (**,*p < 0.05 vs control, 1-way ANOVA; #p < 0.05 vs Aβo, N = 5 independent cultures).
- Figure 9.
The dynamics of tau in spines changes is distinct between translocation inducing synaptic activation from Aβ exposure and could be phosphorylation dependent. A, Time lapse of a spine pretreated with Bic/4-AP containing EGFP-tau and showing FRAP. B, Representative FRAP curves (%FRAP normalized to the prebleached intensity of the spine of EGFP-Tau-transfected neurons) of Tau WT (EGFP-Tau 2N4R) after 45 min of Bic/4AP (green, n = 21) or 45 min after Aβo application (red, n = 24) and TauT205A after 45 min of Bic/4AP (blue, n = 21). C, Percentage of EGFP-tau fluorescence or EGFP-tauT205A that was stable (white), dynamic (gray), or unbleached (black). Statistical analysis was performed by 2-tailed t test, ***p < 0.0001. D, Representative Western blot of Tau phospho-Threonine 205 (p-Thr205), phospho-Serine 404 (p-Ser 404), and tau total from PSD-enriched fractions for control, Bic/4-AP (30 min), Aβ (30 min), and Aβ (15 min)+Bic/4-AP (15 min) conditions. E, Quantifications of p-Thr 205 and p-Ser 404 under control, Bic/4-AP, Aβ, or Aβ + Bic/4-AP conditions (mean ± SEM, **,*relative to control; # # #relative to Bic/4-AP, +relative to Aβ, p > 0.05, 1-way ANOVA with Bonferroni's posttest, N = 5 independent cultures). F, Confocal imaging of cortical neurons (14 DIV) cotransfected with EGFP-Tau S404A and LifeAct-RFP. Left, Spatial repartition of EGFP-TauS404A (green) and LifeAct-RFP (red) in untreated neurons. Scale bar, 5 μm. Right, Higher magnification of EGFP-Tau S404A and LifeAct-RFP in dendritic spine neuron after Aβ treatment (15 and 30 min, designated box in the left) by 15 and 30 min of Aβo 100 nm treatment. The merged image shows no colocalization of F-actin and tau. Scale bar, 1 μm. G, Quantification of the fluorescence intensity of EGFP-TauS404A in the head of spines during the Aβo treatment. The graph represents the evolution of ΔF/F0 generated by EGFP-Tau under control conditions (black), EGFP-Tau (red), and EGFP-TauS404A (pink) induced by Aβo 100 nm treatment. Statistical analysis was performed by 2-way ANOVA followed by Bonferroni's posttest (mean ± SEM, ***p < 0.001, control n = 40, N = 3 independent cultures; Tau-WT Aβo 100 nm n = 79, N = 5; Tau S404A n = 98, N = 3 independent cultures).


