

Article Figures & Data
Figures
- Figure 1.
Mitochondrial distribution in cortical neurons during the development of dendritic arbors. A, A P7.5 cortical section showing the distribution of EGFP-labeled neurons. The dotted line indicates the boundary between layers 1 and 2. The numbers show cortical layers. B–I, Pyramidal neurons expressing EGFP and mito-RFP in E18.5 (B, C), P7.5 (D, E), P14.5 (F, G), and P21.5 (H, I) cortices. Plasmids encoding fluorescent proteins were electroporated in utero into ventricular zone cells at E13.5–13.75 to visualize the neuronal morphology and mitochondria. Dendritic mito-RFP signals are located mostly in the proximal portion at E18.5 and P7.5, but almost evenly distributed throughout the dendritic arbors at P14.5 and P21.5. The red dotted lines indicate the boundary between the marginal zone and the upper cortical plate (B, C) or between layers 1 and 2 (D–I). The regions indicated by the red brackets in D, E, H, and I are enlarged in D′–E″ and H′–I″. D′–E″, H′–I″, Enlarged images of the distal and proximal portions of the apical dendrite at P7.5 and P21.5. Mito-RFP signals (red) are more densely distributed in the proximal portion than in the distal portion of the apical dendrite at P7.5 (D′–E″), while they are approximately evenly distributed in both portions at P21.5 (H′–I″). Arrowheads point to branch points. J, K, Analysis of the developmental changes in the dendritic morphology: (J) number of branch points, (K) length of dendrites including all branches. Dendrites grow extensively from E18.5 to P14.5, but not between P14.5 and P21.5; n = 39 cells, two brains for E18.5; 21 cells, three brains for P3.5; 20 cells, three brains for P7.5; 9 cells, two brains for P14.5; and 15 cells, three brains for P21.5. L, Analysis of the dendritic distribution of the mito-RFP signals. Dendrites were divided into consecutive 10 μm segments based on the distance from the soma, and the percentage of mito-RFP pixels in each segment to the total number of pixels in the soma-dendrite compartment was calculated. Clear peaks from the mito-RFP signal are seen in the proximal portion of dendrites in E18.5 and P7.5 neurons, but not in P14.5 and P21.5 neurons. M, Normalized distribution of mito-RFP signals to dendritic size. The values obtained in L were further divided by the proportion of the area of each segment to the total area of the soma-dendrite compartment. Normalized signals are concentrated in the proximal portion of the dendrites at E18.5 and P7.5; n = 35 cells, two brains for E18.5; 21 cells, three brains for P3.5; 15 cells, three brains for P7.5; 4 cells, two brains for P14.5; and 7 cells, three brains for P21.5. A.U., arbitrary units. Scale bars: A, 250 μm; B, C, 10 μm; D, E, 20 μm; D′–E″, H′–I″, 10 μm; F–I, 40 μm. Error bars indicate SEM; **p < 0.01, ***p < 0.001, Mann–Whitney U test with Bonferroni correction (3 tests).
- Figure 2.
Overexpression of Mfn1 alters mitochondrial distribution and dendritic morphology. A–D, Pyramidal neurons expressing EGFP and mito-RFP in P7.5 cortices electroporated in utero with a control mock vector (A, B) or Mfn1-expression vector (C, D) at E13.5–13.75. The arrow in D points to the mitochondrial aggregate. The red dotted lines indicate the boundary between layers 1 and 2. The regions indicated by the red brackets are enlarged in A′–D′. A′–D′, Enlarged images of the proximal portion of the apical dendrite in control (A′, B′) and Mfn1 neurons (C′, D′). In the Mfn1 neuron, mito-RFP (red) signals are markedly reduced in dendrites and noticeably more branches emanate from the proximal portion of dendrites. E, F, Neurolucida drawings of control (E) and Mfn1 neurons (F). Note the increase in dendritic branching in the Mfn1 neurons. G–I, Analysis of the dendritic morphology: (G) the respective number of dendritic branch points in apical and basal dendrites and their sum, (H) the lengths of apical and basal dendrites and their sum, and (I) the number of branch points in the apical dendrite relative to the distance from the soma; n = 34 cells, three brains for control; 16 cells, five brains for Mfn1. Scale bars: A–D, 20 μm; A′–D′, 10 μm; E, F, 50 μm. Error bars indicate SEM; *p < 0.05, ***p < 0.001, Mann–Whitney U test.
- Figure 3.
Overexpression of Mfn1 alters the mature morphology of pyramidal neurons. A–D, Pyramidal neurons expressing EGFP and mito-RFP in P21.5 cortices electroporated in utero with a control mock vector (A, B) or Mfn1-expression vector (C, D) at E13.5–13.75. The red dotted lines indicate the boundary between layers 1 and 2. The regions indicated by the brackets are enlarged in A′–D′. A′–D′, Enlarged images of the proximal portion of the apical dendrite in control (A′, B′) and Mfn1 neurons (C′, D′). In the Mfn1 neuron, mito-RFP signals (red) are markedly reduced in dendrites and noticeably more branches emanate from the main trunk of the apical dendrite and from its side branches. E, F, Neurolucida drawings of control (E) and Mfn1 neurons (F). Note the more complex and smaller sized dendritic arbors in the Mfn1 neurons. G–I, Analysis of the dendritic morphology: (G) the respective number of dendritic branch points in apical and basal dendrites and their sum, (H) the lengths of apical and basal dendrites and their sum, and (I) the number of branch points in dendrites relative to the distance from the soma; n = 18 cells, three brains for control; 14 cells, four brains for Mfn1. Scale bars: A–D, 40 μm; A′–D′, 10 μm; E, F, 50 μm. Error bars indicate SEM; *p < 0.05, **p < 0.01, ***p < 0.001, Mann–Whitney U test.
- Figure 4.
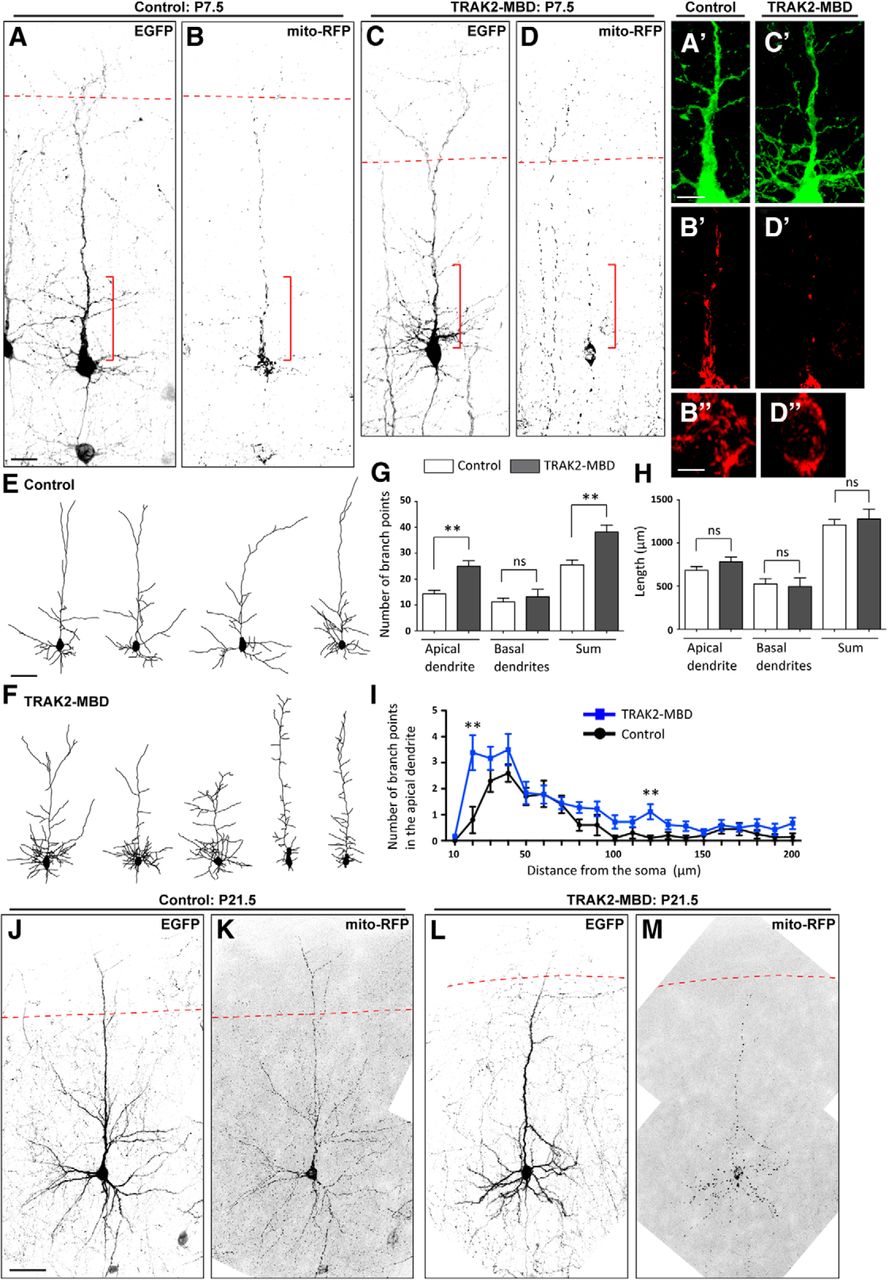
Overexpression of TRAK2-MBD alters mitochondrial distribution and dendritic morphology. A–D, Pyramidal neurons expressing EGFP and mito-RFP in P7.5 cortices electroporated in utero with a control mock vector (A, B) or TRAK2-MBD-expression vector (C, D) at E13.5–13.75. Expressions of TRAK2-MBD and EGFP were induced at E18.5 by tamoxifen administration. The red dotted lines indicate the boundary between layers 1 and 2. The regions indicated by the red brackets are enlarged in A′–D′. A′-D′, Enlarged images of the proximal portion of the apical dendrite in control (A′, B′) and TRAK2-MBD neurons (C′, D′). In the TRAK2-MBD neuron, mito-RFP signals (red) are reduced in dendrites and noticeably more branches emanate from the proximal portion of the dendrites. B″, D″, Enlarged images of the mito-RFP signals in the somata of control (B″) and TRAK2-MBD neurons (D″) show no overfused mitochondria. E, F, Neurolucida drawings of the control (E) and TRAK2-MBD neurons (F). Note the increase in dendritic branching in TRAK2-MBD neurons. G–I, Analysis of the dendritic morphology: (G) the respective number of dendritic branch points of apical and basal dendrites and their sum, (H) the lengths of apical and basal dendrites and their sum, and (I) the number of branch points in the apical dendrite relative to the distance from the soma; n = 10 cells, five brains for control; 18 cells, six brains for TRAK2-MBD. J–M, Pyramidal neurons expressing EGFP and mito-RFP in P21.5 cortices. No obvious alterations are seen in the dendritic morphology or mitochondrial distribution in the TRAK2-MBD neuron. Scale bars: A–D, 20 μm; A′–D′, 10 μm; B″, D″, 5 μm; E, F, 50 μm; J–M, 40 μm. Error bars indicate SEM; **p < 0.01, Mann–Whitney U test.
- Figure 5.
Distributions of the ER, Golgi, and endosomes in TRAK2-MBD and Mfn1 neurons. A–H, Pyramidal neurons expressing EGFP and ER-DsRed1 in P7.5 cortices electroporated in utero with a control mock vector for TRAK2-MBD (A, B), TRAK2-MBD-expression vector (C, D), control mock vector for Mfn1 (E, F), or Mfn1-expression vector (G, H) at E13.5–13.75. No obvious alterations are seen in the dendritic distribution of ER-DsRed1 signals in the TRAK2-MBD or Mfn1 neurons. I–P, Similar to A–H except that tdTomato and GalT-EGFP were electroporated instead of EGFP and ER-DsRed1, respectively. TdTomato and GalT-EGFP signals were color converted to green and red, respectively. GalT-EGFP signals in the TRAK2-MBD neuron (L) are more distally distributed than those in the control neuron (J). On the other hand, the distribution of GalT-EGFP signals is similar between the control (N) and Mfn1 neurons (P). Q–X, Similar to A–H except that EGFP and mRFP-Rab5 were electroporated instead of EGFP and ER-DsRed1, respectively. In the TRAK2-MBD neuron (T), noticeably more mRFP-Rab5 puncta are distributed distally in the apical dendrite and are present in basal dendrites. In the Mfn1 neuron (X), no obvious alterations are seen in the dendritic distribution of the mRFP-Rab5 signal. The arrow in X points to an aggregate-like structure in the soma. Aggregates are assumed not to be the result of endosomal fusion because (1) the number of mRFP-Rab5 puncta was relatively unchanged and (2) the fluorescent signal of the aggregates was always weaker than that of the puncta. It is more likely that these signals represent a fraction of mRFP-Rab5 proteins that localized to an unidentified structure, possibly the mitochondrial aggregate. At least 20 pyramidal neurons from more than two brains were analyzed for each condition. Scale bar, 10 μm.
- Figure 6.
Overexpression of Mfn1 and TRAK2-MBD does not disrupt mitochondrial membrane potential. A–L, Cultured cortical neurons expressing EBFP2 (cyan) and stained with JC-1 (green and red). Neurons were dissociated at E18.5 from cortices electroporated in utero with a control mock vector for Mfn1 (A–C), Mfn1-expression vectors (D–F), control mock vector for TRAK2-MBD (G–I), or TRAK2-MBD-expression vector (J–L) at E13.5–E13.75 and cultured for 3 d followed by JC-1 application. Dotted lines represent the contour of EBFP2-labeled cells. Treatment with CCCP, an uncoupler of oxidative phosphorylation that dissipates mitochondrial potential, caused a significant reduction in the ratio of red to green fluorescence of JC-1 (untreated cells: 1.00 ± 0.04; CCCP-treated cells: 0.61 ± 0.01; p < 0.001), confirming that the ratio is a measure of the mitochondrial membrane potential. Scale bar, 20 μm.
- Figure 7.
Increase in dendritic branching by Mfn1 and TRAK2-MBD in dissociated culture. A–I, Cultured cortical neurons expressing EGFP and mito-RFP and stained with the SMI-312 antibody. The culture was maintained for 3 d, fixed, and followed by SMI-312 immunofluorescence. Arrowheads point to SMI-312-positive axons. J, K, Analysis of the dendritic morphology: (J) the number of dendritic branch points, (K) the length of dendrites; n = 26 cells for control; 21 cells for Mfn1; 27 cells for TRAK2-MBD. Scale bar, 20 μm. Error bars indicate SEM; **p < 0.01, ***p < 0.001, Mann–Whitney U test with Bonferroni correction (2 tests).


