

Article Figures & Data
Figures
- Figure 1.
Schematic of proposed signaling pathways for Ca2+-induced growth cone turning. A, Components of attractive and repulsive Ca2+ signals. Our previous work (Ooashi et al., 2005) showed that repulsive Ca2+ signals (light blue rectangle) contain primary Ca2+ signals only, whereas attractive Ca2+ signals (pink rectangle) consist of primary Ca2+ signals and secondary CICR. B, Hypothetical signaling pathways downstream of Ca2+ signals, in which light blue and pink arrows represent repulsive and attractive cascades, respectively. In the present study, primary Ca2+ signals were generated by repetitive photolysis of a caged Ca2+, NP-EGTA, or by extracellular gradients of a physiological guidance cue, MAG. These primary Ca2+ signals can trigger CICR because RyRs are in the active state in our culture condition (Ooashi et al., 2005). To generate repulsive Ca2+ signals, we suppressed CICR by lowering cAMP level with the cAMP antagonist Rp-cAMPS. In this model, calcineurin and PIPKIγ90 act downstream of repulsive Ca2+ signals (light blue rectangle) to stimulate endocytosis for repulsion, whereas CaMKII and Cdk5 act downstream of attractive Ca2+ signals (pink rectangle) to suppress endocytosis for attraction. Together with CICR-stimulated exocytosis (Tojima et al., 2007), CaMKII and Cdk5 mediate an exocytosis–endocytosis imbalance on one side of the growth cone. Gray-shaded rectangles highlight pharmacological agents used in this study.
- Figure 2.
Alignment of amino acid sequences of PIPKIγ. A, Schematic representation of the PIPKIγ splice variants PIPKIγ87 and PIPKIγ90. We cloned chicken PIPKIγ87 encoding 639 aa and PIPKIγ90 containing additional 28 aa at the C terminus (667 aa in total). The amino acid sequence of the C-terminal stretch of chicken PIPKIγ90 was compared with that of human and mouse PIPKIγ90. This C-terminal region is highly conserved among these species and contains a serine residue that can be phosphorylated/dephosphorylated by Cdk5/calcineurin (S649 in chicken; red star). We made a phosphomimetic mutant (S649 to E substitution) and a kinase-dead mutant (D316 to A substitution; red arrowhead) of chicken PIPKIγ90. B, Full amino acid sequences of PIPKIγ87 and PIPKIγ90 in human, mouse, and chicken. Black boxes represent completely conserved sequences. Gray boxes represent sequence conservation >60%. Dashes indicate the absence of corresponding amino acids.
- Figure 3.
Embryonic DRG neurons express PIPKIγ. A, PIPKIγ immunoblotting of cultured embryonic chicken DRG neuron lysates showing two bands at ∼90 kDa. Their differential sensitivities to λ-PPase treatment suggest the presence of phosphorylated (top arrow) and unphosphorylated (bottom arrow) forms of PIPKIγ. Shown is a representative of three independent experiments. B, PIPKIγ immunoblots showing the effect of siRNAs (control siRNA, PIPKIγ siRNA#1 and #2) with tubulin immunoblots as a loading control. C, Quantification of PIPKIγ knock-down. PIPKIγ-to-tubulin ratios of immunoblot intensities after siRNA treatment were normalized to those without siRNA. *p < 0.05, **p < 0.01 versus control siRNA, Dunnett's multiple-comparison test (n = 3 independent experiments). D, PIPKIγ immunofluorescence and corresponding DIC images of a DRG growth cone (left) and images of no primary antibody control (right). Scale bar, 10 μm.
- Figure 4.
PIPKIγ90 mediates asymmetric endocytosis induced by repulsive Ca2+ signals. A–D, Effects of wild-type (WT) PIPKIγ90 (A, B) or its kinase-dead mutant D316A (C, D) on asymmetric endocytosis induced by repulsive Ca2+ signals. A, C, TIRFM images of single growth cones coexpressing EGFP-PIPKIγ90 (left) and mCherry-clathrin (right). NP-EGTA was photolyzed by repetitive UV light (3 s interval) in the presence of Rp-cAMPS to generate repulsive Ca2+ signals. The UV-irradiated area and the corresponding area on the opposite side were used as near and far ROIs, respectively (blue circles). Scale bars, 10 μm. B and D show schematic representations of the growth cone in A and C, respectively. TIRFM images of mCherry-clathrin were acquired every 3 s before (pre) and after the onset (time 0 s) of repulsive Ca2+ signals. Each red cross marks the position of a newly formed CCP within the ROIs during the indicated 30 s periods. Scale bars, 10 μm. E, F, Near-to-far ratios of CCP formation in growth cones expressing EGFP-PIPKIγ90-WT (E) or EGFP-PIPKIγ90-D316A (F). The y-axis indicates the number of newly formed CCPs per unit area within near ROI divided by that within far ROI, before (pre; −120 to 0 s) and after (UV; 0 to 120 s) the onset of repulsive Ca2+ signals. Each line represents Ca2+-induced change in a single growth cone. ***p < 0.001; N.S., not significant, paired t test.
- Figure 5.
PIPKIγ90 mediates Ca2+-induced growth cone repulsion. A, B, Time-lapse DIC images of a growth cone expressing EGFP tagged to wild-type (WT; A) or kinase-dead mutant (D316A; B) of PIPKIγ90. Repulsive Ca2+ signals were generated by laser photolysis of NP-EGTA at light blue spots. Time in minutes after the onset of repetitive laser irradiation (3 s interval) is shown. Scale bar, 10 μm. C, Ca2+-induced turning of growth cones expressing EGFP-PIPKIγ90-WT or EGFP-PIPKIγ90-D316A. Attractive (pink) or repulsive (light blue) Ca2+ signals were generated on one side of the growth cones. Positive and negative values expressed as mean ± SEM indicate attractive and repulsive turning angles, respectively. Numbers in parentheses indicate the number of growth cones examined. *p < 0.05, unpaired t test. D, E, Time-lapse DIC images of a growth cone containing control siRNA (D) or PIPKIγ siRNA #1 (E). Repulsive Ca2+ signals were generated by laser photolysis of NP-EGTA at light blue spots. Scale bar, 10 μm. F, Ca2+-induced turning of growth cones containing control siRNA, PIPKIγ siRNA #1 or #2. *p < 0.05 versus control siRNA, Dunnett's multiple-comparison test.
- Figure 6.
Attractive Ca2+ signals suppress endocytosis via CaMKII and Cdk5. A, TIRFM image of EGFP-clathrin in a growth cone treated with roscovitine. NP-EGTA was photolyzed by repetitive UV light (3 s interval) to generate attractive Ca2+ signals. The UV-irradiated area and the corresponding area on the opposite side were used as near and far ROIs, respectively (blue circles). Scale bar, 10 μm. B, Schematic representation of the growth cone shown in A. TIRFM images of EGFP-clathrin were acquired every 3 s before (pre) and after the onset (time 0 s) of attractive Ca2+ signals. Each red cross marks the position of a newly formed CCP within the ROIs during the indicated 30 s periods. Scale bar, 10 μm. C–O, Near-to-far ratios of CCP formation. Growth cones expressing EGFP-clathrin (C–G) or mCherry-clathrin (H–O) were analyzed. The y-axis indicates the number of newly formed CCPs per unit area within near ROI divided by that within far ROI, before (pre; −120 to 0 s) and after (UV; 0 to 120 s) the onset of repetitive photolysis that generated attractive (pink; C–I, M–O) or repulsive (light blue; J–L) Ca2+ signals. Each line represents a photolysis-induced change in a single growth cone. Ca2+-induced asymmetry in CCP formation was assessed in the absence (no drug; C) or presence of roscovitine (D, L, N, O), olomoucine (E), KN93 (F), or myr-AIP (G). In addition, the asymmetry was assessed in growth cones that had been transfected with EGFP-tagged wild-type (WT; H) and the dominant-negative form (D144N; I) of Cdk5, Venus-tagged phosphodeficient (T286A; J), and phosphomimetic (T286D; K, L) mutants of CaMKII or EGFP-tagged wild-type (WT; M, N) and phosphomimetic mutant (S649E; O) of PIPKIγ90. *p < 0.05, **p < 0.01, ***p < 0.001; N.S., not significant, paired t test.
- Figure 7.
CICR is independent of CaMKII and Cdk5. A, Growth cone loaded with NP-EGTA and two Ca2+ indicators, OGB-1 and FR. As Ca2+ concentrations elevate, OGB-1 augments and FR attenuates fluorescence emission. In the black-and-white image of FR fluorescence, the pink spot represents the site of laser irradiation and the black circle represents ROI used to quantify Ca2+-signal amplitude. The pseudocolor time-lapse images show changes in the ratio of OGB-1 to FR fluorescence intensities [Δ(ROGB-1/RFR), where R = F/F0], before and after focal laser-induced photolysis. Δ(ROGB-1/RFR) represents relative concentrations of cytosolic Ca2+ (for details, see Materials and Methods). Time in milliseconds after a single laser irradiation is shown. Scale bar, 10 μm. B, C, Time course changes in Δ(ROGB-1/RFR) within the ROI before (left) and 5 min after (right) treatment with high-dose ryanodine (B) or myr-AIP (C). Note that five laser pulses (pink arrowheads) triggered five Ca2+ elevations. Before and after the drug treatment, photolysis-induced attractive Ca2+ signals were analyzed in the same growth cones under the same experimental conditions. The dashed lines indicate the mean of the five peak Δ(ROGB-1/RFR) values before (ΔR′before) and after (ΔR′after) the drug treatment. D, E, ΔR′after/ΔR′before represents drug-induced changes in the amplitude of attractive Ca2+ signals. Vehicle only, H2O (D), or DMSO (E) was used as a control. The Ca2+ signal amplitude decreased after the treatment with high-dose ryanodine, consistent with the fact that attractive Ca2+ signals contain CICR. Neither CaMKII inhibitors (KN93 or myr-AIP) nor Cdk5 inhibitors (roscovitine or olomoucine) affected the Ca2+ signal amplitude, indicating that CICR generation is independent of CaMKII and Cdk5 activities. Numbers in parentheses indicate the total number of growth cones examined. Error bars represent SEM. **p < 0.01 versus control, Dunnett's multiple-comparison test.
- Figure 8.
Exocytosis–endocytosis imbalance underlies Ca2+-induced growth cone guidance. A–D, Time-lapse DIC images of growth cones in the absence (control; A) or presence (B–D) of the indicated drugs. Attractive Ca2+ signals were generated by laser photolysis of NP-EGTA at pink spots. Time in minutes after the onset of repetitive laser irradiation is shown. Scale bar, 10 μm. E, F, Ca2+-induced turning of growth cones in the absence (control) or presence of the indicated drugs. Positive and negative values expressed as mean ± SEM indicate attractive and repulsive turning angles, respectively. Numbers in parentheses indicate the number of growth cones examined. *p < 0.05, **p < 0.01 versus control, Dunnett's multiple-comparison test.
- Figure 9.
The involvement of CaMKII, Cdk5 and membrane trafficking in MAG-induced growth cone turning. A–F, Time-lapse phase contrast images of growth cones exposed to MAG gradients (arrows) in the absence (control; A) or presence (B–F) of the indicated drugs in bath. Time in minutes after the onset of MAG application is shown. Scale bar, 20 μm. G, Growth-cone-turning responses to attractive and repulsive MAG gradients generated in the absence and presence of Rp-cAMPS, respectively. The effects of the indicated drugs were tested. Positive and negative values expressed as mean ± SEM indicate attractive and repulsive turning angles, respectively. Numbers in parentheses indicate the number of growth cones examined. *p < 0.05, **p < 0.01, ***p < 0.001 versus control, Dunnett's multiple-comparison test.
- Figure 10.
Attractive MAG gradients suppress endocytosis via CaMKII and Cdk5. A, TIRFM image of EGFP-clathrin in a growth cone treated with roscovitine. The growth cone was exposed to an extracellular gradient of MAG (arrow) that acted as an attractive cue in the absence of Rp-cAMPS. The blue circles indicate near and far ROIs for analyses. Scale bar, 10 μm. B, Schematic representation of the growth cone shown in A. TIRFM images of EGFP-clathrin were acquired every 3 s before (pre) and after the onset (time 0 s) of MAG gradient application. Each red cross marks the position of a newly formed CCP within the ROIs during the indicated 30 s periods. Scale bar, 10 μm. C–F, Near-to-far ratios of CCP formation. The y-axis indicates the number of newly formed CCPs per unit area within near ROI divided by that within far ROI, before (pre; −120 to 0 s) and after (MAG gradient; 180 to 300 s) the onset of gradient application. Each line represents a MAG-induced change in a single growth cone. MAG gradients were repulsive (C) or attractive (D–F) in the presence or absence of Rp-cAMPS, respectively. The effects of attractive MAG gradients were determined in the absence (no drug; D) or presence of bath-applied myr-AIP (E) or roscovitine (F). *p < 0.05, **p < 0.01; N.S., not significant, paired t test.
- Figure 11.
Attractive MAG gradients evoke asymmetric exocytosis independently of CaMKII and Cdk5. A, B, Neurons coexpressing pHVenus-VAMP2 and mCherry-CAAX were cultured in the presence of bath-applied myr-AIP. Shown are pHVenus images of a single growth cone, 81 s before (pre; A) and 243 s after (B) the onset of MAG gradient application (arrow in B). The red lines in A and B are used for line-scan analyses in C and D, respectively. The blue rectangles are near and far ROIs for E–I. Scale bar, 10 μm. C, D, Line profiles of R′, an index of VAMP2 exocytosis, before (C) and after (D) the onset of MAG gradient application at the indicated time points. R′ represents RpHVenus/RmCherry, where RpHVenus and RmCherry are F/F0 values for pHVenus and mCherry, respectively. E–G, Superimposed traces of time course of Δ(R′near/R′far), an index of near-to-far asymmetry in VAMP2 exocytosis. Δ(R′near /R′far) = R′near /R′far − 1, where R′near and R′far represent R′ values for near and far ROIs, respectively. Each colored line represents Δ(R′near/R′far) in a single growth cone exposed to PBS gradients (E) or attractive MAG gradients (F,G) in the absence (no drug; E,F) or presence (G) of bath-applied myr-AIP. The x-axis represents time in seconds after the onset of PBS or MAG gradient. H, Averaged time course changes in Δ(R′near/R′far) induced by PBS or MAG gradients in the absence (no drug) or presence of bath-applied myr-AIP or roscovitine. Numbers in parentheses indicate the number of growth cones examined. Error bars represent SEM. I, The mean of Δ(R′near/R′far) values during the period from 180 to 297 s after the onset of gradient application. *p < 0.05; N.S., not significant, Bonferroni's multiple-comparison test.
- Figure 12.
Exocytosis–endocytosis imbalance is necessary for growth cone turning induced by asymmetric membrane perturbation. A–C, Time-lapse DIC images of growth cones exposed to gradients of MDC (A), α-LTX (B),or both simultaneously from opposite sides (C) as indicated by the arrows. Time in minutes after the onset of gradient application is shown. Scale bar, 10 μm. D, Growth-cone-turning responses to directionally applied MDC, α-LTX, or both. In case of simultaneous application of two gradients, the sources of MDC and α-LTX were positioned on opposite sides across the growth cone. Positive and negative values expressed as mean ± SEM indicate turning angles toward α-LTX and MDC gradients, respectively. Numbers in parentheses indicate the number of growth cones examined. *p < 0.05, Bonferroni's multiple-comparison test.
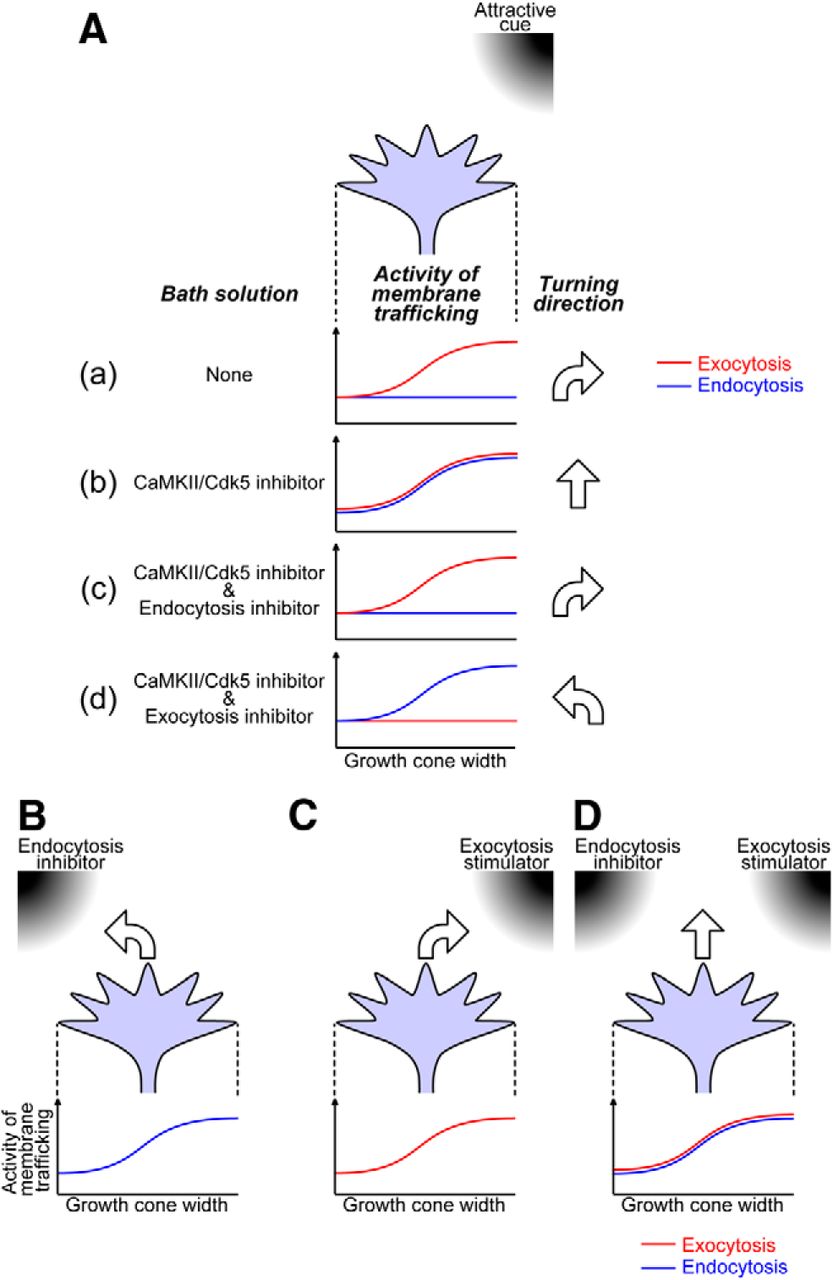
- Figure 13.
Exocytosis–endocytosis imbalance underlies bidirectional growth cone steering. A, Spatial profiles of membrane-trafficking activities across the growth cone width and turning responses to an extracellular attractive cue. Aa, Normally, exocytosis (red line) predominates on the side facing an attractive cue, whereas endocytosis (blue line) remains symmetric. Such localized predominance of exocytosis over endocytosis drives attractive turning toward the cue. Ab, In the presence of bath-applied CaMKII or Cdk5 inhibitor, an attractive cue activates both exocytosis and endocytosis on the near side of the growth cone. Such asymmetric but balanced facilitation of exocytosis and endocytosis causes straight migration. Ac, Additional treatment with an endocytosis inhibitor reconverts the balanced membrane trafficking into exocytosis predominance and restores the growth cone attractive response to the cue. Ad, Pharmacological suppression of exocytosis in addition to CaMKII or Cdk5 inhibition causes endocytosis predominance and repulsive turning even if the cue is attractive. B–D, Direct manipulation of membrane trafficking is sufficient for growth cone turning if exocytosis and endocytosis are not balanced. Extracellular gradients of an endocytosis inhibitor (B) and an exocytosis stimulator (C) induce growth cone turning toward the side with less endocytosis and more exocytosis, respectively. However, simultaneous application of both gradients most likely creates activity gradients of endocytosis and exocytosis of the same polarity across the growth cone, resulting in its straight migration (D).


