

Abstract
The primate brain successfully recognizes objects, even when they are partially occluded. To begin to elucidate the neural substrates of this perceptual capacity, we measured the responses of shape-selective neurons in visual area V4 while monkeys discriminated pairs of shapes under varying degrees of occlusion. We found that neuronal shape selectivity always decreased with increasing occlusion level, with some neurons being notably more robust to occlusion than others. The responses of neurons that maintained their selectivity across a wider range of occlusion levels were often sufficiently sensitive to support behavioral performance. Many of these same neurons were distinctively selective for the curvature of local boundary features and their shape tuning was well fit by a model of boundary curvature (curvature-tuned neurons). A significant subset of V4 neurons also signaled the animal's upcoming behavioral choices; these decision signals had short onset latencies that emerged progressively later for higher occlusion levels. The time course of the decision signals in V4 paralleled that of shape selectivity in curvature-tuned neurons: shape selectivity in curvature-tuned neurons, but not others, emerged earlier than the decision signals. These findings provide evidence for the involvement of contour-based mechanisms in the segmentation and recognition of partially occluded objects, consistent with psychophysical theory. Furthermore, they suggest that area V4 participates in the representation of the relevant sensory signals and the generation of decision signals underlying discrimination.
Introduction
Partial occlusions are ubiquitous in natural vision. In complex visual environments such as those cluttered with man-made objects or dense foliage, parts of objects are often obscured, introducing a source of stimulus ambiguity and posing a challenge to successful recognition. Nevertheless, our visual system is robust under these conditions and partially occluded objects are recognized rapidly and effortlessly. To begin to understand the neural substrates of object recognition under partial occlusion, we studied neuronal responses in visual area V4 of the primate cerebral cortex, an intermediate stage of the ventral visual pathway and a plausible neural locus for this perceptual capacity.
V4 neurons are sensitive to a variety of stimulus attributes related to shape, including the orientation and frequency of Cartesian and non-Cartesian gratings (Desimone and Schein, 1987; Gallant, et al., 1993), moderately complex shape features (Kobatake and Tanaka, 1994), and the curvature of boundary features at specific locations relative to object center (Pasupathy and Connor, 2001). Importantly, neuronal responses in V4 are modulated by partial occlusion: boundary features of an isolated shape are signaled more robustly compared with identical features resulting from the overlap of two objects (Bushnell, et al., 2011). V4 lesions also impair behavioral performance on a shape-matching task in which shape information is titrated by imposing occlusion cues (Schiller, 1995). Collectively, these previous findings suggest that V4 may contribute critically to shape recognition under occlusion, but we do not yet understand the mechanistic nature of this contribution and what strategies the brain uses to recognize occluded objects. One longstanding psychophysical hypothesis is that the segmentation and subsequent recognition of partially occluded objects are achieved by contour-based mechanisms (Wertheimer, 1938). To determine how V4 neurons selective for contour features contribute to this process, we measured single neuronal responses while monkeys discriminated visual shapes under partial occlusion.
We used a novel behavioral paradigm, a same/different shape discrimination task in which one of the two shapes was partially occluded (Fig. 1, see Materials and Methods for details). On each trial (Fig. 1A), monkeys had to report whether two shapes presented sequentially were the same or different. The first stimulus (the reference) was presented at central fixation and the second stimulus (the test) was presented at the center of the neuron's receptive field (RF). Monkeys indicated their choices by making a saccade to one of two peripheral targets (right/left for same/different). To titrate task difficulty, we varied the diameter of a set of randomly positioned occluding dots (Fig. 1B, see Materials and Methods). To maximize the potential contribution of neurons to task performance, we tailored the discrimination stimuli based on the shape preferences of the neuron recorded in each session. Using this paradigm, we first assessed the sensitivity of V4 neurons to shape information under occlusion, comparing neuronal and behavioral responses in the same sessions using well established quantitative methods (Britten et al., 1992; Uka and DeAngelis, 2003). To gain insight into how monkeys may discriminate occluded objects, we then investigated whether the most sensitive V4 neurons had distinctive functional properties—an approach conceptually similar to that used previously by Uka and DeAngelis (2004) to reveal the strategy used by monkeys to discriminate stimuli in depth. Finally, to determine how shape selective signals in V4 may contribute to perceptual decision making, we relate the timing of shape-selective and decision-related signals in V4.
Materials and Methods
Surgical methods.
Two adult male rhesus macaques (Macaca mulatta) were surgically implanted with custom-built head posts attached to the skull with orthopedic screws. After behavioral training (see Shape discrimination task, below), a recording chamber targeting the parafoveal representation of dorsal area V4 (left hemisphere for monkey 1, right hemisphere for monkey 2) was implanted based on structural MRI scans. A craniotomy was performed in a subsequent surgery. For detailed surgical procedures, see Bushnell et al. (2011). All animal procedures conformed to National Institutes of Health guidelines and were approved by the Institutional Animal Care and Use Committee at the University of Washington.
Visual stimulation.
Animals were seated in front of a visual display at a distance of 57 cm. Visual stimuli were presented on a CRT monitor (40.6 × 30.5 cm; 1600 × 1200 pixels; 97 Hz frame rate) calibrated with a spectrophotoradiometer (PR650; PhotoResearch). Stimuli were presented against an achromatic gray background (mean luminance 5.4 cd/m2). Stimulus onset and offset times were based on photodiode detection of synchronized pulses in the lower left corner of the monitor. During passive fixation and the behavioral task, animals were required to fixate a 0.1° white dot within 0.50–0.75° of visual angle. Eye position was monitored using a 1 kHz infrared eye-tracking system (Eyelink 1000; SR Research). Stimulus presentation and behavioral events were controlled by Linux-based custom software written in Python (Pype, originally developed by James Mazer and Jack Gallant).
Electrophysiology.
In each recording session, a single dura-puncturing microelectrode (250 μm; FHC) was lowered into cortex using an eight-channel acute microdrive system (Gray Matter Research). Voltage signals from the electrode were amplified and filtered and waveforms from single neurons were isolated using a 16-channel spike-sorting system (Plexon Systems). In our earliest recording sessions, electrode penetrations spanned the anteroposterior and mediolateral extent of the craniotomy to ascertain the location of dorsal V4, which occupies the prelunate gyrus and adjoining sulcal banks. We differentiated V4 from neighboring V2 neurons primarily based on RF size, location, and physiological characteristics. In our dataset, RF eccentricities ranged from 0° to 10.7° (median = 5°). We studied the responses of 88 well isolated V4 neurons in total; our criteria for data inclusion are listed below (see Criteria for data inclusion).
Characterization of neuronal shape and color preferences.
For each neuron isolated, we first mapped the position and extent of its spatial RF with a variety of shape stimuli under the experimenter's control. We then identified a preferred and a nonpreferred stimulus color by manually assessing responses to 25 colors (sampled from CIE color space) presented at four different luminances (2.7, 5.4, 8.1, and 12.1 cd/m2). We then quantified the neuron's shape selectivity in detail, measuring its responses to 43 shapes (Fig. 2A) presented at eight orientations (45° intervals) and in the preferred color. These parametric shape stimuli were designed to sample a range of convex and concave boundary features and have been used successfully to characterize the shape selectivity of V4 neurons (Pasupathy and Connor, 2001; Bushnell et al., 2011). Stimulus size was chosen such that all parts of the stimuli fell within the estimated RF area (estimated RF diameter = 1.0° + 0.625 × RF eccentricity; based on data from Gattass et al., 1988). Each stimulus was presented at least three times in random order; stimuli were presented for 300 ms each and were separated by an interstimulus intervals of 200 ms. On each trial, three to five stimuli were presented and the animal was rewarded with juice or water for maintaining fixation throughout.
Shape discrimination task.
Animals were trained to report whether two sequentially presented shapes were the same or different (Fig. 1A). The first shape, called the “reference,” was presented at central fixation; the second shape, called the “test,” was presented at the center of the RF of the neuron under study. Both stimuli were presented in the neuron's preferred color, which was chosen during the preliminary characterization tests. To titrate task difficulty, a field of 36 dots was superimposed on the test stimulus (Fig. 1B); dot diameter was varied parametrically, resulting in different levels of occlusion. Occluding dots were presented in the neuron's nonpreferred color at positions that were randomized on each trial. We chose 36 positions on a 9 × 9 grid that fit entirely within the RF and added a small amount of random jitter to each chosen position. The level of occlusion was quantified as the percentage of the RF area not covered by the occluding dots (i.e., the “% unoccluded area”). In each behavioral session, we always included no occlusion trials (100% unoccluded area) and chose three to eight levels of occlusion such that the lowest level of occlusion tested produced close to chance performance (50% correct). With this random occluder placement strategy, the amount of occlusion of any boundary feature differed on individual trials even at the same level of occlusion, but was on average proportional to √unoccluded area. Empirically, we found that 10 repeats at each occlusion level was sufficient to produce smooth, monotonic psychometric curves, implying that, on average, a greater fraction of the critical feature was occluded for higher occlusion levels.
In each session, we chose two discrimination stimuli based on a detailed characterization of the neuron's shape preferences. We chose one shape that evoked a strong response (preferred) and a second that evoked a weak response (nonpreferred). We generally aimed to minimize differences in contour features across the pair of shapes. For example, discrimination stimuli often differed only in a single localized region along the shape's boundary. For some neurons, this region was a contiguous portion of the boundary spanning a 90° segment; for other neurons, this region was larger (see Figs. 2, 3, 4 for example discrimination stimuli). For a subset of neurons, the difference regions between preferred and nonpreferred shapes were noncontiguous; for example, when the chosen shapes included a square and a star (Fig. 2A, shapes #43 and #1). The main motivation behind our stimulus selection criteria was to restrict the subset of V4 neurons that could contribute to the behavioral discrimination, thereby increasing the potential influence of the neuron recorded in any given session. For the example session shown in Figure 3, we could have chosen shape #21 at 0° as the nonpreferred stimulus, but because this shape differed from the preferred stimulus in more than one component feature, we reasoned that a larger subset of V4 neurons could contribute to discrimination performance. A final and important selection criterion was that the animal could discriminate the stimuli well (i.e., with ≥82% accuracy) when presented in the neuron's RF in the absence of occluders. Collectively, these selection criteria also ensured experimental consistency across sessions. Note that for one neuron, we did not perform a quantitative test of shape selectivity in the interest of time; instead, we chose discrimination stimuli based on a qualitative assessment of its preferences. Data from this neuron are not included in the population results in Figures 7, 8, 9, 10, and 13.
Each trial (Fig. 1A) began with the presentation of a fixation point at the center of the screen. Once the animal acquired fixation, the reference stimulus was presented at fixation for 600 ms, followed by a test stimulus in the RF for 600 ms. Reference and test stimuli were separated by an interstimulus interval of 200 ms. After a brief delay of 50 ms, the fixation spot was extinguished and two peripheral choice targets appeared (Fig. 1A, left and right dots). Animals reported whether the two shapes presented were the same or different by making a saccade to the right target for “same” and to the left target for “different.” Animals were required to report their choices within 500 ms; in cases in which they broke fixation or failed to respond, the trial was repeated randomly later in the session. Trials were separated by an intertrial interval of 2 s. With two discrimination stimuli serving as both reference and test, there were a total of four trial conditions at each occlusion level (two references × two tests).
Criteria for data inclusion.
We studied 88 V4 neurons that were well isolated, clearly responsive to visual stimuli, had well defined RFs, and remained well isolated for at least 11 repeats of the shape discrimination task. Of these, nine neurons were excluded from further analysis because their responses to the preferred and nonpreferred stimuli were not sufficiently different in the absence of occluders: S500, defined as the area under the ROC curve constructed from responses to unoccluded stimuli in the window 50–500 ms after test stimulus onset, was <0.82. We also excluded data from 17 other neurons because the associated psychometric curves revealed a bias in behavior: the animal was more likely to report a match for one of the reference stimuli, suggesting that the discrimination was too difficult. Therefore, the results reported here are based on a total of 62 neurons.
Behavioral and neuronal performance.
For each session, we calculated the proportion of correct responses at each occlusion level. We then fit a cumulative Weibull distribution function to these psychometric data using a least-squares method and extracted estimates of the psychometric threshold, defined as the level of occlusion corresponding to 82% correct performance (Britten et al., 1992).
To quantify neuronal sensitivity, we first counted spikes in the window 50–200 ms after stimulus onset; the lower cutoff of 50 ms was chosen to account for visual response latency in V4. Then, for each occlusion level, we quantified neurometric performance by calculating the area under the ROC curve derived from the spike count distributions for preferred and nonpreferred stimuli (Britten et al., 1992). To this neurometric curve, we fit a cumulative Weibull distribution function and extracted analogous estimates of the neurometric threshold. Last, we repeated this analysis by computing neurometric curves over longer counting windows: 50–350 ms and 50–500 ms after stimulus onset.
Tuning for contour curvature.
To quantify each neuron's selectivity for contour shape, we first computed the average firing rate in the temporal window 50–300 ms after stimulus onset for each stimulus and across all stimulus repetitions. We then used our previously established methods to model neuronal shape preferences in V4 as a function of contour curvature and angular position (Pasupathy and Connor, 2001). Briefly, each stimulus was represented using eight ordered pairs of curvature × angular position. Curvature values ranged from −0.3 (medium concavity) to +1.0 (sharp convexity); angular position values ranged from 0° (right of center) to 360° in a counter-clockwise direction. For example, the star at 0° (Fig. 2A, shape #1, top row) was described by 4 sharp convexities (curvature = +1.0) at 0°, 90°, 180°, and 270° and 4 intervening concavities (curvature = −0.3) at 45°, 135°, 225°, and 315°. We used a nonlinear least-squares optimization method to identify a 2D Gaussian function in the curvature × angular position space that best predicted the observed responses; the correlation coefficient between observed and predicted responses quantified the model's goodness of fit (GOF). The model had a total of five parameters: two means (μcurv, μθ), two SDs (σcurv, σθ), and an amplitude term (for more details, see Pasupathy and Connor, 2001). To consider selectivity for feature conjunctions, we modeled shape responses as a product of two Gaussian functions, each of which was defined in the curvature × angular position space; we conducted partial F tests to evaluate whether the inclusion of the second feature significantly improved the goodness of fit. We also considered stimulus area, mass-based orientation (i.e., principal axis of the stimulus based on the second moment), and its elongation (Pasupathy and Connor, 2001) and the spatial frequency content of stimuli as independent variables, both alone and in combination with curvature and angular position, to investigate the representational bases of non-curvature-tuned neurons.
Shape selectivity.
To assess the time course of shape selectivity, we performed a sliding-window ROC analysis on the responses to the preferred and nonpreferred stimuli for each occlusion level. At each time point (1 ms increments), we counted spikes in a 100-ms-centered window and assessed selectivity by computing the area under the ROC curve constructed from the spike count distributions for the preferred and nonpreferred stimuli. Selectivity values ranged from 0.5 (nonselective) to 1.0 (very selective). To generate population histograms (as in Figs. 9, 10), we averaged the data at each occlusion level across neurons. Because we did not test all neurons at all occlusion levels (we typically tested each neuron with three to eight occlusion levels), the number of neurons contributing to the average histograms varied across occlusion level. For example, data for curvature-tuned neurons were based on 15 neurons at 59% unoccluded area and 24 neurons at 100% unoccluded area (median of 23 neurons across different occlusion levels). Similarly, data for non-curvature-tuned neurons were based on 20 neurons at 59% unoccluded area and 37 neurons at 100% unoccluded area (median of 33 across different occlusion levels).
Match/nonmatch selectivity.
To identify neurons that carried a match/nonmatch decision signal (as in Figs. 11, 12), we conducted a two-way ANOVA with stimulus identity and saccade direction as the two factors. We based the analysis on neuronal activity in the window 50–600 ms after the onset of the test stimulus pooled across all occlusion levels. To ensure that we were not simply detecting responses to a specific combination of reference/test stimuli, we included data from both correct and error trials, but the effects were similar when these data were analyzed separately. All neurons with a statistically significant main effect for saccade direction or an interaction (p < 0.01) were identified as cells for further analysis. For all neurons, we compared neuronal activity in the 50–600 ms window on match versus nonmatch trials and identified the neuron's preferred saccade direction. We then conducted a sliding-window ROC analysis (as described in the preceding paragraph) based on the preferred saccade direction identified.
Results
We studied 62 well isolated V4 neurons in two macaque monkeys. We began each session by characterizing the neuron's shape preferences in detail using a set of parametric shapes viewed passively. We then selected two shapes to serve as the behavioral discrimination stimuli: one that elicited a strong response and another that elicited a weak response (preferred and nonpreferred, respectively). We then measured neuronal responses while monkeys performed a shape discrimination task (Fig. 1A) in which the discriminability of the chosen shapes was manipulated using partial occlusion (Fig. 1B). To determine which neurons were well suited to contribute to behavioral performance, we assessed neuronal sensitivity across occlusion levels and compared neuronal and psychophysical performance in the same sessions.

Experimental paradigm. A, Sequence and duration of events in a trial of the shape discrimination task. After acquiring fixation, monkeys viewed two shapes: the reference stimulus at the center of gaze, followed by the test stimulus in the neuron's RF. The fixation point was then extinguished and two peripheral choice targets appeared. Animals reported whether the reference and test stimuli were the same or different (match/nonmatch) with rightward and leftward saccades, respectively. New discrimination stimuli were chosen each day based on the shape preferences of the neuron recorded (a preferred and nonpreferred shape). B, The test stimulus was partially occluded by a field of dots (left); 36 dots were randomly positioned in a 9 × 9 square grid within the neuron's estimated RF (circle). Task difficulty was titrated by varying the diameter of occluding dots (right); occlusion level was parameterized as the percentage of the RF area that remained unoccluded (% unoccluded area).
Example data
A representative example of neuronal and behavioral responses measured concurrently is shown in Figure 2. Preliminary characterization of the neuron's shape preferences (Fig. 2A) revealed that it was highly selective: some stimuli evoked strong responses, whereas most evoked weak responses. Shapes that evoked the strongest responses contained a sharp convex feature pointing to the lower right. Based on this, we chose two shapes for the behavioral task (Fig. 2B,C, preferred and nonpreferred, highlighted by red and blue squares, respectively). These stimuli differed primarily in the localized region toward the lower right of the shape, coincident with the preferred feature location and had identical boundary features between 45° (Fig. 2, top right) and 225° (Fig. 2, bottom left). We also chose two stimulus colors based on a qualitative assessment of color selectivity: shape stimuli were presented in blue (preferred) and occluding dots in green (nonpreferred). These stimulus choices ensured a sizeable difference in the neuron's responses to the two shapes and a primarily modulatory influence from the occluding dots. Figure 2, B and C, show peristimulus time histograms for the preferred and nonpreferred shapes when presented inside the neuron's RF during the behavioral task. Responses to the preferred unoccluded stimulus (Fig. 2B, black; thin lines show SEM) were strong, as was shape selectivity, quantified by the area under the ROC curve based on responses in the 50–500 ms window (S500 = 0.99). As occlusion level increased, responses to the preferred stimulus showed a gradual decline (Fig. 2B). This pattern could not be attributed to suppression from the occluding dots, which were presented in the neuron's nonpreferred color, because responses to the nonpreferred stimulus increased slightly for higher occlusion levels (Fig. 2C). Figure 2D shows behavioral performance (gray) plotted against the percentage of the test stimulus area that was unoccluded by dots. For unoccluded stimuli (100% unoccluded area), behavioral performance was almost perfect (97% correct). As occlusion level increased, behavioral performance gradually declined, approaching chance levels at the highest occlusion level tested (∼60% unoccluded area). To determine whether the neuron's responses were sufficiently sensitive to account for the observed behavioral performance, we constructed a neurometric curve (Britten et al., 1992; Fig. 2D, black; see Materials and Methods) based on responses to preferred and nonpreferred stimuli in the window 50–200 ms after stimulus onset. We then fit a cumulative Weibull distribution function to this curve and extracted the threshold parameter (see Materials and Methods). In this example, psychometric and neurometric thresholds were similar (tick marks along the abscissa; 87% and 88%, respectively). Because neurometric thresholds derived from responses over the entire stimulus epoch in fixed-duration tasks are known to overestimate single neuron sensitivity (Cook and Maunsell, 2002; Cohen and Newsome, 2009), we considered three different counting windows (50–200, 50–350, and 50–500 ms). We found that neuronal performance showed a modest improvement for longer counting windows (Fig. 2E,F) consistent with previous studies (Vogels and Orban, 1990; Britten et al., 1992; Uka and DeAngelis, 2003). For this neuron, as the length of the counting window increased, the neurometric threshold decreased slightly, as did the ratio of the neurometric to psychometric thresholds (threshold ratio = 1.02, 0.96, and 0.95, respectively). Therefore, the neurometric curve starts off slightly to the right of the psychometric curve and shifts progressively to the left as the counting window becomes longer. This leftward shift, although modest, can be partly attributed to less noisy estimates of neuronal firing over longer counting windows (Britten et al., 1992; cf. Uka and DeAngelis, 2003). However, another important factor is the delayed onset of shape selectivity under partial occlusion, which we examine in detail later (Fig. 10).

Results from an example session showing matched neuronal and behavioral performance. A, Characterization of the neuron's shape preferences; responses to 43 shapes (columns) presented at eight rotations (rows) in a passive fixation task. Some shapes (#1, #36, and #43) were shown at fewer rotations due to rotational symmetry. The background intensity of each icon depicts the average response to that shape. Responses were strongest for shapes containing a sharp convexity to the lower right. Shapes highlighted by red (preferred) and blue (nonpreferred) squares were chosen as the discrimination stimuli. B–C, Response PSTHs (σ = 10 ms) for the preferred and nonpreferred shapes at different occlusion levels (colored lines). Responses to the preferred shape were strong when it was unoccluded (black; thin lines show SEM) and decreased with increasing occlusion level; the opposite occurred for responses to the nonpreferred shape. D–F, Comparison of behavioral (gray) and neuronal (black) performance across occlusion level. Symbols indicate percentage correct performance at each occlusion level; lines are descriptive fits to the data (see Materials and Methods). Neurometric curves were constructed based on responses in three counting windows; the psychometric curve is redrawn for visual comparison. Tick marks along the abscissa mark neurometric and psychometric thresholds (black and gray, respectively).
Figure 3 shows results from another example session. This neuron's responses also showed strong shape selectivity (Fig. 3A). Many of the stimuli that evoked the strongest responses contained a medium convexity adjoined by a concavity positioned toward the bottom of the shape. Based on this, we chose two shapes for the behavioral task (see red and blue squares); one shape contained the preferred feature and the other did not. Responses to the preferred unoccluded stimulus (Fig. 3B, black) were strong, as was shape selectivity (S500 = 1.00). Responses to this stimulus declined gradually with increasing occlusion level, but the decline was more gradual than in the previous example; even at the highest level of occlusion tested (45% unoccluded area), the preferred stimulus evoked stronger responses than the nonpreferred stimulus (Fig. 3B,C, cf. red lines). As in the previous example, psychophysical performance (Fig. 3D, gray) for unoccluded shapes was high (96%) and declined gradually with increasing levels of occlusion, reaching 61% correct at the highest occlusion level tested. The neurometric curve constructed from responses in the shortest counting window (Fig. 3D) closely matched the psychometric curve (neurometric and psychometric thresholds were 77% and 74%, respectively). The neurometric curves for longer counting windows (Fig. 3E,F) had lower thresholds than the psychometric curve, reflecting higher sensitivity than animal behavior (threshold ratios were 0.97, 0.68, and 0.64 respectively).

Results from another example session showing matched neuronal and behavioral performance. Same format as in Figure 2. A, Neuronal responses were strongest for shapes containing a feature at the bottom composed of a medium convexity adjoined by a concavity. B–C, Responses to the preferred shape were strong when it was unoccluded and decreased gradually with increasing occlusion level. Responses to the nonpreferred shape were weak at all levels of occlusion. Discrimination stimuli were presented in blue (preferred color) and the occluding dots in brown (nonpreferred color). D–F, Psychometric and neurometric curves were very similar for the shortest counting window; neuronal performance was even more sensitive than animal behavior for longer windows.
Results from a contrasting example session are shown in Figure 4. This neuron's responses were also strongly shape selective; only a few stimuli evoked strong responses, whereas most evoked weak or no responses (Fig. 4A). However, unlike in the previous examples, it was difficult to explain this neuron's responses in terms of selectivity for specific contour features. This could, in principle, arise from high variability in the neuron's responses; however, we confirmed that the coefficient of variation of responses was no greater than for the neurons in previous examples (one-tailed t test, p > 0.7). We chose two discrimination stimuli (see red and blue squares) that evoked very different responses when unoccluded (S500 = 0.99; Fig. 4B,C, cf. black lines). Psychophysical performance (Fig. 4D, gray) for unoccluded shapes was high and declined gradually with increasing occlusion, reaching 58% at the highest occlusion level tested (45% unoccluded area). The psychometric threshold in this session was lower than in the previous examples (68%), indicating better performance. Unlike in those examples, however, this neuron's responses to the preferred stimulus declined rapidly even at the weakest occlusion levels (Fig. 4B, cf. responses at 100% and 90% unoccluded area). As a result, neurometric performance declined rapidly with increasing occlusion (Fig. 4D–F). The high threshold ratios for all three counting windows (1.39, 1.32, and 1.27, respectively) reflect the poor neuronal sensitivity to shape information under occlusion. Therefore, this neuron was similar to the first two in terms of its strength of selectivity for unoccluded stimuli (S500 ≥ 0.99 for all three cells), but was strikingly different in terms of its susceptibility to partial occlusion.

Results from a contrasting example session showing unmatched neuronal and behavioral performance. Same format as in Figure 2. A, The neuron responded strongly to a few shapes, but its shape preferences were hard to describe in terms of local contour features. B–C, Responses to the preferred shape were strong when it was unoccluded and decreased rapidly with increasing occlusion level; responses to occluded shapes were weak, even for low occlusion levels (compare responses at 99% and 96% unoccluded area). Responses to the nonpreferred shape were generally weak. Discrimination stimuli were presented in magenta (preferred) and the occluding dots in green (nonpreferred). D–F, Psychometric and neurometric curves were largely unmatched for the shortest counting window; neuronal performance improved slightly for longer windows, but behavioral performance was always better.
Population data
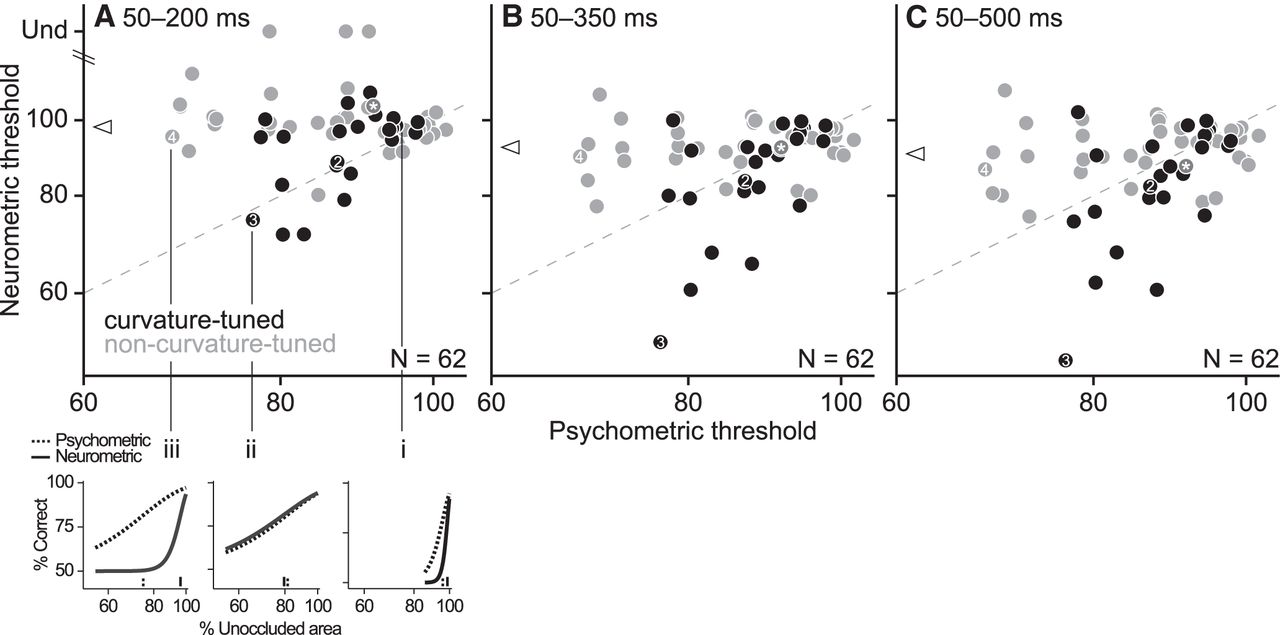
The psychometric thresholds for all 62 experimental sessions are shown in Figure 5A (abscissa). Because we chose different pairs of discrimination stimuli each day based on the shape preferences of the neuron recorded, the difficulty of the behavioral discrimination varied across sessions; as a result, the psychometric thresholds spanned a wide range of values (68–102%). We investigated the relationship between psychometric and neurometric thresholds, computing neurometric thresholds over different temporal windows (Fig. 5A–C). The neurometric thresholds for the shortest counting window (Fig. 5A, ordinate) also spanned a range of values (71–114%). There was a modest improvement in neuronal performance for the longer temporal windows, as indicated by lower neurometric thresholds (Fig. 5, cf. triangles in A–C.). When we compared the neurometric and psychometric thresholds across the population, we found that sessions with the highest psychometric thresholds (Fig. 5, data points at the extreme right) had correspondingly high neurometric thresholds; these data hewed close to the identity line (Fig. 5, top right corner). In these sessions, neurometric and psychometric performance dropped precipitously with occlusion level (see the representative example in Fig. 5A, breakout i), indicating that the discrimination was difficult for both the monkey and the neurons. For sessions with lower psychometric thresholds (data points in the middle or left), the neurometric thresholds spanned a range of values. For some sessions, neurometric performance declined gradually with occlusion, as did psychometric performance, and the neurometric thresholds were comparable to psychometric thresholds (see Fig. 5A, breakout ii). Neurons recorded in these sessions were similar to the animal in terms of their susceptibility to occlusion. For other sessions, neurometric performance alone declined precipitously with occlusion, resulting in high neurometric thresholds (Fig. 5, breakout iii) and indicating the high susceptibility of these neurons to our occlusion manipulation.

Population results. A–C, Psychometric and neurometric thresholds for all sessions. Each symbol represents data from one session; symbol color indicates the classification of neurons (see Materials and Methods): curvature-tuned neurons are shown in black (GOF ≥ 0.5) and non-curvature-tuned neurons in gray (GOF < 0.5). Symbols numbered 2–4 correspond to the example sessions in Figures 2, 3, and 4; asterisks correspond to a session in which neuronal shape preferences were not characterized in detail; data from this session were excluded from population results in Figures 7, 8, 9, 10, and 13. In A, neurometric thresholds for three neurons were undefined. Breakout sets i–iii illustrate the diversity of neurometric and psychometric curves across our dataset (see text). In A–C, neurometric thresholds were computed from responses in three counting windows, as labeled; psychometric thresholds are identical across panels. Neurometric thresholds were lower, on average, for longer windows (triangles show medians); there was a significant difference between the neurometric thresholds in A and each of B and C (t test, p < 0.05).
Across all sessions, the neurometric thresholds spanned a narrow range when the psychometric thresholds were high and a wider range when the psychometric thresholds were lower. This diversity in neurometric thresholds echoes the diversity in neuronal susceptibility to occlusion and cannot be simply attributed to response modulation by the nonpreferred color of the occluding dots. This is because over half of the neurons (35/62) showed an increase in responses to the nonpreferred stimulus with increasing occlusion level (e.g., Fig. 2), suggesting that the nonpreferred color was not always suppressive. Moreover, there was no correlation between the rate of change of responses to the nonpreferred stimulus as a function of occlusion and either the neurometric threshold (r = 0.05, p = 0.67) or the threshold ratio (r = 0.07, p = 0.6). Therefore, there was no systematic relationship between the influence of the nonpreferred color and the neuronal susceptibility to occlusion. There was also no correlation between the RF location of the test stimulus and either the psychometric thresholds (Fig. 6A, r = 0.09, p = 0.49) or the threshold ratios (Fig. 6B, r = 0.08, p = 0.55), suggesting that differences in neuronal sensitivity across the population of neurons could not be attributed to eccentricity effects. Finally, we found no significant correlation between neurometric and psychometric thresholds across sessions, which is not unlike other results in the ventral stream (but cf. Britten et al., 1992; Uka and DeAngelis, 2003; Allred and Jagadeesh, 2007; Liu and Jagadeesh, 2008; Matsumora et al., 2008; Shiozaki et al., 2012).

Relationship between stimulus eccentricity and behavioral and neuronal performance. In each experimental session, stimulus eccentricity was chosen based on the receptive field center of the neuron recorded. A, Psychometric thresholds versus eccentricity. B, Threshold ratios versus eccentricity. There was no correlation between stimulus eccentricity and either psychometric thresholds or threshold ratios.
Threshold ratios and tuning for contour curvature
Next, we investigated whether neurons with high sensitivity for shape information under occlusion stood apart in terms of their visual representational bases. We reasoned that neurons with high sensitivity, that is, those neurons with responses that were less susceptible to our occlusion manipulation, may be better suited to the process of segmenting and discriminating occluded objects. As such, understanding their representational bases will provide insights into how the brain tackles the problem of occlusion. We have shown previously that the responses of many V4 neurons are dictated by contour features at specific locations along an object's boundary (Pasupathy and Connor, 2001). For example, the neuron in Figure 2A responded preferentially to shapes containing a sharp convexity to the lower right. Selectivity for contour features can be well described by a simple descriptive model: a 2D Gaussian function in a shape space defined by curvature × angular position (see Materials and Methods). For each neuron, we fit this model to the responses collected in the preliminary characterization of shape preferences (as in Fig. 2A) and evaluated the model's GOF by computing the correlation between the observed and predicted responses. We then investigated whether a correlation existed between the threshold ratios and the GOF. For the example shown in Figure 2A, the best-fitting Gaussian function had a peak at curvature +1.0 (sharp convex) and angular position 322° (down and to the right), consistent with our subjective interpretation of the responses; the model explained the data quite well (GOF = 0.7). Similarly, for the responses in Figure 3A, the best-fitting Gaussian function had a peak at curvature +0.7 (medium convex) and angular position 311° (down and to the right); the model explained the data reasonably well (GOF = 0.56) and the fit was further improved when the adjoining concavity at the bottom of the shape was also taken into account (GOF = 0.76). In contrast, the responses shown in Figure 4A were harder to explain on the basis of a preferred boundary feature. The best-fitting Gaussian function had a peak curvature +0.22 (shallow convex) and angular position 105° (up and to the left), but this model failed to explain the data well (GOF = 0.23).
Across the population of neurons, we found a significant negative correlation between the Fisher r- to Z-transformed values of GOF and the threshold ratios (Fig. 7A, r = −0.39, p < 0.005). Among neurons that were well described by the curvature model (GOF ≥ 0.5; n = 24/61; Fig. 5A–C, black symbols), herein referred to as “curvature-tuned” neurons, a majority had threshold ratios near 1, indicating that they were just as sensitive as animal behavior; many had ratios <1, indicating that they were even more sensitive than behavior. In contrast, among neurons that were poorly described by the curvature model (GOF < 0.5; n = 37/61; gray symbols in Fig. 5A–C), herein referred to as “non-curvature-tuned” neurons, many had threshold ratios >1, indicating that they were less sensitive than behavior. The threshold ratios of curvature-tuned neurons were significantly smaller than those of non-curvature-tuned neurons for all three counting windows (one-tailed t test, p < 0.01). This was because the responses of curvature-tuned neurons yielded lower neurometric thresholds for all three counting windows (medians were 97%, 91%, and 86%, respectively) compared with non-curvature-tuned neurons (medians were 99%, 94%, and 94%); these differences were statistically significant for the two longer counting windows (t test, p < 0.01). The higher neurometric thresholds and threshold ratios for non-curvature-tuned neurons cannot be attributed to weaker shape selectivity because we ensured that all cells were highly shape selective (S500 was always ≥ 0.82) and the correlation between selectivity, as measured by S500, and the Fisher-transformed GOF values was not significant (Fig. 7B, r = 0.19, p = 0.15). There was also no significant difference between curvature-tuned and non-curvature-tuned neurons in terms of their peak firing rates (t test, p = 0.8; cf. peak responses in Figs. 2B, 3B, 4B) or their response variability (t test, p = 0.77; cf. SEM in Figs. 2B, 3B, 4B). Moreover, we confirmed that there was still a significant negative partial correlation between the Fisher-transformed values of GOF and threshold ratios even when the S500 indices, peak firing rates, and response variability were considered as control variables (r = −0.33, p = 0.01). Therefore, the lower neurometric thresholds of curvature-tuned neurons reflect the more gradual decline of their responses to preferred stimuli with increasing occlusion level, as is evident in Figures 2 and 3.

Relationship between model GOF, shape selectivity, and threshold ratio. A, Threshold ratios versus the curvature model's GOF. Each symbol represents data from one session. Neurometric thresholds were based on the longest counting window. Neurons that were best fit by the model (curvature-tuned) had the lowest threshold ratios. B, Shape selectivity for unoccluded stimuli (S500, see Materials and Methods) versus the model's GOF. All neurons, regardless of classification, were highly selective and we did not find a significant correlation between the strength of selectivity and GOF.
To evaluate whether the faster decline of the responses of non-curvature-tuned neurons was due to possible selectivity for conjunctions of boundary features unaccounted for by our model space, we extended our model fitting of the responses collected in the preliminary characterization of shape preferences to incorporate the product of two Gaussian functions, each of which represented a boundary feature in the curvature × angular position space (see Materials and Methods). For 60/61 cells, GOF was significantly improved by the inclusion of a second feature (partial F test, p < 0.01). However, the responses of curvature-tuned neurons were still better explained by curvature-based models (one-tailed t test, p < 0.01; Fig. 8A) and the negative correlation between threshold ratios and Fisher-transformed GOF values persisted even when conjunction selectivity for boundary features was considered (r = −0.28; p = 0.03; Fig. 8B). This suggests that the lower sensitivity of non-curvature-tuned neurons to shape information under occlusion cannot be explained on the basis of selectivity for conjunctions of boundary features.
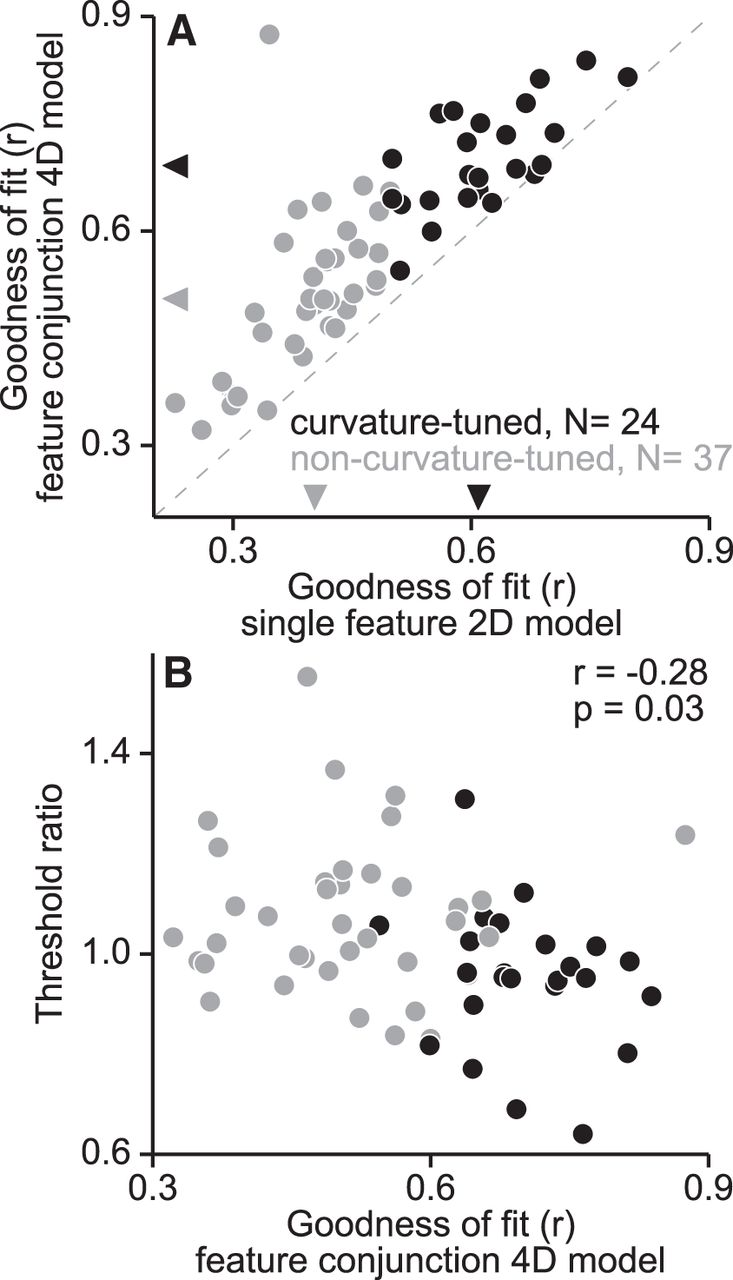
Relationship between selectivity for feature conjunctions and threshold ratios. A, Performance of contour-based 2D and 4D Gaussian models at describing V4 responses to shape stimuli. The 2D and 4D Gaussian models account for neuronal shape preferences in terms of selectivity for a single boundary feature (2D) or a conjunction of two boundary features (4D), each of which is described in a curvature × angular position shape space. The model's GOF is given by the coefficient of correlation between observed and predicted responses. For all but one neuron, shape preferences were better accounted for by the feature conjunctions model (partial F test, p < 0.01) suggesting that most V4 neurons are tuned to conjunctions of boundary features. Responses of curvature-tuned neurons (black symbols) were better explained by both of the curvature-based models than non-curvature-tuned neurons (gray symbols). Medians are indicated by black (0.61 for 2D; 0.69 for 4D) and gray (0.4 for 2D, 0.5 for 4D) triangles for curvature-tuned and non-curvature-tuned neurons, respectively. B, Threshold ratios versus GOF of the feature conjunction model are plotted for curvature-tuned (black) and non-curvature-tuned (gray) neurons. There was a significant negative correlation between these measures, suggesting that neurons with responses that were better fit by the feature conjunction model were more sensitive to shape information under partial occlusion.
Shape selectivity under partial occlusion
To better understand the differences between curvature-tuned and non-curvature-tuned neurons in the context of partial occlusion, we compared the time course of their responses and their selectivity (Fig. 9). For unoccluded shapes (Fig. 9A), the average responses to preferred stimuli were similar for both groups of neurons (black/gray lines show curvature-tuned/non-curvature-tuned neurons, respectively). In contrast, for intermediate levels of occlusion (Fig. 9B,C), responses of curvature-tuned neurons to their preferred stimuli were stronger than those of non-curvature-tuned neurons, reflecting a more gradual decline with increasing occlusion. At the highest occlusion levels (Fig. 9D), the responses of both groups of neurons to their preferred and nonpreferred stimuli were weak and comparable, indicating that these stimuli were no longer discriminable. The more gradual decline in the responses of curvature-tuned neurons to their preferred stimuli also resulted in stronger shape selectivity under partial occlusion (Fig. 9E–H). When the stimuli were unoccluded (Fig. 9E), the peak of average shape selectivity was similar in magnitude for the two groups. As occlusion increased, average shape selectivity decreased for both groups, but the decline in peak magnitude occurred more gradually for curvature-tuned neurons.
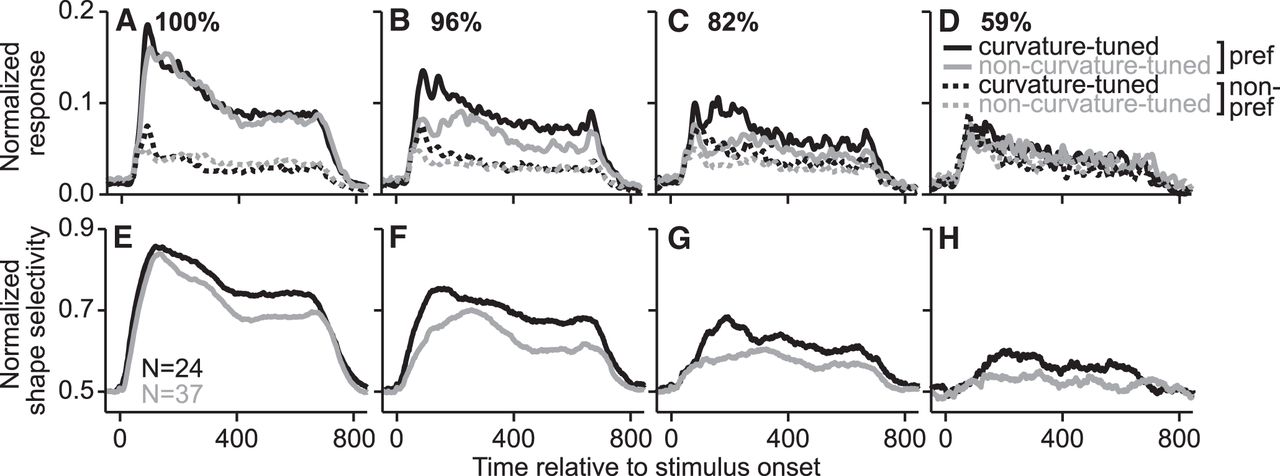
Population-level responses and shape selectivity under partial occlusion. A–D, Average normalized responses of curvature-tuned (black) and non-curvature-tuned (gray) neurons across occlusion levels (see Materials and Methods); data are shown separately for the preferred (solid) and nonpreferred (dashed) stimuli. For both neuronal groups, responses decreased with increasing occlusion level, but this occurred more rapidly for non-curvature-tuned neurons. E–H, Average shape selectivity for curvature-tuned and non-curvature-tuned neurons across occlusion levels (see Materials and Methods). For both neuronal groups, shape selectivity was comparable in magnitude for unoccluded stimuli and declined gradually with increasing occlusion level; this decline occurred more rapidly for non-curvature-tuned neurons. Note that not all neurons were tested at all occlusion levels (see Materials and Methods).
The data in Figure 9, E–H, suggest that shape selectivity peaks later for higher levels of occlusion. This delayed selectivity under occlusion may relate to object segmentation and amodal completion, that is, the interpolation of the occluded object boundary (see Discussion); we therefore examined these dynamics in more detail. For the example neuron in Figure 10A (same as in Fig. 2), shape selectivity for unoccluded stimuli and for stimuli under the lowest occlusion levels (96% and 99%) emerged early and reached half of its maximum value at ∼45 ms after stimulus onset. For intermediate occlusion levels (72%, 80%, and 90%), shape selectivity emerged more slowly and the time to half-maximum ranged from 89 to 209 ms after stimulus onset. At the highest occlusion level tested (59%), the peak of shape selectivity was unreliable and both neurometric and psychometric performance were close to chance (Fig. 2D). This systematic shift in the peak of shape selectivity is made more evident in Figure 10B, where values of shape selectivity (ordinate) have been normalized to the range 0–1 for each occlusion level. This trend holds across the population of neurons recorded. For curvature-tuned neurons (Fig. 10C,D), the time to half-maximum for unoccluded stimuli and for the highest occlusion level (45%) were 45 and 188 ms, respectively. For non-curvature-tuned neurons (Fig. 10E,F), shape selectivity at intermediate occlusion levels (72–96%) emerged significantly more slowly (randomization t test p < 0.05) and the time to half-maximum was 25–125 ms later than for curvature-tuned cells for 72%, 80%, and 96% occlusion levels. Overall, the selectivity profile of non-curvature-tuned neurons at intermediate occlusion levels resembled that of curvature-tuned neurons at high occlusion levels.

Time course of shape selectivity under partial occlusion. A, B, Data from an example neuron (same as in Fig. 2). A, Time course of selectivity for unoccluded shapes (black) and for shapes under different occlusion levels (colored lines). Selectivity for unoccluded shapes was strong and peaked soon after stimulus onset; selectivity weakened with increasing occlusion level and peaked later. B, Same data as in A normalized to the range 0–1 for each occlusion level. Because responses at the highest occlusion levels (59% and 45%) were weak and variable, normalized selectivity for those conditions are not shown. C, D, Average and normalized shape selectivity for all curvature-tuned neurons (n = 24). E, F, Data for all non-curvature-tuned neurons (n = 37). For both neuronal groups, the magnitude of shape selectivity decreased with increasing occlusion level and the time-to-half-maximum increased. For non-curvature-tuned neurons, normalized shape selectivity is not shown for the two highest occlusion levels tested. Note that not all neurons were tested at all occlusion levels (see Materials and Methods).
The above results suggest that the responses of curvature-tuned neurons are less susceptible to occlusion and that their shape selectivity is more robust under moderate to high levels of occlusion. These functional properties make curvature-tuned neurons well suited to contribute to the segmentation and discrimination of occluded objects, consistent with Gestalt hypotheses that propose a role for contour-based mechanisms for processing under occlusion (see Discussion).
Decision-related signals in V4
To perform this shape discrimination task, the primate brain has to compare the sensory representation of the test stimulus with that of the reference stimulus held in memory. We investigated whether the result of this comparison, which mediates the subject's behavioral choice, is signaled by V4 neurons. Indeed, in addition to encoding stimulus identity, many V4 neurons signaled the behavioral choice. Figure 11, A–C, shows the results from an example session. The neuron was not classified as curvature tuned, but was nevertheless shape selective: responses were strong when the test stimulus was the preferred shape (Fig. 11A) and weak when it was the nonpreferred shape (Fig. 11B). There was further differentiation in the responses to preferred stimuli (Fig. 11A): responses were stronger on trials ending in a leftward saccade (Fig. 11A, black, i.e., reporting a nonmatch) compared with trials ending in a rightward saccade (Fig. 11A, gray, i.e., reporting a match). Note that in Figure 11, A and B, responses on correct and error trials were pooled together; that is, the black and gray lines included data from all trials in which the animal chose left and right, respectively. Because this nonmatch selectivity was evident on both correct and error trials, it cannot be attributed to a specific combination of reference and test stimuli or to the novelty of the test stimulus (cf. Vogels et al., 1995; Ranganath and Rainer, 2003). For this neuron, the peak of nonmatch selectivity, defined as the area under the ROC curve (see Materials and Methods), was moderate (0.54; Fig. 11C) because the nonmatch signal was only evident in the responses to the preferred stimulus (Fig. 11A). Nonmatch selectivity emerged soon after stimulus onset (half-maximum was 181 ms) and well before saccade initiation, which occurred >400 ms later. Figure 11, D–F, shows results from another example session. This neuron, which was classified as a curvature-tuned neuron, responded more strongly on trials ending in a rightward saccade; this match selectivity was observed regardless of whether the test stimulus was the preferred or nonpreferred shape (Fig. 11D,E, respectively) and it emerged soon after the onset of the test stimulus (half-maximum was 179 ms; Fig. 11F). In our dataset, 30% of neurons (19/62) showed significant match/nonmatch selectivity (two-way ANOVA, p < 0.01, see Materials and Methods); these were approximately equally distributed between curvature-tuned and non-curvature-tuned neurons (8/24 curvature-tuned neurons; 11/37 of non-curvature-tuned neurons). We found both match-preferring and nonmatch-preferring neurons in each of the hemispheres recorded. Of the subset of neurons that showed decision-related activity, 7/19 responded preferentially on match trials (as in Fig. 11D–F); match-preferring neurons were also equally distributed between curvature-tuned and non-curvature-tuned neurons (3/24 and 4/37, respectively). Overall, we found no difference in the neuronal sensitivity to shape information between neurons that were match/nonmatch selective and those that were not.

Decision-related signals in V4 neurons. A–C, Data from an example neuron recorded during the behavioral task. A, Responses to the preferred shape were higher on trials ending in a leftward saccade (black, nonmatch trial) compared with those ending in a rightward saccade (gray, match trial). B, Responses to the nonpreferred shape were weaker and were similar for match and nonmatch trials. Responses were averaged across correct and incorrect trials and across all occlusion levels (see Materials and Methods). C, Time course of nonmatch selectivity (see Materials and Methods); this signal emerged early and peaked ∼200 ms after stimulus onset. D–F, Data from another example neuron. D, E, Responses to both the preferred and nonpreferred shapes were higher on trials ending in a rightward saccade (gray, match trial). F, Time course of match selectivity; this signal peaked first ∼250 ms after stimulus onset and then again shortly before saccade onset.
We observed decision signals in both curvature-tuned and non-curvature-tuned neurons. However, it is still possible that the shape-selective signals carried by curvature-tuned neurons are used to compute the decision signals, which are then propagated across V4 neurons indiscriminately. In this framework, shape selectivity in curvature-tuned neurons would emerge before decision signals in V4 at all occlusion levels. To pursue this further, we investigated the relative time course of shape selective signals in curvature-tuned and non-curvature-tuned neurons with that of decision-related signals in V4. The average time course of match/nonmatch selectivity for neurons with significant decision-related activity and for all the neurons recorded are shown in Figure 12, A and C, respectively. Across neurons that showed decision-related activity, match/nonmatch selectivity emerged well before saccade initiation: time to half-maximum ranged from 57 to 395 ms after test stimulus onset (median 178 ms). Figure 12B shows the temporal evolution of the match/nonmatch signal for different occlusion levels. For unoccluded stimuli (black), the match/nonmatch signal emerged almost immediately after stimulus onset: time to half-maximum was 107 ms. As occlusion increased, the onset of this signal became progressively more delayed, reminiscent of the delayed evolution of shape selectivity across occlusion levels (Fig. 10). Therefore, the time course of match/nonmatch selectivity follows that of shape selectivity, consistent with the notion that the shape-selective responses inform a perceptual decision, and the faster the decision is made, the sooner its signature (i.e., match/nonmatch selectivity) is manifested in V4. In Figure 12, D and E, we examine the relationship between the timing of match/nonmatch selectivity in neurons that show decision-related activity and that of shape selectivity in curvature-tuned and non-curvature-tuned neurons. At each occlusion level, we computed the average match/nonmatch selectivity across neurons that showed decision-related activity and found the time-to-peak of selectivity. We performed the same analysis for shape selectivity for curvature-tuned and non-curvature-tuned neurons, separately. For both groups of neurons, the time-to-peak of shape selectivity (gray) increased with increasing occlusion level. However, a striking ordinality is evident for curvature-tuned neurons (Fig. 12D): the time-to-peak for shape selectivity always precedes that for match/nonmatch selectivity in neurons that show decision-related activity. This was not the case for non-curvature-tuned neurons, for which the peak of shape selectivity precedes the peak of decision signals only at the lowest occlusion levels. Therefore, the relative dynamics of these signals support the notion that shape selectivity in curvature-tuned neurons emerges before V4 decision signals at all occlusion levels and could therefore contribute to their generation. This observation, together with the greater sensitivity of curvature-tuned neurons to shape information under occlusion, provides the first evidence that the responses of curvature-tuned neurons in V4 may contribute to the generation of decision signals related to shape judgments under partial occlusion.

Population-level analysis of decision-related signals. A, Average match/nonmatch selectivity (thick line) for all neurons with significant decision related signals (n = 19, see Materials and Methods); the SEM is also shown (thin lines). Neural signals related to the animal's upcoming behavioral choice emerged soon after stimulus onset, reaching a peak at ∼200 ms. B, Dynamics of match/nonmatch selectivity for unoccluded shapes (black) and for shapes under different levels of partial occlusion (colored lines) for the same subset of neurons as in A. For unoccluded shapes, match/nonmatch selectivity peaked early; this time-to-peak was systematically longer for higher occlusion levels. C, Dynamics of match/nonmatch selectivity for unoccluded shapes across three groups of neurons: all curvature-tuned neurons (black), all non-curvature-tuned neurons (gray), and all neurons (dotted); the size of each dataset is listed. D, E, Comparison of time-to-peak measurements for match/nonmatch selectivity and shape selectivity across occlusion level. This is shown separately for curvature-tuned neurons and non-curvature-tuned neurons. Match/nonmatch selectivity data are identical across panels; the size of each dataset is listed. For curvature-tuned neurons only, shape selectivity always peaked before match/nonmatch selectivity, suggesting that their responses may contribute to behavioral shape judgments.
Discussion
We investigated the relationship between neuronal and behavioral sensitivity to simple shapes under partial occlusion. We found that curvature-tuned neurons displayed high selectivity to shape information that declined gradually as a function of occlusion, resulting in lower neurometric thresholds that could account for animal behavior. Non-curvature-tuned neurons, although highly shape selective for unoccluded stimuli, were poorly sensitive to shape information even under minimal levels of occlusion. We also discovered that ∼30% of V4 neurons carried decision signals that reflected the animal's impending behavioral choice. These signals appeared soon after stimulus onset and emerged later for higher levels of occlusion. The temporal dynamics of these decision signals closely paralleled the dynamics of shape selectivity under occlusion in curvature-tuned neurons. Although more experiments are needed to demonstrate a causal link, our results are consistent with a framework in which partially occluded boundaries are processed by contour-based mechanisms and curvature-tuned V4 neurons contribute to this process and to their discrimination.
Only a few studies have related the sensitivity of single neurons to animal behavioral performance in the context of stimulus form (Vogels and Orban, 1990; Allred and Jagadeesh, 2007; Liu and Jagadeesh, 2008; Verhoef et al., 2010). To our knowledge, none of these studies made comparisons in the context of occlusion, which represents a major challenge to successful object recognition. Consistent with previous studies in other cortical areas, we found that some V4 neurons were as sensitive as, or more sensitive than, animal behavior. Because we conducted a detailed characterization of neuronal shape tuning in addition to concurrent behavioral and neurophysiological measurements, we were able to relate a model-based, functional classification of the neurons to how well they matched behavior. Using this protocol, we found that only the subset of V4 neurons classified as curvature-tuned (i.e., those neurons with responses that were well fit by a model of boundary curvature) were highly sensitive to the shape of occluded objects. This finding provides the first neurophysiological evidence in favor of the psychophysical theory that image segmentation and grouping, and the ensuing recognition and discrimination of shapes under occlusion are mediated by contour-based strategies. Gestalt psychologists have hypothesized that visual scenes are perceptually grouped into objects and that the component objects are detected and recognized by first grouping contours based on principles of similarity, proximity, continuity, common fate, symmetry, and convexity, etc. (Wertheimer, 1938). Human psychophysical results lend support to such a contour-based hypothesis (Mumford et al., 1987) and these strategies are popular tools for segmentation in computer vision (Leung and Malik, 1998). Our finding that curvature-tuned neurons are highly sensitive to shape information despite occlusions and that their shape selectivity emerges well before behavioral decision-related signals in V4 confirms the importance of contour-based mechanisms in processing visual scenes with occlusion.
To understand the role of non-curvature-tuned neurons in scene processing, we would need to understand what these neurons encode; this could explain why their responses decline rapidly under occlusion and what function they could serve in perception. Some of the non-curvature-tuned neurons we recorded were tuned to feature conjunctions (i.e., they responded only when the stimulus included a combination of preferred features), but many (e.g., Fig. 4) were poorly described by conjunctions of boundary features or other stimulus attributes including stimulus area, spatial frequency content, and mass-based orientation and elongation. As a group, non-curvature-tuned neurons were more narrowly tuned than curvature-tuned neurons, as quantified by the fraction of shape stimuli that evoked greater than half of the peak response (Fig. 13), perhaps suggesting greater complexity or higher dimensionality to their shape tuning. For example, responses in Figure 4A may be dictated by the medial axis structure of the shape rather than local contour curvature, because the stimuli that evoked the strongest responses all have a distorted, “kidney bean” shape. If medial axis structure is computed by finding the set of largest discs that just fit within the bounding contour (Blum, 1967), then this would require a spatially global computation between noncontiguous parts of the boundary, a process that could easily be disrupted by even the smallest occluding dots. Such a representational basis would predict a rapid decline of responses with minimal occlusion. We cannot test this possibility directly because our stimulus set was not designed to vary medial axis shape systematically. However, other studies have demonstrated selectivity for medial axis in IT cortex (Hung et al., 2012) and it is possible that V4 neurons are also tuned to this stimulus dimension. Such a neuron may be important for categorizing shapes based on their skeletal structure (Wilder et al., 2011). More generally, it is possible that different tuning dimensions in V4 may support different visual functions; therefore, it will be important to investigate shape encoding in non-curvature-tuned neurons in the context of different visual behaviors.

Relationship between neuronal sensitivity and shape-tuning width. Neuronal sensitivity given by the threshold ratio is plotted against tuning width (quantified as the fraction of shape stimuli that evoked more than half of the maximum response to all shapes). A large proportion of non-curvature-tuned neurons (gray symbols) were narrowly tuned: 62% of non-curvature-tuned neurons had a tuning width ≤ 0.05, compared with 25% for curvature-tuned neurons (black symbols), and the mean of the distribution for non-curvature-tuned neurons was significantly less than that for the curvature-tuned neurons (t test, p = 0.03). There was no correlation between tuning width and neuronal sensitivity across the population (r = 0.01, p = 0.95). It is noteworthy that, for non-curvature-tuned neurons, there was a statistically significant positive correlation between tuning width and neuronal sensitivity (r = 0.47, p < 0.01)—the opposite of what would be expected if preference for feature-conjunctions explained high susceptibility to the addition of occluders.
Shape selectivity under partial occlusion arises more slowly for all V4 neurons. This protracted buildup of selectivity is a unique observation: although a variety of stimulus manipulations, including contrast (Gawne, 2000), motion (Kawano et al., 1994), spatial frequency (Frazor et al., 2004), and distance from the RF center (Bringuier et al., 1999; Rossi et al., 2001), alter response latencies in visual cortex, we are unaware of any that alter the latency of selectivity but not the latency of the response. Unlike in these other cases, in which the altered response latency can be attributed to changes in feedforward drive, the latency of selectivity we observed is likely due to ambiguity in the incoming shape information imposed by occlusion, which is resolved over time with the concomitant emergence of selectivity. A purely feedforward model for the generation of shape selectivity in V4 (e.g., the contour-template model by Cadieu et al., 2007) cannot predict the delay in selectivity with increasing occlusion level, which requires recurrence in local circuits, recurrence between earlier cortical stages and V4 (Sugihara et al., 2011), or feedback from higher cortical stages. Recurrence will likely be a contributing factor for low and moderate levels of occlusion due to the long onset latency of IT responses (Kovács et al., 1995; Kiani et al., 2005; Brincat and Connor, 2006) compared with the onset of shape selectivity in V4. Recurrence has been previously hypothesized to contribute to neuronal selectivity for isolated shapes in IT cortex (Brincat and Connor, 2006). Here, we hypothesize that a similar circuit mechanism might contribute to the disambiguation of shape features under occlusion and the emergence of shape selectivity. Although more experiments are needed, we speculate that the gradual build of selectivity under occlusion may be the result of competition between neurons with shared input but different preferred stimulus features. In such a case, the initial feedforward visual drive, which is ambiguous due to occlusion, will evoke equal responses from all neurons. Over time, however, the representation of one feature may become strengthened as alternative possibilities are rejected based on contour grouping. Contour grouping is thought to proceed sequentially (Roelfsema, 2006) and is therefore time consuming and consistent with the delayed onset of selectivity that we observed. Regardless of mechanism, our results are consistent with the notion that neural signals at the level of V4 are akin to an inference signal that indicates the likelihood that the occluded shape contains the neuron's preferred feature. Because neuronal shape preferences are not altered by occlusion, the representation of occluded stimuli in V4 may signal the shape of the segmented, amodally completed, partially occluded boundary.
One limitation of the present study is that we did not probe how our macaque subjects perceived the combination of shape and dot stimuli, so it is possible that animals performed the task simply based on the visible portions of the occluded shape. However, the delay in selectivity we observed with increasing levels of occlusions is not evident for other shape degradation strategies, such as blurring the boundary or replacing the bounding contour with interrupted line segments that randomly deviate from tangential orientation (our unpublished observations). This supports the notion that the delay in selectivity pertains specifically to these occluded stimuli and their related percept. Another limitation arises from our random occluder placement strategy. Whereas this strategy was advantageous in several ways, we are unable to relate the changes in neuronal response to the specific occlusion of the critical feature for each neuron. We hope to address this in future experiments with multiple repetitions of fixed occluder placement and also confirm these results with a variety of occluders.
How might shape-encoding signals in V4 be used to perform the behavioral task? At the neural population level, match/nonmatch decision signals in V4 peaked 185–270 ms after stimulus onset, depending on occlusion level. This would suggest that a maximum of ∼235–320 ms (because we used a 100 ms ROC window) of neural signals from V4 and elsewhere in the brain are used to arrive at a behavioral decision. V4's contribution to the perceptual decision could be based on the selective pooling of the most sensitive neurons, as was suggested previously (Raiguel et al., 2006; Gold et al., 2010). Because curvature-tuned neurons maintained their selectivity across wider ranges of occlusion, and because their peak selectivities emerge before decision signals at all levels of occlusion, it is plausible that their responses are the foundation of the perceptual decision signals.
Many studies have examined neuronal responses in various brain regions while animals compared sequentially presented stimuli (Haenny et al., 1988; Maunsell et al., 1991; Miller et al., 1991; Eskandar et al., 1992; Miller and Desimone, 1994; Vogels et al., 1995; Miller et al., 1996; Wallis and Miller, 2003; Zaksas and Pasternak, 2006; Woloszyn and Sheinberg, 2009; Hayden and Gallant, 2013). Our results are most consistent with findings in inferotemporal, prefrontal, and premotor cortices, in which both match-preferring and non-match-preferring neurons have been reported, and with the findings of a feature-based attention study in V4 (Mirabella et al., 2007). Our results are in contrast to findings from visual area MT (Zaksas and Pasternak, 2006), in which most neurons are nonmatch preferring, and to previous reports of “match enhancement” in V4 when the stimulus in the RF matches a previously presented stimulus or a sought feature (Haenny et al., 1988; Maunsell et al., 1991; Bichot et al., 2005; Ogawa and Komatsu, 2006; Hayden and Gallant, 2013). Match/nonmatch signals in our study emerged and peaked <200 ms after stimulus onset for unoccluded shapes, earlier than similar signals reported in frontal cortices (Wallis and Miller, 2003) and decision-related “match suppression” signals in IT cortex (Woloszyn and Sheinberg, 2009). The dynamics of the match/nonmatch signals that we observed are therefore consistent with the notion that decision signals are present in V4 before PFC or IT, raising the interesting possibility that V4 participates in the generation of these behavioral choice signals.
Footnotes
This work was funded by the National Institutes of Health (National Eye Institute Grant R01EY018839 to A.P., Vision Core Grant P30EY01730 to the University of Washington, and Office of Research Infrastructure Programs Grant OD010425 to the Washington National Primate Research Center). We thank Wyeth Bair, Dina Popovkina, and Greg Horwitz for helpful discussions and comments on the manuscript and Brittany Bushnell and the Bioengineering group at the Washington National Primate Research Center for technical support.
The authors declare no competing financial interests.
- Correspondence should be addressed to Anitha Pasupathy, Ph.D., Department of Biological Structure, University of Washington, 1959 N.E. Pacific Street, Box 357420, HSB G520, Seattle, WA 98195. pasupat{at}uw.edu


