

Article Figures & Data
Figures
- Figure 1.
Schematic description of the model and its relation to in vivo experimental data. A, Spatial distribution of the 73 glomeruli activated by the 72 odors used in this work. The 73 glomeruli constitute the input layer to the MC circuitry. B, A plot of 3-D representation of the mitral and granule cells within the bulb model. The MCs (total number 500) are indicated by the red pyramids, whereas GCs (total number 10,000) are indicated by the small green spheres. C, The feedback and feedforward connectivity among the MCs and GCs in the OB model. MCs (triangles) receive excitatory inputs from glomeruli (large green circles). The MCs and GCs (solid blue circles) are connected by reciprocal dendrodendritic synapses; one GC connection is shown as an example. The GCs receive the excitatory inputs from the MCs (red arrow), and MCs are inhibited by GCs (blue arrow). D, Reciprocal synapses mediate interactions between mitral cells and granule cells in the OB (see text). A and B were taken from Yu et al. (2013).
- Figure 2.
Relation of the model to development of lateral inhibition. A, Raster plots of the 500 MCs and the 10,000 GCs connected to those MCs during presentation of the odorant o-ethyl phenol (o-Eph); the red histogram represents the intensity of the synaptic input from glomeruli to MCs. B, Schematic representation of balanced and unbalanced excitation and inhibition (inhibition dominated) in the MC–GC circuit. Three activated middle MCs (solid black triangles) receive strong input from glomeruli (solid deep green color); through back-propagating APs in their lateral dendrites, they distribute excitation (red) through the reciprocal synapses, activating lateral inhibition to the surrounding MCs through the reciprocal inhibitory synapses. This mode of excitation and inhibition is balanced, and these MCs are called MC type I. The activated GCs (small blue spheres) deliver lateral inhibition to other surrounding MCs with weak or no excitatory inputs, making their reciprocal synapses unbalanced. These MCs are called MC type II. MCs that do not receive lateral inhibition are MC type III (see text). C, Analysis of the OB model with 72 odorant inputs: the average values of the excitatory and inhibitory weights of the reciprocal synapses are plotted against each other for reciprocal synapses in strongly activated MC I (red); weakly activated and laterally inhibited MC II (green), and distant MC III (blue) beyond lateral inhibition.
- Figure 3.
Relationship between the preset synaptic peak conductance and actual synaptic weight. A, averaged inhibitory synaptic weight ginh versus preset inhibitory peak conductance ginhMax for a fixed excitatory peak conductance (gexMax = 0.5 nS). B, averaged excitatory synaptic weight gex versus preset inhibitory peak conductance ginhMax for a fixed excitatory peak conductance (gexMax = 0.5 nS). C, averaged inhibitory synaptic weight ginh versus preset excitatory peak conductance gexMax for a fixed inhibitory peak conductance (ginhMax = 3 nS). D, averaged excitatory synaptic weight gex versus preset excitatory peak conductance gexMax for a fixed inhibitory peak conductance (ginhMax = 3 nS).
- Figure 4.
The spatial firing rate pattern of 500 MCs in response to o-ethyl phenol. A, Patterns in the first seconds of odor exposure, before learning. MCs nos.356–360 have firing rates ∼40–50 Hz in response to the stronger inputs, whereas surrounding MCs, with weaker input signals, have much lower firing rates (purple arrows). Correspondingly, the MCs receiving weak input that are away from the strongly activated MCs also show relatively low firing rates (blue arrow), which are almost as low as the spontaneous firing rate (∼4 Hz) of MCs with no input. The bottom panel shows the spatial firing rate pattern of 10,000 GCs. MCs nos.356–360 have long lateral dendrites that cover the lateral connection to the GCs within no.4120–10,000, and some within no.0–20. A model MT cell is plotted in inverted black triangle, with lateral dendrite covered the range of GCs from ∼415 to 10,000, and the glomerulus plotted in green circle was activated by the input odor. B, Patterns in the 10th seconds, after learning. The strongly activated MCs have reduced the firing rates for strong inputs because of the lateral inhibition, while surrounding MCs nos. 210–500 are strongly suppressed by the lateral inhibition. Some MCs with weak inputs within this range even stop firing (purple arrows) because of the strong lateral inhibition effect. However, MCs with weak inputs out of this range display relatively enhanced responses (blue arrow) because of very weak feedback inhibition and no lateral inhibition. The GC displays a decreasing pattern of activity in the region surrounding the site where MCs are strongly activated.
- Figure 5.
Network processing properties. The spatial firing rate pattern of 500 MCs in response to odors with similar (A–C) and different (D–F) molecular structures before (top) and after (bottom) the learning process. The odors are 6OH for A, 7OH for B, 8OH for C, K7-1 for D, guaiacol for E, and piperitone for F. Purple arrows indicate MCs with a response strongly affected by lateral inhibition.
- Figure 6.
The response dynamics of the MCs develops from intense to sparse. A, Raster plot of spike timings from MC (top) and GC (bottom) during a typical simulation; MC spiking evolved from intense to sparse as a function of time in response to the odor octanal (sniff frequency was randomly set in a range from 2 to 5 Hz). Note that MCs 440–470 received strong intensity input. During the first 5 s, the responses of MCs were dense in each sniff cycle, whereas both their firing rates and duration declined as the network dynamics evolved during the learning process. Bottom, GC spiking evolved from random firing to be synchronized dense oscillations, then to sparse oscillations over time. B, Sniff-triggered transient responses of MCs (400–500) at different time windows during odor learning. C, The MC sparseness as a function of time for the simulation showed in A and B, performed with synaptic inhibitory peak conductance ginhMax = 3 nS and excitatory peak conductance gexMax = 0.5 nS. D, Time evolution of the average excitatory weight gex for the MCs receiving strong inputs (red), and for the MCs receiving weak or no inputs (black). E, As in D but for the average inhibitory weight. F, The average peak inhibitory vs excitatory weight reached in MC receiving strong (red) or weak (black) inputs.
- Figure 7.
Analysis of the evolution of sparseness in the MC network response. A, Sparseness as a function of time for different values of synaptic inhibitory peak conductance ginhMax and a fixed synaptic excitatory peak conductance (gexMax = 0.5 nS). Note that except for ginhMax = 0, the sparseness of the MC response always self-organizes into a high sparseness level as a function of time. The fitting curves could be described by the classic logarithmic function as follows:
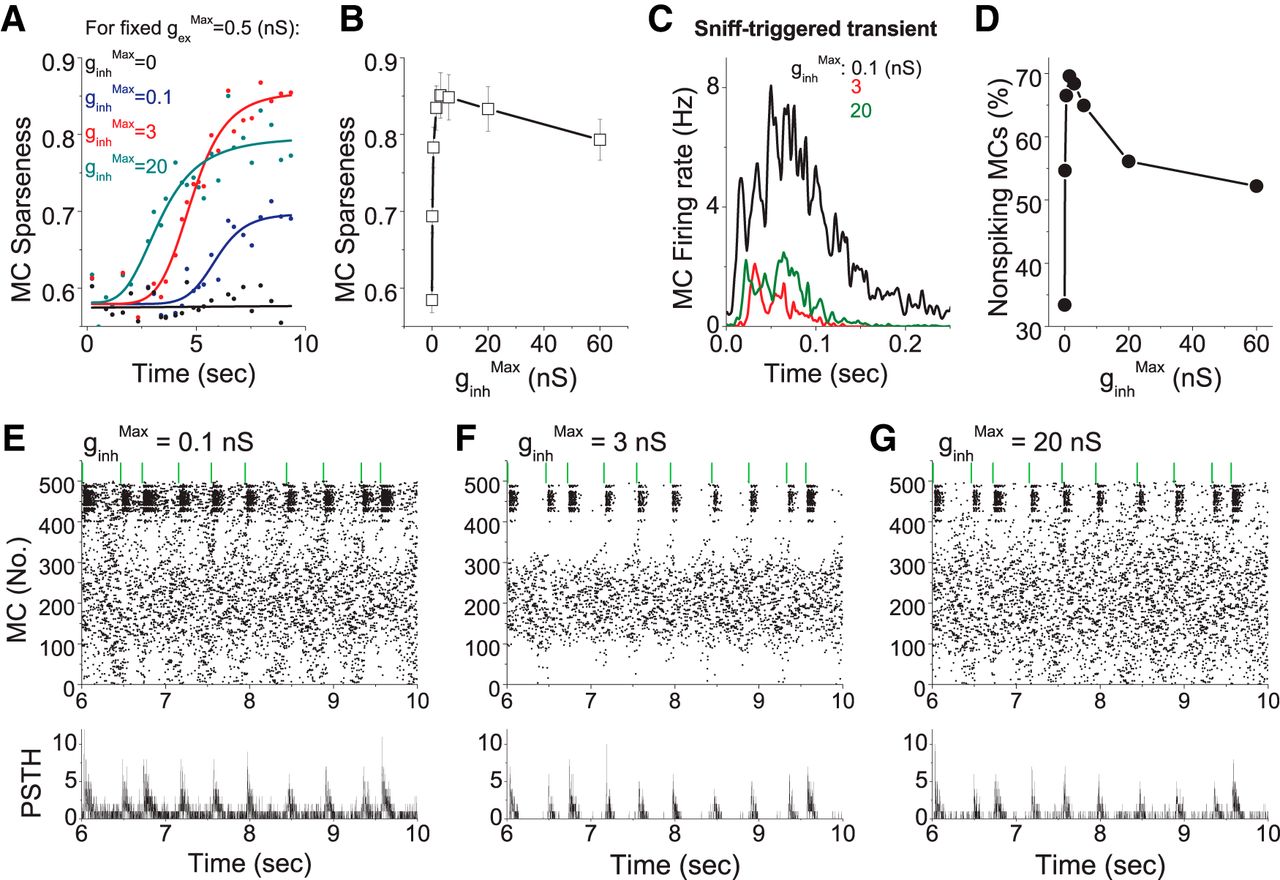
 . B, Sparseness level of the MC network response as a function of ginhMax for gexMax = 0.5 nS. The sparseness level reaches the highest value for ginhMax = 3nS. C, Sniff-triggered average MC firing rate after learning (during the 10th seconds of simulation) for three cases of ginhMax = 0.1, 3 and 20 nS respectively. D, Percentage of nonspiking MCs in the network for each sniff cycle after learning. The maximum value is for ginhMax = 3 nS. E–G, MC raster plot (top) and PSTH (bottom) during the last 4 s of simulation for ginhMax = 0.1 nS (E), 3 nS (F), and 20 nS (G).
 - Figure 8.
Sparseness as a function of the ratio between the dendrodendritic synaptic actions. A, The averaged correlation coefficient of the MC network response as a function of time for different values of ginhMax and a fixed gexMax = 0.5nS. Note that except for ginhMax = 0, the MC network correlation level always declines as a function of time. The curves are described by the classic logarithmic function (Fig. 6, legend). B, The average correlation coefficient of the MC network response as a function of time for different values of gexMax for a fixed ginhMax = 3nS. C, The MC network correlation level as a function of ginhMax (black) and gexMax (red). There exists an optimal ginhMax, as well as an optimal gexMax for which the network correlation level reaches the lowest level. D, The MC network correlation level as a function of network sparseness level. E, The MC network sparseness level as a function of reciprocal inhibitory weight to excitation weight ratio ginh/gex for the cases of different ginhMax with a fixed gexMax = 0.5nS and different gexMax with a fixed ginhMax = 0.3 nS. The network sparseness level is modulated by the ginh/gex ratio. F, The MC network correlation level as a function of reciprocal inhibitory weight to excitation weight ratio ginh/gex for the cases of different ginhMax with a fixed gexMax = 0.5nS and different gexMax with a fixed ginhMax = 0.3 nS. The network correlation level is modulated by the ginh/gex ratio.
- Figure 9.
Similarity reduction in odor representation promoted by network learning. A, The similarity of the MC network responses to different odor inputs can be quantified by calculating the average value of the correlation coefficients of the responses to each odor input with the other 71 odor inputs. The 72 odor network responses were divided into three groups: odors with >2% of the mitral cells activated with a strong input (red), odors with <2% of MCs activated by a strong input (green), and odors with no strong inputs (blue). B, Plots showing the reduction in similarity of network response after the learning process for the three groups. C, D, Similarity of response for odors with a value of input similarity lower (C) or higher (D) than 0.1.


