

Article Figures & Data
Figures
- Figure 1.
A, B, Target cells of RCAS infection in Ctv-a mice. Arrows denote RCAS-EGFP-infected mouse cells (adjacent to injected RCAS-producing DF-1 cells) double-positive for GFP and (A) NG2 or (B) OLIG2. Scale bars: A, B, top left, 100 μm; A, top right, 50 μm; B, top right, 25 μm. C–I, K-RAS+AKT-induced astrocytic gliomas from OPCs. Loss of Arf or Ink4a-Arf resulted in (C) increased incidence [wild type (wt) vs Ink4a-Arf−/−, p = 0.0172; wt vs Arf−/−, p = 0.0024; Ink4a−/− vs Ink4a-Arf−/−, p = 0.0511; Ink4a−/− vs Arf−/−, p = 0.0096; Arf−/− vs Ink4a-Arf−/−, p not significant], (D) high-grade tumors, and (E) decreased survival (Kaplan-Meier: wt vs Arf−/−, p = 0.002; wt vs Ink4a-Arf−/−, p = 0.0124; Ink4a−/− vs Arf−/−, p = 0.0064; Ink4a−/− vs Ink4a-Arf−/−, p = 0.0271). F, G, H&E stained tumors. H, I, Immunostainings for HA.
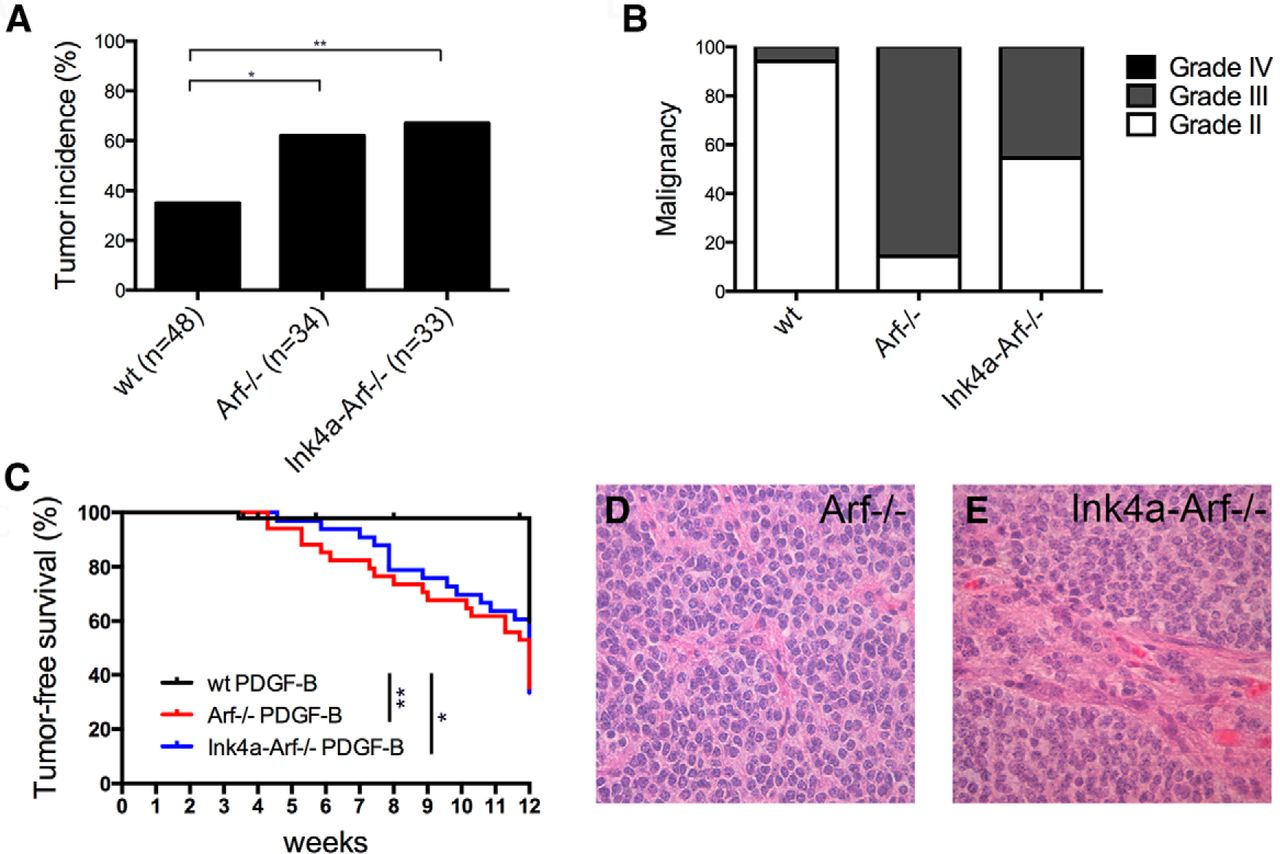
- Figure 2.
PDGF-B-induced gliomas in Ctv-a mice. A–C, Loss of Arf or Ink4a-Arf caused (A) increased tumor incidence [wild type (wt) vs Ink4a-Arf−/−, p = 0.0071; wt vs Arf−/−, p = 0.0249], (B) increased malignancy, and (C) decreased survival compared with wt mice (wt vs Arf−/−, p = 0.002; wt vs Ink4a-Arf−/−, p = 0.0124). D, E, H&E stained tumors.
- Figure 3.
Glial marker expression in OPC-derived KRAS+AKT and PDGF-B tumors. A–G, Representative pictures of immunostainings for (A) nestin, (B) GFAP, (C) vimentin (insets show expression in ependymal and Bergmann glial cells in the normal surrounding tissues, respectively), (D) CD44, (E) YKL40, (F) PDGFRα, and (G) OLIG2 in tumors from Ctv-a Arf−/− and Ctv-a Ink4a-Arf−/− mice induced by K-RAS+AKT or PDGF-B.


