

Abstract
The NMDA receptor plays a key role in synaptic plasticity and its disruption leads to impaired spatial representation in the CA1 area of the hippocampus, with place cells exhibiting larger place fields (McHugh et al., 1996). Place fields are defined by the spatial and nonspatial inputs of a given place and context, by intrinsic network processes, such as phase precession, but also by the matching of these inputs to a pre-existing spatial representation. Larger place fields may be a consequence of spatially widened firing upon a single crossing of a place field, or of increased variability in place field positions across traversals. We addressed this question by monitoring CA1 place cell activity, with tetrodes, in control and KO mice lacking the NMDA receptor in this region. In individual crossings of the field, we found no difference between genotypes in place field size; the larger, overall place field size turns out to be a consequence of jitter across trials. We suggest that this jitter reflects a deficit in the matching of current spatial inputs to the stored spatial representation of the track. This is supported by the finding that deficits in place field size and spatial information are rescued by extensive exposure of the mouse to the track, which may echo an increased influence of memory retrieval processes in CA3 on firing in CA1.
Introduction
As the output station of the hippocampus, subfield CA1 is thought to provide the brain with a spatial “cognitive map,” expressed by the activity of place cells, with their highly specific location-dependent firing (Wilson and McNaughton, 1993). Place fields are plastic and influenced by a wide range of context and experience-dependent factors, indeed, they reorganize upon changes to the environment (Muller and Kubie, 1987), behavioral context (Eichenbaum et al., 1999), and running direction (McNaughton et al., 1983; Battaglia et al., 2004).
The NMDA receptor (NMDAR) is critically involved in long-lasting synaptic plasticity (Bliss and Collingridge, 1993), oscillatory network dynamics (Whittington et al., 1995), and the formation of a proper spatial representation in CA1 (McHugh et al., 1996). Tsien et al. (1996b) developed a knock-out (KO) mouse line lacking the NMDAR-subunit 1 (NR1) in pyramidal neurons of CA1, which, consequently, do not exhibit LTP and is likely to impair the integration of inputs arriving to CA1 from CA3 and the entorhinal cortex (Cabral et al., 2014). A classic measure for the quality of hippocampal spatial representation is the size of place fields: the smaller the field, the more accurately the position of the animal can be reconstructed from neural populations. Indeed, in NR1-KO mice, place fields are larger and place cells with overlapping place fields show less coherence (McHugh et al., 1996).
Place field size is determined jointly by the spatial and nonspatial (e.g., idiothetic) inputs, and by cellular and network processes, defining the temporal boundaries of a firing episode. However, an important question is whether place field size increase in NR1-KO mice is caused by the spatial widening of this “canonical place field”, or whether it results from increased variability in the position where the cell fires, at each place field traversal. These two possibilities depend on different processes: the latter one relies mainly on the integration of inputs with the pre-existing spatial representation. The former option, an increase in the length of the portion of the track on which a place cell is firing in any given passage, possibly involves a modified integration entorhinal cortex inputs (McNaughton et al., 2006), which may support by themselves place field generation (Brun et al., 2008).
To disambiguate between these two possibilities, we recorded CA1 place cell activity in control and NR1-KO mice running on a circular track and analyzed spatial properties on a trial-by-trial basis. We show that these animals have larger place fields, when calculated over the entire session, but not when place fields are analyzed on a single-trial basis. The increased session place field size stems from greater variability in firing maps across trials. This variability increase subsided with increasing experience on the track, such that some of the impairments were rescued toward the end of the recording. In addition, KO mice failed to express plastic changes affecting place fields in control (CTR) mice over the course of a session, such as a reduction of place field size and a precession of the place field's center of mass.
Materials and Methods
Subjects.
Male mice lacking the NMDAR1 gene in the CA1 subregion of the hippocampus, originally created at MIT (Cambridge, Massachusetts; Tsien et al., 1996b), were inbred at and obtained from UPMC Univ Paris 06. The KO is specific to the CA1 subfield until 2.5 months of age (Fukaya et al., 2003). CTR mice were “floxed” littermates of KOs, not carrying the NR1 deletion. Animals were maintained on a reversed light/dark cycle (lights on/off at 20:00 h/08:00 h), single-housed and food restricted to 90% of their free-feeding weight. All experiments were performed in accordance with Dutch National Animal Experiments regulations and approved by the Committee on Animal Experiments of the Universiteit van Amsterdam. Fifteen mice (8 KO and 7 CTR), were used for electrophysiological experiments, and implanted at the age of 41 ± 5 d, weighing ∼20 g. All mice were between 51 (minimum) and 77 (maximum) days of age during the recording phase, an age range that delimits the mutation to the CA1 region (Fukaya et al., 2003). At all times, one KO and one CTR mouse were studied in parallel, with recording sessions taking place in immediate succession, with all procedures counterbalanced by genotype. Before these experiments, animals were used for another behavioral task (Cabral et al., 2014).
Apparatus.
Training took place in a custom-made circular track with a 30 cm radius. The track was made out of aluminum and was 7-cm-wide and with 5-cm-high walls. The experimental room had black curtains at the walls with large geometrical cues on the four sides, and 40 W light bulbs at each corner.
Behavioral protocol.
Mice ran on the circular track, which was interrupted at one point by a barrier, so that mice had to shuttle back and forth alternating clockwise and counterclockwise directions and collect sucrose pellets placed at each end. Each session comprised a maximum of 30 trials, 15 in each direction. Each mouse ran two daily sessions (1 in the morning, and 1 in the afternoon) over the course of 5 d and each session was flanked by two 20 min periods of rest, in which the animal was placed in his home cage in the center of the circular track, surrounded by a black cardboard enclosure, while baseline electrophysiological signals were recorded. The first recording session was also the first time the animals were exposed to the environment.
Trials in which mice changed direction during running were excluded from analysis.
Drive, surgery, and tetrode positioning.
Six independently moveable tetrodes (polymide-insulated,13 μm diameter nichrome wire, Kanthal) were loaded into a custom-made, ultralight (∼1,8 g) “Lantern” Microdrive (Battaglia et al., 2009), their impedances were lowered to 0.5–1 MΩ, using AuCN3 for gold plating, and were implanted over the dorsal hippocampus (AP: −2.0 mm, ML: −2.0 mm). In the week after surgery, tetrodes were gradually lowered until they reached the CA1 pyramidal layer. Tetrode position was adjusted between recording sessions to maintain them in the CA1 pyramidal layer, which was identified by the presence of strong sharp-wave ripple events and the presence of spike trains fired in bursts.
Histology.
After recordings, electrolytic lesions were made at the recording sites by passing 20 μA of current for 10 s through one lead of each tetrode. After perfusion with formaldehyde (buffered in PBS, pH 7.4) coronal brain sections (40 μm) were cut on a vibratome and Nissl-stained for verification of tetrode tracks and end points. Only animals with clear lesions or presence of tetrode tracks in the CA1 pyramidal layer and/or clear sharpwave-ripple complexes and ripple-modulated cell firing were included in the analysis.
Data acquisition.
Tetrode signals were unit-gain amplified by the headstage pre-amplifiers (Neuralynx) and relayed to amplifiers for single-unit and local field potentials (LFP) recordings. The signal was amplified 2000 times, bandpass filtered (0.6–6.0 kHz for single-unit; 1–475 Hz for LFP), acquired and time-stamped. For single units, 1 ms of signal was acquired at 32 kHz sampling rate every time the signal exceeded a manually selected threshold; LFPs were sampled continuously at 2 kHz. One of the six tetrodes was targeted to a location devoid of single unit signals and near the area of interest, (in the corpus callosum or its close proximity) and was used as a reference.
Single-unit data were preprocessed with KlustaKwik (Harris et al., 2000) for automated spike clustering. Spike sorting results were manually refined using Klusters (Hazan et al., 2006).
Mouse position and orientation on the maze were extracted from video footage (using the full animal silhouette as filmed by a camera placed directly on top of the maze) with Ethovision XT image analysis software (Noldus), which was synchronized with the electrophysiology data acquisition system. All data used for analysis were from periods in which the animal was moving at speeds exceeding 3 cm/s. Unless otherwise indicated, the bin size used was 4 cm.
Neuron classification.
Clusters with >0.5% spikes during the first 2 ms of the interspike interval (refractory period), or a firing rate during the run period of the recording session lower than 0.25 Hz were excluded from analysis (24.7% and 26.4% of CTR and NR1-KO units were excluded, respectively). The remaining clusters were separated in putative interneurons and pyramidal neurons, using a fuzzy-clustering algorithm (Fuzzy Clustering and Data Analysis Toolbox, http://www.abonyilab.com/software-and-data/fclusttoolbox), based on the firing rate, the mean of the autocorrelogram and the initial slope of valley decay (ISVD). The ISVD was calculated as follows:
 where Vv is the most negative value (valley point) of the spike waveform, V0.26 the voltage at 0.26 ms after Vv and APV the peak to valley amplitude (Lansink et al., 2010). Only neurons that were included in the pyramidal or the interneuron cluster with >70% certainty of belonging to one of them were used for analysis (see Fig. 2B).
Place field analysis.
Position on the circular track was linearized and place field maps were constructed by dividing the number of spikes falling within a 4 cm bin along the track by the total time spent within each bin. The resulting firing map was smoothed using an 8 cm moving window. Place fields were defined as the spatial regions where firing exceeded a threshold of one-third of the maximum firing rate. Place fields larger than one bin were included in the analysis. All analyses were repeated using a smaller bin size (2 cm), which yielded similar results.
Because place cells are known to fire differently depending on running direction (McNaughton et al., 1983), clockwise and counterclockwise runs were analyzed separately.
Unless stated otherwise, normalized distance was calculated as distance from departure divided by the maximum distance recorded in that session.
Trial-by-trial analysis.
For each cell, trials with less than five spikes were excluded from analysis.
Trial-by-trial place field changes.
To investigate how place fields evolve across a session (see Fig. 4), the session-wide place fields were computed as explained above. Similarly, the trial-by-trial place fields were found, and those intersecting a session-wide place field were retained for analysis.
Population analysis.
For the construction of population firing rate maps (see Fig. 5A), the linearized firing maps in both clockwise and counterclockwise runs were stacked and sorted according to the spatial order of the bin of maximum firing of each cell in counterclockwise runs. This population matrix was then used to calculate the spatial matrix of cross-correlations (see Fig. 5B): for each bin i, the population vector for runs in one direction was taken and correlated (using Pearson's correlation coefficients) with the population vector of bin i of runs in the opposite direction. Bins on the positive diagonal correspond to bins situated at the same distance run from the beginning of the trial, whereas bins on the negative-diagonal correspond to bins situated at the same physical location.
The cross-correlation of the population vector as a function of distance (see Fig. 5D) was calculated as the Pearson's correlation coefficient of the population vector in one bin with all other bins, for both the “same-distance” condition (population matrix for clockwise and counterclockwise trials calculated in the running direction) and the “same (physical) location” condition (population matrix in clockwise runs mirrored, such that the same bin corresponds to the same physical location in both directions). In the case of same-distance, negative lags correspond to shorter distances from departure in clockwise compared with counterclockwise runs and in the case of same-location, positions occupied in clockwise runs preceding those in counterclockwise runs.
Results
Single-trial place fields of NR1-KO mice have similar size as those of WT mice
We recorded the activity of 405 cells from CTR and 386 cells from NR1-KO mice. After exclusion of units that did not fulfill the criteria (see Materials and Methods), we clustered units into putative pyramidal neurons (n = 273 and 242; for CTR, n = 4; and NR1-KO, n = 4 mice, respectively; 10 CTR pyramidal neurons were further excluded from analysis for not having enough spikes on the track; except otherwise mentioned, 263 CTR and 242 NR1-KO pyramidal neurons were included for analysis) and interneurons (n = 32 and 42; see Materials and Methods; Table 1). To quantify unit isolation we have used the lRatio measure (Schmitzer-Torbert et al., 2005); there was no significant difference in isolation quality for pyramidal cells (CTR: L-Ratio = 117 ± 115; KO: L-Ratio = 128 ± 108.; Kolmogorov–Smirnov p = 0.1). Interneurons of the two genotypes had similar firing rates during run (mean ± SEM: CTR = 6.9 ± 1.1 Hz; NR1-KO = 9.5 ± 1.2 Hz).
Summary of recorded units per mouse and genotype
As expected, most pyramidal neurons showed place-related activity across the entire session (Fig. 1A; 68.4% of CTR and 52.9% of NR1-KO cells had two or less place fields). In agreement with previous results (McHugh et al., 1996), NR1-KO cells showed a lower spatial resolution, with place fields of increased size (Fig. 1B,C; t test: p < 0.001) and more place fields per place cell (data not shown; mean ± SEM: CTR = 2.4 ± 0.06, NR1-KO = 2.8 ± 0.07; t test, p < 0.001). When analyzing place field sizes on a trial-by-trial basis, however, we found no difference between genotypes (Fig. 1D; t test, n.s.). This suggests that the increased-session place field size, observed in NR1-KO mice, is a consequence of between-trial variability: if a given cell fires with the same spatial precision on each run through its place field, but less reliably at the same place across trials, the resulting session place field will be broader.

NR1-KO single-trial PFs have similar size as CTR fields. A, Clockwise (left) and counterclockwise (right) PF examples of a CTR (top) and a NR1-KO (bottom) place cell. Numbers at bottom right are maximal firing rates. B, Example PFs of a CTR (left) and a NR1-KO place cell. Rows show the linearly binned firing rate for each trial. Only trials running in the same direction are shown. Hot colors indicate the firing rate normalized to that trial's maximum (color bar as in A). Gray curve depicts the session's average. C, PF size computed for the entire session: NR1-KO place cells have larger PFs (t test, ***: p < 0.001). D, Trial-by-trial PF size: no difference between genotypes was found (t test, n.s.).
Differences in locomotion speed could influence such parameters as place field size. NR1-KO mice did show a higher per-trial average speed (CTR: 14.1 ± 0.17 cm/s vs NR1-KO: 15.8 ± 0.17 cm/s; t test, p < 0.01). Speed may influence place field size by increasing place cell average activity and the frequency of theta oscillations: because the limits of a place field will be determined by the completion of a theta phase precession cycle (∼1 theta cycle), higher speeds should lead to smaller place fields (Geisler et al., 2007). To exclude the influence of speed, we repeated the per trial place field size analysis using only trials with an average speed within the 20th and 80th percentiles of CTR mice, which did not change the results presented in Figure 1D (place field size, mean ± SEM: CTR = 41.8 ± 1.02, NR1-KO = 43.9 ± 0.9; t test, n.s.).
Increased variability in NR1-KO spatial representations between trials
To test the hypothesis brought forward in the previous section, we calculated the absolute value of the distance between the bin of maximum firing rate in each trial to that of the session average, yielding a “jitter” value for each trial and place cell (Fig. 2A,B). NR1-KO place cells showed significantly higher jitter than CTR (t test, p < 0.01). We also conducted a similar analysis by calculating the Pearson's correlation between each trial's spatial firing map and the session average (Fig. 2C). This analysis has the advantage of taking the entire firing map into account rather than only the location of peak firing. In agreement with the jitter results, we found that NR1-KO place fields showed a decreased correlation (t test, p < 0.01), further supporting the hypothesis that the increase in session place field size is a consequence of increased intertrial variability.

NR1-KO place cells display more spatial jitter than CTR cells. A, Example PF of a CTR (top) and a NR1-KO (bottom) place cell across all trials of a session, in the same direction. Gray curve depicts the session's average. The bin of maximum firing rate in each trial is marked with a blue dot. The jitter across trials can be gauged from the left- and rightward shifts of the blue line. B, Distribution of the average jitter between bin of maximum firing rate of each trial with respect to the session average per place cell (t test, p < 0.001).C, Distribution of the average Pearson's correlation coefficient between each trial's firing map and the session average per place cell (t test, p < 0.001). D, Average jitter across trials: NR1-KO showed a significant decrease in jitter along the course of a session (linear regression, *p < 0.05). CTR showed a similar trend, which was however not significant. [ANOVA, p(genotype) < 0.001, p(trial) < 0.005, p(interaction) n.s]. Jitter values >50 cm were removed from analysis to exclude spurious observations. E, Average Pearson's correlation across trials: both genotypes showed an increase along the course of a session [linear regression: *p < 0.05, **p < 0.01; ANOVA, p(genotype) < 0.001, p(trial) < 0.001, p(interaction) = n.s.]. F, Average jitter value per mouse. G, Average correlation values per mouse.
The examples in Figure 2A seem to suggest that the jitter decreases as the session progresses. Hence, we averaged the jitter per trial across all sessions (Fig. 2D): both genotypes showed a negative trend, which however reached significance only for NR1-KO (simple linear regression, SLR; p < 0.05). There was, in addition, a genotype effect (ANOVA, p < 0.001), as jitter was lower for CTR (Fig. 2B). Similarly, we averaged Pearson's R along trials and across sessions (Fig. 2E). Both genotypes showed a significant increase in the correlation along a session (SLR, CTR: *p < 0.05; KO: **p < 0.01; ANOVA: p (genotype) <0.001). These results show that in both cases, trial-by-trial variability decreases with trial or experience on the track within a session. This effect was more salient in NR1-KOs, as suggested by the jitter and Pearson's correlation measures, suggesting that CTR place cells may reach an asymptotic value earlier on. Fig. 2F,G display, respectively, the jitter and correlation values for CTR and NR1-KO mice, showing that this effect is present across mice. We correlated the jitter values between pairs of simultaneously recorded neurons across trials, to investigate whether the deviation of place field firing reflects individual processing errors, or rather network errors. We found that, in both genotypes, there was a significant (albeit weak) correlation between jitter values, favoring the latter possibility (average Pearson's R, mean ± SEM: CTR = 0.026 ± 0.005, NR1-KO = 0.022 ± 0.005; one-sample t test: p < 0.001 in both cases; difference between genotypes was n.s.).
NR1-KO mice have normal “phase precession-bound” place fields
Theta oscillations, a prominent rhythm of the hippocampus in the active rodent (Vanderwolf, 1969), have a strict relationship with place cell firing: spikes tend to occur in the trough of the oscillation, but during a place field crossing, they will gradually advance their firing phase (phase precession; O'Keefe and Recce, 1993). This process has also been used to define a place field as the distance necessary for a cell to complete a phase precession cycle (Maurer et al., 2006a). If NR1-KO place cells have normal place fields and it is the across-trial variability that underlies impaired spatial representation, than spikes fired by a NR1-KO place cell, should show a similar amount of theta phase precession within its field as CTR place cells. We analyzed, therefore, phase precession at the single-trial level. Phase precession was robust in both genotypes [Fig. 3A, examples of single-trial phase precession slopes for a CTR (top) and a NR1-KO (bottom) PC]. We calculated three parameters related to phase precession: slope (Fig. 3 B; the rate of precession), phase precession range (Fig. 3C; the amount of precession) and the distance covered (Fig. 3D; distance between first and last spike). In all three measures, NR1-KO PCs showed similar values to CTR PCs (t test, n.s.). These results further support our conclusion that NR1-KO PCs show normal, “unitary” (Maurer et al., 2006b) place fields.
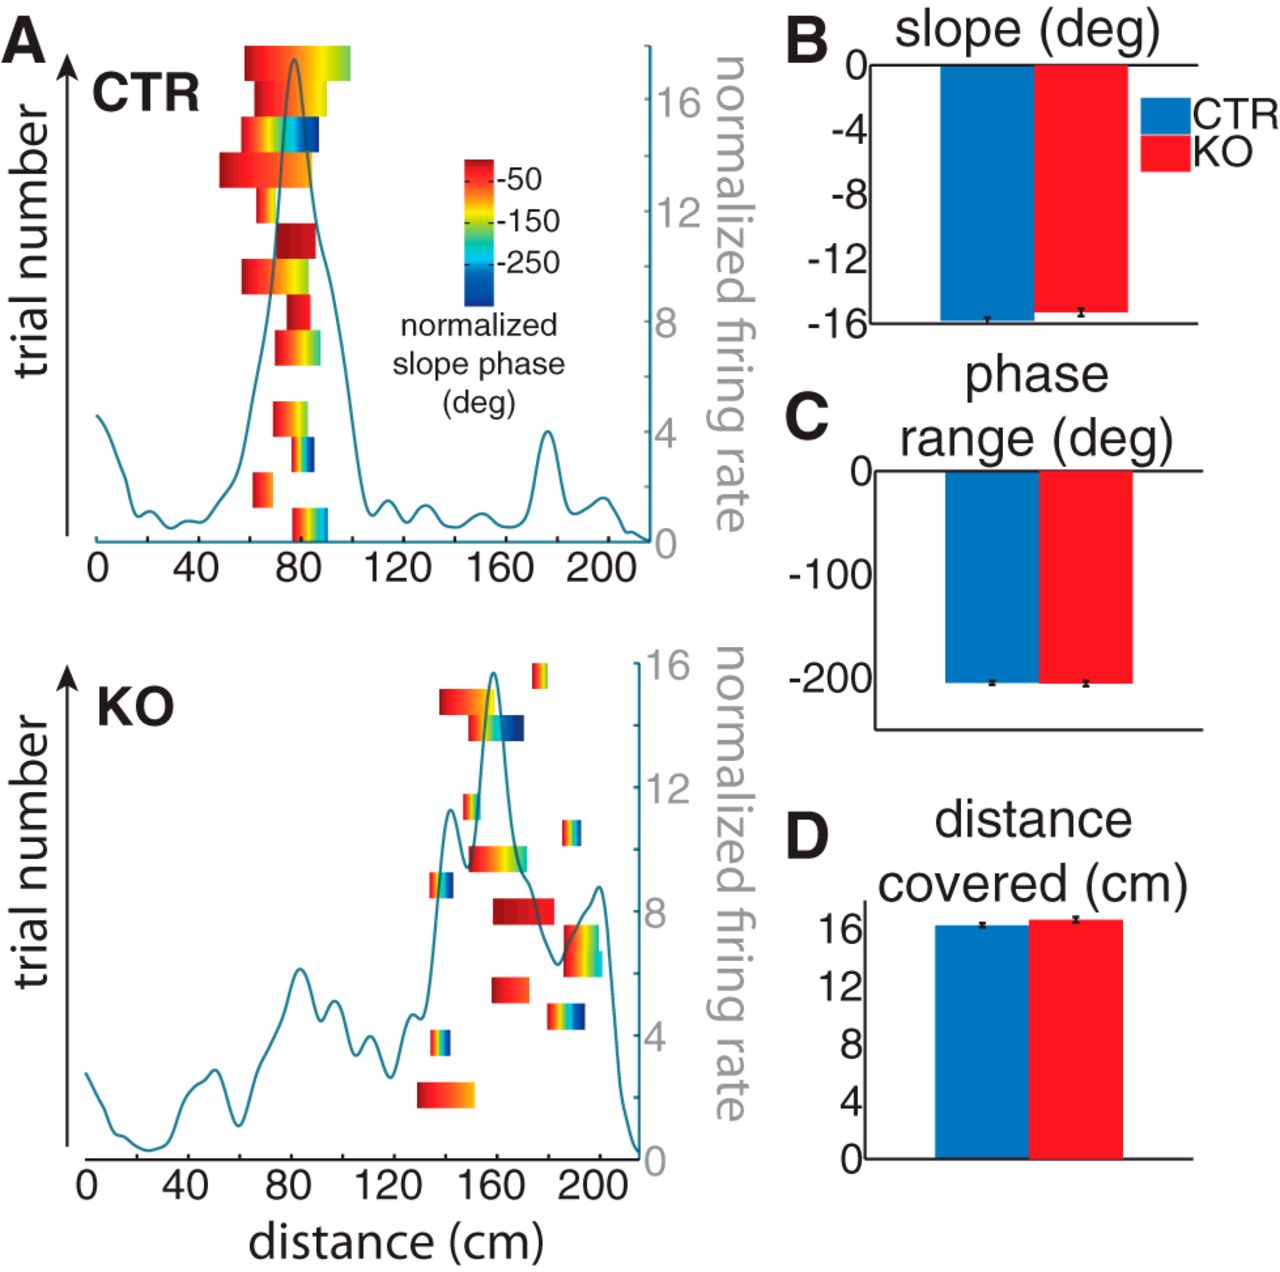
NR1-KO mice have normal phase precession-bound PFs. A, Examples of a CTR (top) and NR1-KO (bottom) place cell. Phase-precession events are represented as the slope of precession (normalized to the first phase) over the spike (distance) range for each trial (left, y-axis). The session-wide PF is depicted in the light gray curve (right, y-axis). B, Slope of phase precession. There was no difference between genotypes (t test, n.s.). C, Phase-range of a precession event. There was no difference between genotypes (t test, n.s.). D, Distance covered between the first and last spike of a phase-precession event. There was no difference between genotypes (t test, n.s.); a phase-precession event was detected as a minimum of four spikes occurring within a single-trial PF.
NR1-KO spatial representation improves with experience
To quantify how much a firing map changes within a session, we split the session into two halves and calculated, as a stability index, the Pearson's R between the two firing maps (Fig. 4A). NR1-KO place fields showed lower stability than CTRs (KS test, p < 0.001; t test, p < 0.001). Next, we calculated the number of trials needed for a place cell to acquire a stable place field. First, we constructed, for a designated trial, the firing map using all trials up until the designated one and calculated the Pearson's R with the overall session's firing map. To demonstrate that this effect does not depend on an arbitrary split of the trials in two halves, we used a variable threshold for the Pearson's R (between 0 and 1), and then calculated the number of trials it took the place cell to reach that threshold. NR1-KO place cells took significantly more trials to stabilize their place fields for thresholds ≥0.45 (Fig. 4B; ANOVA, p(genotype) <0.001). The stability index in NR1-KO mice improved with familiarity to the circular maze across sessions (Fig. 4C; NR1-KO: Spearman's Rho = 0.12, p < 0.01; Fisher's test between Spearman's Rho for NR1-KO vs CTR: p < 0.05), showing that spatial representations are less subject to change within a session in later training days. If KO place fields become more stable as sessions progress, increased familiarity with the environment is expected to lead to a more stable spatial representation. To address this question, we compared two session-wide place field parameters, size and spatial information, across the two first and two last (sessions 9 and 10) sessions of the recording protocol (Fig. 4D; no. units: CTR = 67 and NR1-KO = 46). In both cases, NR1-KO mice were impaired, showing a larger place field size and lower spatial information (post hoc, p < 0.05) than CTR mice in the first two sessions. Toward the end of the recording, however, NR1-KO mice leveled with CTR mice [for place field size and spatial information: ANOVA, p(genotype) <0.05, p(session) <0.05, p(interaction) = n.s.]. These results confirm the above-described results, showing that NR1-KO place fields become more consistent with experience on the track. CTR mice also showed a very mild (nonsignificant) decrease in place field size and increase in spatial information (hence the lack of an interaction effect in the ANOVA).

NR1-KO spatial representation improves with experience. A, Stability index, calculated as the Pearson's correlation between the firing map of a given place cell during the first and the second half of a session. NR1-KO showed a lower stability index (KS test, p < 0.001, t test, p < 0.001). B, Number of trials required for the cumulative PF map to cross a Pearson's R-based threshold-similarity value to the PF map of the entire session [ANOVA, p(genotype) < 0.0001;*post hoc difference CTR-KO, p < 0.05]. C, Stability index per session: NR1-KO showed a significant positive Spearman's correlation between stability index and session (Spearman's R: NR1-KO, r = 0.12, ***p < 0.001; CTR: n.s.; Fisher's test between Spearman correlations, p < 0.05). D, PF size (left) and spatial information (right) calculated over the two first (sessions 1 and 2) and two last sessions (sessions 9 and 10): NR1-KO PF size decreased, whereas spatial information increased over sessions, to approach the values of CTR (post hoc, p < 0.05).
NR1-KO place cells fail to undergo experience-dependent changes
In the previous analysis we focused on differences in the accuracy of place field firing and in the similarity of firing across trials. But place fields are plastic and change over the first runs on a track, showing an expansion that is backwards relative to the direction of locomotion (Mehta et al., 1997). We therefore looked at three parameters which define a place field and analyzed how they change over the course of a session: CTRs showed an increase in the maximum in-field firing rate [Fig. 5A; (SLR): p < 0.01; ANCOVA: p(genotype) <0.001, p(trial) <0.001, p(interaction) <0.001], an increase in place field size [Fig. 5B; SLR: p < 0.05; ANCOVA: p(genotype) <0.001, p(trial) <0.001, p(interaction) = 0.1] and a displacement of the place field's center-of-mass (COM), toward the point of departure [Fig. 5C; SLR: p < 0.005; ANCOVA: p(genotype) <0.001, p(trial) <0.001, p(interaction) = 0.1]. NR1-KOs showed a similar trend in all three measures, but failed to reach significance. We also looked at the skewness of the place fields (PFs): PFs tend to show a negative skewness (Mehta et al., 2000); that is, to have most spikes concentrated at the end of the PF. Session PFs of CTR mice were more negatively skewed (Fig. 5D; t test, p < 0.05). These results highlight how the shape of the PF of CTR mice changes as a function of experience within a session, as previously described (Mehta et al., 2000), adopting an asymmetrical shape. Remarkably, NR1-KO mice failed to generate such plasticity of PF shape.

NR1-KO place cells fail to undergo experience-dependent changes. A, In-field maximum firing rate per trial normalized to the first trial. CTRs showed an increase over trials (linear regression, CTR: **p < 0.01, NR1-KO: n.s.; ANCOVA: p(genotype) <0.001, p(trial) <0.001, p(interaction) <0.001). B, PF size per trial normalized to the first trial. CTRs showed an increase over trials [linear regression, CTR: *p < 0.05, NR1-KO: n.s.; ANCOVA: p(genotype) <0.001, p(trial) <0.001, p(interaction) = 0.1]. C, COM shift per trial. CTRs showed a precession of the COM over trials [linear regression, ***p < 0.005; ANCOVA: p(genotype) <0.001, p(trial) <0.001, p(interaction) = 0.1]. D, Average skewness of the session's PF: NR1-KOs had a less negative skewness (t test, *p < 0.05).
NR1-KO PFs in the two running directions are less precisely aligned to both physical location and distance run from departure point
The collection of PFs spanned the entire circular track in both genotypes (Fig. 6A). This track tessellation reveals additional structure, most strikingly in CTR, where a mirror contour of the PF map is obvious in the clockwise trials. “Bidirectional” PFs in this display represent place cells (Battaglia et al., 2004) that have PFs located at the same physical location in both clockwise and counterclockwise runs. “Same-distance” place cells have fields at the same distance traveled from departure point in the two directions. To analyze how firing is influenced by location and distance run, we constructed a spatial correlation matrix of the population vectors at each spatial bin in both running directions (Fig. 6B). In this display, bins falling on the positive diagonal represent path integration-supported (reset at each departure) firing (same distance PFs), whereas those falling on the negative diagonal represent firing primarily guided by environmental cues (“same-location”). Same-location spatial representations predominated in both genotypes, but were weaker in NR1-KOs than CTRs. To quantify this, we calculated the correlation between the population matrices (Fig. 6B) in both directions (for the same-location condition, the clockwise population matrix was mirrored): same-location and same-distance maps showed a stronger correlation in CTRs than KOs (Fisher's test between correlations, p < 0.01; fig. 6C). In both genotypes, same-location mapping was, indeed, more salient than same-distance mapping (Fisher's test between correlations, p < 0.01), indicating that place cells are more likely to be anchored to distal cues, rather than relying on path integration, as defined with respect to the departure point. All four correlation values exceeded the value taken from a shuffled condition (calculated as the correlation between a stacked PF matrix in one direction and the stacked PF matrix in the opposite direction (mirrored, in the same-location case) with shuffled rows; mean +2 SD was taken as the upper bound of the shuffled distribution).

NR1-KO PFs follow less precisely both path-integration and allocentric frameworks. A, Distribution of PFs along the two running directions. Each row displays the linearized firing map of a neuron, computed over the entire session and normalized to its maximum. Neurons were aligned according to the bin of maximum firing in the counterclockwise direction. B, Spatial bin-by-bin correlation. Bins at the same physical location in both directions (same-location condition; top, left) are located along the negative diagonal, while bins representing distance from departure are located along the positive diagonal (same-distance condition; bottom, left). CTR mice show areas of high correlation for both cases, whereas in NR1-KO (right) the pattern was much more blurred. C, Pearson's correlation between counter-clockwise and clockwise (same-distance) or mirrored clockwise (same-location) stacked firing map matrix (see A). In both cases, CTR showed a higher correlation than NR1-KO (Fisher's test between correlations: p < 0.001). Dashed lines show the significance level, calculated as the mean +2 SD of a shuffled dataset. D, Average population vector correlation (see Materials and Methods) as a function of normalized distance for the firing map (top) and y (bottom) firing map. In all cases the correlation in the negative lags, that is, distance (location) preceding the distance (location) in the reference run, was higher than in the positive ones (t test, negative vs positive lags: p < 10−5).
Previous studies have shown that bidirectional place cells fire earlier in runs in one direction compared with the opposite direction, an effect attributed to prospective coding (Battaglia et al., 2004; Resnik et al., 2012). We looked at this by calculating the Pearson's correlation for each bin in one direction with bins at a given lag with respect to the corresponding bin in the opposite direction for the same-distance (Fig. 6D, top) and same-location (Fig. 6D, bottom) conditions. We observed a similar effect as previously described, with the correlation peaking at negative lags; i.e., at shorter distances from departure (same-distance condition) and at earlier locations (same-location condition), when mice ran in one direction compared with running in the opposite direction. The effect was most salient in CTRs and in both genotypes was most striking in the same-location condition. In the latter case, NR1-KOs did not show a clear peak, nor a difference in the Pearson's R values between positive and negative lags [t test (NR1-KO) R(pos) vs R(neg), n.s.; t test (CTR) in both conditions and t test (NR1-KO) in same-location condition, p < 1e−5]. The differences between genotypes suggest a deficit in anticipatory firing upon PF approach in NR1-KO mice. For the same-distance condition, the trajectory used as a reference will determine whether the peak occurs in negative or positive lags. Importantly, in all cases, the first trial was a counterclockwise run, so that the clockwise run was the “return” run, suggesting that this effect may indeed reflect prospective coding of distance ran.
Discussion
It has been reported that NMDA receptor knock-out leads to impaired spatial representation (McHugh et al., 1996), but the nature of this deficit is not clear. With a single-trial analysis of place cell firing in NR1-KO mice, we show that these animals have single-traversal PFs of normal size and that the larger, session-wide PFs are, rather, a consequence of increased across-trials firing variability. Whereas CTR PFs underwent changes through a session, in their maximum firing rate and position of its COM, NR1-KO did not, showing that the lack of the NMDAR impairs place cell plasticity.
Increased PF size as a consequence of variability across trials
Genetic knock-out of NMDARs in CA1 (McHugh et al., 1996), (similarly to other manipulations; Kentros et al., 1998), have been reported to result in increased PF size, which may underlie the spatiotemporal deficits that these animals show behaviorally (Tsien et al., 1996a; Rondi-Reig et al., 2006; Cabral et al., 2014). We reproduced such an increase, but only when the PF was defined over the entire session: at the single-trial level PFs in KO mice had a similar size as in CTR mice. This raises the possibility that the increased PF size is a consequence of intertrial variability, rather than larger unitary PFs: a place cell that fails to fire precisely at the same location over trials will cumulatively show a broader PF.
At each PF traversal, a unique set of inputs providing spatial (sensory and self-motion) information will define that place cell's firing. This process appears to be normal in NR1-KO, which suggests that the higher between-trial variability is due to a failure to properly integrate this information with other inputs arriving to area CA1. Spatial and nonspatial (e.g., object-related) inputs are thought to be relayed to CA1 by the medial and lateral entorhinal cortex (EC), respectively (Witter and Moser, 2006). The other main structure projecting to the CA1 is CA3, crucial for one-trial learning and memory retrieval (Nakazawa et al., 2002). The impairments may be due to a failure of NR1-KO mice to properly integrate CA3 and EC inputs (Cabral et al., 2014), as it has been suggested that the development of a stable spatial representation in CA1 requires the reconciliation those two streams (Carr and Frank, 2012). CA3 is characterized by a dense recurrent network and is crucially involved in the formation and retrieval of spatial memory (Jensen and Lisman, 1996). The EC, on the other hand, has a more “real-time” role, providing the CA1 with information about the current environment. In this sense, NR1-KO mice may not be capable of properly storing the precise location of firing upon a PF crossing into a stable spatial representation and, therefore, fail to properly match the current place information to existing spatial representations (Lee et al., 2004).
Despite the significantly higher running speed of NR1-KO mice, this difference was likely too small to explain the smaller PF size on a trial-by-trial basis. Indeed, the effect reported by Geisler et al. (2007), which shows that theta frequency increases with speed, thereby accelerating the rate of phase precession, and likely determines PF boundaries, depended on average running speed differences of the order of 24 cm/s, well above the difference we measured (<2 cm/s). Furthermore, we replicated PF size results using only running periods falling within the same velocity range (between the 20th and 80th percentiles of the velocity of CTR mice).
The intertrial variability decreased over the course of the session in both genotypes and throughout recordings (data not shown; Mehta et al., 1997; Lee et al., 2004), suggesting that multiple exposures to the track are required for the formation of stable spatial representations. Indeed, in rats the CA1, but not CA3, network undergoes gradual changes over several days of track exposure, as population firing rate and in percentage of active cells decrease (Karlsson and Frank, 2008). CA3 neurons, on the other hand, are deemed crucial for one-trial learning and pattern completion (Nakazawa et al., 2003), and may therefore assist CA1 in its development of a stable PF map.
NR1-KO mice showed lower stability within a session, but the stability index increased over sessions, such that their PFs leveled those of CTR in two key PF quality measures in the last sessions: size and spatial information. This may be due to either CA1 NMDAR-independent plasticity (Moosmang et al., 2005) or CA1 spatial representations being increasingly driven by CA3, which is spared from the mutation, as training proceeds. By lesioning direct EC projections to area CA1, Brun et al. (2008) showed that, in a novel environment, CA1 place cells could still develop normal PFs with extensive experience, suggesting that the contribution of CA3 inputs to CA1 place cells may evolve with prolonged, multisession exposure to the track and, thereby, assist in the improvements in spatial representation seen in NR1-KO mice. An alternative account of this finding may depend on adaptive changes already at the level of EC inputs (a hypothesis needing direct experimental testing).
Hussaini et al. (2011) previously showed an increase in spatial memory in HCN1 KO mice, despite also showing larger (session-wide) PFs. Crucially, they also report increased PF stability, which may well be an essential process underlying spatial memory. This suggests that the decreased stability we observe in our NR1-KO mice may be, in part, responsible for the deficits in memory present in these mice (Rondi-Reig et al., 2006; Cabral et al., 2014).
Intact theta-phase precession in NR1-KO mice
The theta rhythm endows place cells with a temporal structure and is thought to be a crucial process for synaptic plasticity (Skaggs and McNaughton, 1996). As we had previously reported (Cabral et al., 2014), we found that NR1-KO mice showed intact phase precession during normal navigation. The rate of precession was similar to CTR mice and the distance covered by the animal between the first and last spike of a phase precession event was also the same, suggesting that a PF may be bounded by a fixed amount of theta-phase precession of spikes as the animal runs through its PF (Maurer et al., 2006a).
Experience-dependent plasticity of PFs
Mehta et al. (2000) first showed that PF shape (in rats) is asymmetrical (negatively skewed), an effect developing gradually over trials. We found, similarly, that PFs of both genotypes were negatively skewed, but do not show a gradual skewness increase (data not shown). CTR but not NR-1 KO mice, however, show a progressive increase in size, maximum firing rate, and negative shift in the lap-based PF COM. Similarly, Lee et al. (2004) reported that COM shifts can occur over the session even without skewness changes, suggesting that the former parameter may be a more reliable measure of PF plasticity. Indeed PF backward shift is abolished by NMDAR pharmacological blockade (Ekstrom et al., 2001). Mehta et al. (2000) proposed that LTP/LTD in CA1 could induce the PF changes, rendering them with an asymmetric shape and their model predicts that blockade of NMDA should abolish the negative skewness. Here we show that impaired NMDA functioning in CA1 does, indeed, affect skewness of PFs, although it does not abolish it completely, suggesting that this receptor is not solely responsible for the plastic change to PFs.
Path-integration and cues influence on place cell firing
Some place cells exhibit a different firing pattern according to the direction of movement (McNaughton et al., 1983). Other place cells, however, are not affected by movement direction (bidirectional place cells; Battaglia et al., 2004). As in previous studies (Battaglia et al., 2004; Resnik et al., 2012), firing in runs in one direction was shifted backward with respect to activity in the opposite direction, suggesting prospective coding, which may signal to the animal it is approaching a particular point in space. NR1-KOs, despite also having same-location and same-distance place cells, showed a much weaker consistency in same-location and same-distance mapping than CTRs, a result similar to that reported by Resnik et al. (2012), who recorded from mice that lack the GluA1 subunit of the AMPA receptor and show both impaired synaptic transmission and long-term plasticity. These results highlight the importance of long-term plasticity for prospective coding mechanisms.
We suggest that, although spatially selective activity is still present, the building of a coherent, stable spatial representation in the CA1 is hindered in NR1-KOs due to a failure to consolidate single-trial information into a long-lasting representation that is stable across trials. This failure may be caused by the lack of plasticity at the Schaffer collaterals, likely involved in the storage of a spatial memory trace (Gruart, 2006; Nakazawa et al., 2004).
These results reinforce the importance of single-trial based analyses, to obtain a complete dynamical picture of place cell activity, as pooling multiple trials together may cache some effects of the manipulation being tested (see also single-trial phase precession studies; Schmidt et al., 2009).
Footnotes
This work was supported by a STW Grant AET7613 “MICROMAX” (C.M.A.P.) and EU FP7 Grant 270108 “Goal Leaders” (C.M.A.P.). The project ENLIGHTENMENT 284801 (F.P.B.) acknowledges the financial sup-port of the Future and Emerging Technologies program within the Seventh Framework Program for Research of the European Commission.
The authors declare no competing financial interests.
- Correspondence should be addressed to either Henrique O. Cabral or Dr Francesco Battaglia, Radboud Universiteit Nijmegen, Heyendaalseweg 135, Nijmegen 6525AJ, The Netherlands. cabralhenrique{at}gmail.com or F.Battaglia{at}science.ru.nl


