

Article Figures & Data
Figures
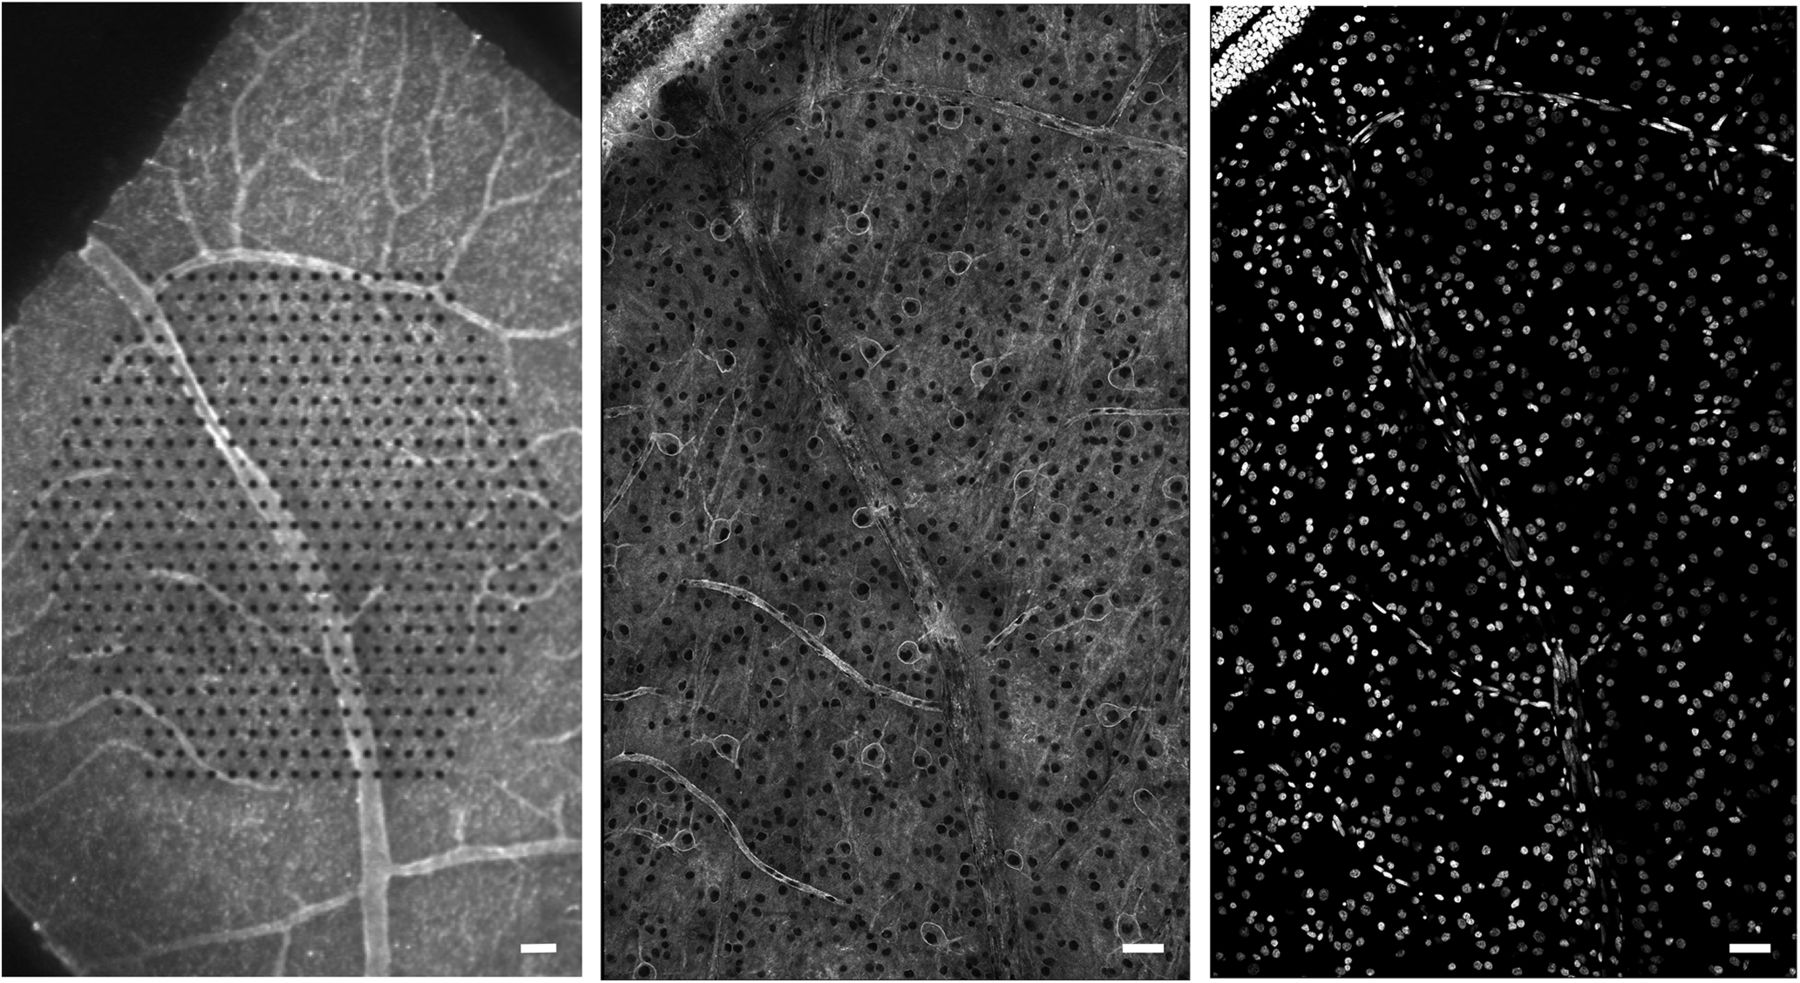
- Figure 1.
Aligning confocal images of fixed tissue to live recordings. Left, Live retina over multielectrode array, peanut agglutinin labeling vasculature. Center, Same retina, fixed, peanut agglutinin still visible, overlapping HCN1 labeling channel (Fig. 5). Right, Fixed retina, same field as center, DAPI. Scale bars, 50 μm.
- Figure 2.
Electrical image of retinal ganglion cell action potentials. A, Left, Raw voltage traces as a function of time recorded on six electrodes indicated in B. Times of easily identified spikes recorded from a single cell on Electrode 1 are identified as ticks at top. The average waveform of these five spikes and 2121 other similar spikes in the recording is shown at the right, expanded in time. Voltage traces for Electrodes 2–6 have the same time windows highlighted, corresponding to the time of the spike of the cell recorded on Electrode 1. Average waveforms on these electrodes, calculated on the same time windows, are shown at right. Distinct waveforms reveal characteristic average spike signatures for this cell on the different electrodes. Electrode 6 shows little or no voltage deflection associated with a spike in this cell. B, The maximum absolute amplitude of average voltage deflections from A are shown for each of the 519 electrodes in the hexagonal array, indicated by the diameter of the dot plotted at each electrode location. Large amplitudes near Electrode 1 are saturated. Apparent soma and dendrites are in cluster at top left, apparent axon extends down and right.
- Figure 3.
Axon conduction velocities estimated from electrical images. Histograms by cell type of estimated spike propagation velocity (see Materials and Methods) over the axonal portion of the electrical image for: 22 ON Parasol, 29 OFF Parasol, 124 ON Midget, 65 OFF Midget, and 15 small bistratified cells. Higher velocity in ON/OFF Parasol cells is consistent with larger axon caliber.
- Figure 4.
Matching axon trajectories. A, Traced axon trajectories (colored) are shown superimposed on grayscale image of GFP-labeled cells (see Materials and Methods). White somas and untraced axons are visible, traced axons obscured by traces. The cells used in D and E are labeled alongside. Scale bar, 100 μm. The imaged region corresponds closely to the borders of the rectangular recording array. B, Close-up image of a single labeled soma and dendrites with characteristic midget RGC morphology. Scale bar, 15 μm. This cell does not appear in other panels. C, Density of fluorescence over the normalized thickness of the inner nuclear layer (INL), inner plexiform layer (IPL), and RGC layer, within regions of interest local to two putative midget RGCs. DAPI signal is over the whole image and shows two peaks for nuclei dense regions at the centers of the RGC layer and INL. Density of somal GFP label peaks near the center of the RGC layer for both cells. Density of dendritic GFP label peaks in the proximal IPL for the putative ON midget, and in the distal IPL for the putative OFF midget, as expected for ON and OFF cell processes. D, Correspondence between a GFP-traced ON midget axon trajectory and selected recorded electrical images. Ellipses show Gaussian fits to the receptive fields of the putative matching RGC (shaded pink) and all surrounding RGCs of the same type (open) in the recording. For six of these RGCs, the electrical image is shown overlaid with the traced axon trajectory. Correlations indicated are between the recorded electrical image and the GFP-predicted electrical signal (see Materials and Methods). E, As in D, for an OFF midget axon tracing. F, Correlations for 12 axon tracings against full populations of recorded electrical images of the appropriate RGC type. In most cases, the best match (shaded pink) is clear relative to the rest of the population. The immediately surrounding RGCs, equivalent to the receptive field ellipses shown in C, D, are open circles. Remaining population are dots, with small random scatter on the x-axis to aid visualization. The cells used in C–E are labeled beneath. In two cases, there is no clear match among the recorded electrical images.
- Figure 5.
Matching molecularly identified subsets of cells. Top, Whole-mount HCN1 immunolabeled retina, at the level of the retinal ganglion cells. Black lacunae are cell nuclei, bright outlines are labeled cells. Rope-like structures are blood vessels (labeled by conjugated peanut lectin in the same channel). Colored circles represent the soma locations estimated from electrical images of ON and OFF parasol cells, with apparent correspondence to two distinct HCN1-labeled populations (see text). Scale bar, 25 μm. Bottom, Histograms showing results of permutation analysis (see Materials and Methods). Arrows indicate the location of the actual observed data; remaining data are from random permutations of electrical image-estimated locations. For most pairings, e.g., either HCN1-labeled population versus either population of midget electrical images, the actual data match no better than chance (arrows in the middle of permutation histograms). Two notable exceptions (arrows well outside permutation histograms) indicate probable matches.
- Figure 6.
Immunolabeling RGC somas, axons, initial segments, and primary dendrites. RGB channels: DAPI, ankyrin-G, βIII-tubulin. Two z-slices show the top and bottom of the RGC layer. DAPI labeling indicates nuclei of putative RGCs, amacrine cells, and retinal blood vessels. βIII-tubulin labeling appears restricted to RGC somas, axons, and primary dendrites, with particularly bright labeling of axon fascicles. Ankyrin-G labels short segments of RGC axons near the soma, putative initial segments. In addition, ankyrin-G also labels numerous short βIII-tubulin-negative segments, suggesting axonal processes of non-RGCs. Scale bar, 50 μm.
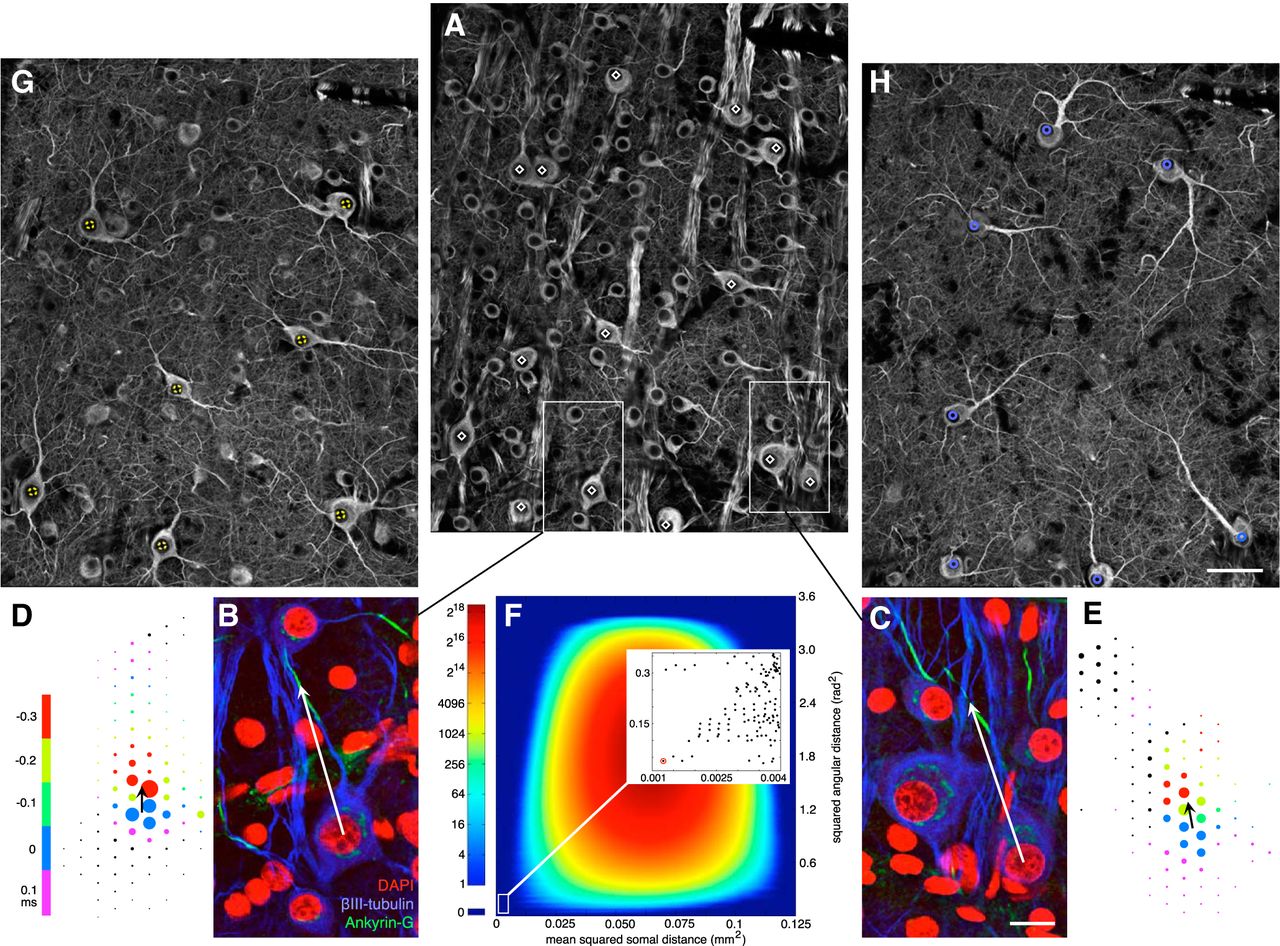
- Figure 7.
Matching with multiple anatomical and physiological features. A, βIII-Tubulin immunolabeling, focused at level of RGC somas. Black nuclei surrounded by bright somal labeling mark cell locations. Bright striate labeling marks axon fascicles passing in and out of image plane. Some primary cellular processes are visible until they pass out of image plane. Putative parasol RGCs identified based on gross morphology (see text) marked with white diamonds. B, C, Highlighted areas from A, focused at level of axon initial segments. Immunolabeling for ankyrin-G marks multiple axon initial segments. DAPI marks nuclei, including many tubulin negative cells, putative amacrine cells, and blood vessels. White arrows show vector defined for a putative ON (B) and OFF (C) parasol cell, from the somal center to the center of the axon initial segment. Scale bar, 15 μm. D, E, Electrical images, putatively matching the cells in B, C. Color of each electrode disc indicates the timing of its peak negative signal relative to the time of the maximal amplitude somal spike. Black arrows show vector defined as pointing from the somal spike center of mass to the earlier peaking putative initial segment location. F, 2D histogram of linear assignment analysis (see text). The entire space of possible assignments was probed between anatomical and electrical image vectors for 14 putative parasol cells. Color shows density of possible assignments yielding cost metrics with the given amplitudes. Inset, The lower left extreme points, near optimal for both cost metrics. Global optimum circled in red. G, H, Same area as shown in A, focused on the primary dendritic elaborations of the ON (G, dashed yellow circles) and OFF (H, blue circles) parasol populations, as identified by the optimal point in F. Clean mosaic tiling confirms identification. ON parasol arbors lie closer to the RGC layer than OFF parasol arbors, as evident from additional somas still slightly in plane in G. Scale bar, 50 μm also applies to A.


