

Abstract
An odor induces food-seeking behaviors when humans and animals learned to associate the odor with food, whereas the same odor elicits aversive behaviors following odor–danger association learning. It is poorly understood how central olfactory circuits transform the learned odor cue information into appropriate motivated behaviors. The olfactory tubercle (OT) is an intriguing area of the olfactory cortex in that it contains medium spiny neurons as principal neurons and constitutes a part of the ventral striatum. The OT is therefore a candidate area for participation in odor-induced motivated behaviors. Here we mapped c-Fos activation of medium spiny neurons in different domains of the mouse OT following exposure to learned odor cues. Mice were trained to associate odor cues to a sugar reward or foot shock punishment to induce odor-guided approach behaviors or aversive behaviors. Regardless of odorant types, the anteromedial domain of the OT was activated by learned odor cues that induced approach behaviors, whereas the lateral domain was activated by learned odor cues that induced aversive behaviors. In each domain, a larger number of dopamine receptor D1 type neurons were activated than D2 type neurons. These results indicate that specific domains of the OT represent odor-induced distinct motivated behaviors rather than odor stimuli, and raise the possibility that neuronal type-specific activation in individual domains of the OT plays crucial roles in mediating the appropriate learned odor-induced motivated behaviors.
SIGNIFICANCE STATEMENT Although animals learn to associate odor cues with various motivated behaviors, the underlying circuit mechanisms are poorly understood. The olfactory tubercle (OT), a subarea of the olfactory cortex, also constitutes the ventral striatum. Here, we trained mice to associate odors with either reward or punishment and mapped odor-induced c-Fos activation in the OT. Regardless of odorant types, the anteromedial domain was activated by approach behavior-inducing odors, whereas the lateral domain was activated by aversive behavior-inducing odors. In each domain, dopamine receptor D1 neurons were preferentially activated over D2 neurons. The results indicate that specific OT domains represent odor-induced distinct motivated behaviors rather than odor types, and suggest the importance of neuronal type-specific activation in individual domains in mediating appropriate behaviors.
Introduction
Odor cues induce a variety of motivated behaviors which lead to either obtaining rewards or avoiding dangers. Although some odorants evoke specific innate motivated responses, such as fear responses to predator odors (Kobayakawa et al., 2007), animals typically acquire appropriate motivated responses to cue odors based on their prior experience of odor–reward or odor–danger association learning. However, little is known about the neuronal circuit mechanisms that translate the learned odor cue information into various motivated behaviors.
Odorants detected by olfactory sensory neurons are coded by specific combinations of activated glomeruli in the olfactory bulb (OB), the first relay center of the central olfactory system (Mori and Sakano, 2011). The odor information is then conveyed to a number of areas in the olfactory cortex which includes the anterior piriform cortex (APC), posterior piriform cortex and olfactory tubercle (OT; Neville and Haberly, 2004). The OT is intriguing in that the nucleus accumbens and OT are anatomically bridged and form the ventral striatum (Millhouse and Heimer, 1984; Heimer et al., 1987). Whereas principal neurons in most areas of the olfactory cortex are glutamatergic pyramidal cells, principal neurons in the OT and accumbens are GABAergic medium spiny neurons (MSNs; Mogenson et al., 1980; Millhouse and Heimer, 1984; Chang and Kitai, 1985). The OT receives not only direct input from the OB but also massive association fiber inputs from many areas of the olfactory cortex, amygdala and prefrontal cortex, and dopaminergic inputs from the ventral tegmental area (VTA; Haberly and Price, 1977, 1978a,b; Krettek and Price, 1978; Berendse et al., 1992; de Olmos and Heimer, 1999; Nicola et al., 2000; Wesson and Wilson, 2011).
Previous studies showed the subregional segregation of function in the nucleus accumbens shell. For example, microinjections of AMPA/kainate receptor antagonist or GABAA receptor agonist in the anterior medial shell elicit appetitive eating behavior, whereas the same microinjections in the posterior medial shell induce fearful defensive treading (Reynolds and Berridge, 2002, 2003). Although the OT basically consists of a three-layered cortex-like structure, it has anatomical domains bounded by cap compartments and Islands of Calleja (Hosoya and Hirata, 1974; Fallon et al., 1978; de Vente et al., 2001). Cap compartments contain densely packed small-sized MSNs (dwarf cells) and are distributed at the surface of the lateral portion of the OT (Hosoya and Hirata, 1974; Millhouse and Heimer, 1984). The Islands of Calleja contain densely packed granule cells belonging to local interneurons and are distributed across wide areas of the OT (Fallon et al., 1978). This domain structure of the OT raises the possibility that different domains of the OT might be functionally differentiated in the control of odor-induced distinct motivated behaviors (Wesson and Wilson, 2011; Fitzgerald et al., 2014).
Here, we trained different groups of mice to associate a same odor cue with either a sugar reward or an electrical foot shock punishment. We then mapped the c-Fos activation of MSNs in different domains of the OT following exposure to the learned odor cue (Herrera and Robertson, 1996; Bepari et al., 2012). According to Heimer (1978), the OT contains not only the striatal component but also the ventral pallidal component and axon bundles that project from the striatopallidal structure to other brain areas (medial forebrain bundle). In the present study, we excluded the ventral pallidal component and medial forebrain bundle from the analysis, and focused on MSN-containing cortex-like and cap compartments, and granule cell-containing Islands of Calleja. Thus, we here referred to the OT as the structure representing these three types of compartments. In mice that showed an approach behavior to the learned odor cue, c-Fos activation preferentially occurred in dopamine receptor D1-expressing MSNs in the anteromedial domain of the OT. In striking contrast, c-Fos activation occurred mainly in D1-expressing MSNs of the lateral domain in mice that showed an aversive behavior to the learned odor cue. These results were observed consistently, regardless of the type of odor used for conditioning.
Materials and Methods
Animals.
All experiments were conducted in accordance with the guidelines of the Physiological Society of Japan and were approved by the Experimental Animal Research Committee of the University of Tokyo. C57BL/6 male mice were purchased from Japan SLC, housed individually in plastic cages (24 × 17 × 12 cm) with paper bedding (2 cm depth), and placed in isolation boxes (Natsume Seisakusho) at 26°C under a 12 h light/dark cycle with lights on at 5:00 A.M. Odor-association learning was started when mice were 8- to 10-weeks-old.
Odor association learning and behavioral assay.
For odor and sugar association, mice were food-restricted to achieve 80–90% of their ad libitum feeding body weight. One day before the start of odor-sugar association learning, food pellets were removed and replaced with 0.1 g of a powdered animal diet, which resulted in a decrease in body weight to 80–90% on the next day. A powdered diet of 1.5–2.0 g per day was then delivered during the training period to maintain the 80–90% body weight. Water was available ad libitum throughout the whole schedule. Association of odor and the sugar reward was conducted in a plastic cage (24 × 17 × 12 cm). In the first session of day 1, mice were habituated to eating sugar by being served sugar (granulated sucrose; 20–40 mg) and powdered diet (20–40 mg) on a holed Petri dish which contained a filter paper (2 × 2 cm) soaked with amyl acetate or eugenol (10% dilution by mineral oil, 40 μl; Tokyo Chemical Industry) in the lower compartment. In the following four sessions of day 1 the mice underwent association of the sugar reward (without powdered diet) with amyl acetate or eugenol in the same dish. The dish was hidden under bedding (2 cm depth) so that the mouse could find the sugar by smell, with the hiding position randomly chosen from each corner of the conditioning cage. To avoid possible secondary effects of training such as changes in metabolic state by prolonged food restriction, we determined the minimum period (days) of association learning for inducing odor-guided approach behavior, (Carr, 2002). Although some mice did not approach the buried cue odor and sugar on day 2 trials, they all showed a rapid approach to them within 5 s on the last (fourth) trial on day 3 and on all trials on days 4 and 5. Based on this observation, training for 3 consecutive days (4 associations per day) was consistently applied. For the control group of mice receiving odor delivery without sugar reward (“odor + no sugar” group), mice underwent the same training procedures as the sugar-associated odor group except that they did not receive the sugar.
Association of odor and the electrical shock punishment was conducted in a foot shock chamber (18 × 11 × 12 cm, O'hara) containing the cap of a centrifuge tube with mineral oil (40 μl). For habituation, the mice were transferred to the foot shock chamber for 30 min. This habituation was repeated four times before odor and shock delivery. Soon after the habituation, amyl acetate or eugenol (10% dilution by mineral oil, 40 μl, Tokyo Chemical Industry) was introduced into the cap. Mice were continually exposed to amyl acetate or eugenol, and delivered the electrical shock (0.2–0.4 s, 0.4 mA) at 0.5, 5, 15, and 25 min after the start of odor exposure (total of 4 electrical shocks). The mice were further exposed to amyl acetate or eugenol for an additional 5 min, and then transferred to their home cage. To avoid possible secondary effects of extended training, such as fear response to experimenters, we determined the minimum period (days) of association learning for inducing odor-guided aversive behavior. Because training for only 1 d induced significant odor-guided aversive behavior on the following days in all mice examined, this training period was consistently applied. For the control group of mice receiving odor delivery without shock punishment (“odor + no shock” group), mice underwent the same training procedures as the shock-associated odor group except that they did not receive the electrical shock.
After the training, all mice received ad libitum feeding for 1 day, were fasted for 18–20 h, and then received odor or air delivery for the examination of behavioral responses and c-Fos activity. Amyl acetate or eugenol (10% dilution in mineral oil, 0.2 ml) was delivered into the home cage via a tube whose end was implanted at the center of the cage. The air delivery group instead received 0.2 ml of air. To reduce individual variation in mouse baseline behaviors, odor delivery was performed in the light-on period (3–4 h after light first on), when mice typically show rest or sleep behavior. Animal behavior around the odor or air delivery was recorded with a digital video camera and the first 10 min after delivery was analyzed.
Categorization of mouse behaviors.
Behavior was categorized into six types: digging, vigilant behavior, grooming, locomotive exploration, nonlocomotive body movement, and rest/sleep (Crawley, 2007). Digging indicates that mice were digging the bedding. Vigilant behavior indicates that mice showed freezing (completely motionless except for respiration with head elevating), head retraction (retracting the head after sniffing the place of the odor outlet), or alert exploration (taking a lowered posture, staying away from the odor outlet, and moving around the outer area of the cage). Grooming indicates that mice were grooming the body. Locomotive exploration indicates that mice were walking/running or rearing. Nonlocomotive body movement indicates that mice stayed at one place with sniffing around or handling the bedding. Rest/sleep indicates that mice stayed at one place calmly with the head dropped. Behaviors that lasted longer than 2 s were evaluated. At 30 min after delivery, mice were anesthetized by intraperitoneal injection of sodium pentobarbital and fixed with paraformaldehyde (PFA) for histological examination. Behavioral data were confirmed by an independent researcher who was blind to the experimental conditions of the animals.
Sample preparation for histochemistry.
Mice were deeply anesthetized by intraperitoneal injection of sodium pentobarbital. They were transcardially perfused with PBS followed by 4% PFA. The brain was removed from the skull, immersed in 4% PFA in 0.1 m phosphate buffer (PB) overnight, and then transferred to 30% sucrose in RNase-free 0.1 m PB. The brain was then embedded in the OCT compound (Sakura Finetechnical), frozen at −80°C, and sliced into coronal sections with a thickness of 20 μm with a cryotome. Sections were rinsed in RNase-free PBS and 0.1 m PB, mounted on slide glasses (PLATINUM coat, Matsunami) using a paint brash, dried overnight in a vacuum desiccator, and then stored at 4°C until histochemistry.
RNA probe preparation for in situ hybridization.
Plasmid templates for in vitro transcription for D1 and D2 mRNAs were kindly provided by Dr Kazuto Kobayashi (Sano et al., 2003), and that for c-Fos mRNA was kindly provided by Dr Hirohide Takebayashi (Bepari et al., 2012). We prepared digoxigenin (DIG)-labeled RNA probes for c-Fos, D1 and D2 mRNAs, and fluorescein (FLU)-labeled RNA probes for D1 and D2 mRNAs using Roche's in vitro transcription kit according to the manufacturer's protocol.
In situ hybridization using a single probe.
For Figures 1A,B, 5A, and 9A, in situ hybridization for D1, D2, or c-Fos mRNAs was performed as described previously with modification (Bepari et al., 2012). In short, coronal sections were fixed in 4% PFA, digested with proteinase K (10 μg/ml) for 30 min and postfixed in 4% PFA. After prehybridization, sections were incubated overnight at 60°C with DIG-labeled RNA probes. After stringent washing, blocking was done by 10% normal sheep serum, 1% bovine serum albumin and 0.1% Triton X-100 in PBS. Afterward, sections were incubated overnight at 4°C with alkaline phosphatase-conjugated anti-DIG antibody (1:1000 dilution, Roche). Sections were washed in MABT (100 mm Maleic acid, 150 mm NaCl, 0.1% Tween 20) and then in alkaline phosphatase buffer (100 mm NaCl, 100 mm Tris-HCl, pH 9.5, 50 mm MgCl2, 0.1% Tween 20, 5 mm Levamisole). Sections were treated with NBT/BCIP (Roche) mixture at room temperature in dark for color development. After color development, sections were counterstained with nuclear fast red (Vector), dehydrated in ethanol, cleared in Xylene, and then mounted in Mount Quick (Daido Sangyo).
Double fluorescent in situ hybridization.
Double in situ hybridization was performed as described previously with modification (Watakabe et al., 2010), using DIG- and FLU-labeled probes as follows: Figure 1F, DIG-labeled D1 probe and FLU-labeled D2 probe; Figure 8, DIG-labeled c-Fos probe and FLU-labeled D1 probe or D2 probe. Hybridization and washing were performed as described above, except that both DIG and FLU probes were used for hybridization. After blocking in 1% blocking buffer (Roche) for 1 h, DIG and FLU-labeled probes were detected as follows: For the detection of the FLU-labeled probes, sections were incubated with an anti-FLU antibody conjugated with horseradish peroxidase (1:500 dilution, PerkinElmer) for 1 h at room temperature. After washing in Tris-NaCl-Tween buffer (TNT) (0.1 m Tris-HCl, pH 7.5, 0.15 m NaCl, 0.1% Tween 20) three times for 10 min, sections were treated with 1:100 diluted TSA-Plus (dinitrophenol (DNP)) reagents for 5 min according to the manufacturer's instruction (PerkinElmer), and the FLU signals were converted to DNP signals. To further develop FLU and DNP signals, sections were washed in TNT three times for 10 min, incubated with an anti-DNP antibody conjugated with horseradish peroxidase (1:500 dilution, PerkinElmer) for 1 h at room temperature, and again treated with 1:100 diluted TSA-Plus DNP reagents for 5 min. Sections were incubated with an anti-DNP antibody conjugated with AlexaFluor 488 (1:500 dilution, Invitrogen) in 1% blocking buffer for fluorescence detection of DNP signals overnight at 4°C. At this point, anti-DIG antibody conjugated with alkaline phosphatase (1:500 dilution, Roche) was included in the incubation for detection of the DIG probes. The sections were washed three times in TNT and once in Tris-saline buffer 8.0 (0.1 m Tris-HCl, pH 8.0, 0.1 m NaCl, 50 mm MgCl2), and alkaline phosphatase activity was detected using an HNPP fluorescence detection set (Roche) according to the manufacturer's instructions. Incubation for this substrate was performed for 30 min, repeated a total of three times, and stopped by washing in PBS. Sections were then counterstained with DAPI diluted in PBS (2 μg/ml) for 5 min. After washing in PBS, sections were mounted in PermaFluor (Thermo Fisher Scientific).
Double-fluorescent labeling for an mRNA and immunoreactivity.
For Figure 1C,D, we performed double-fluorescent labeling of an mRNA for D1 or D2 using DIG-labeled probes and immunostaining against NeuN as described previously with modification (Watakabe et al., 2010). The hybridization and fluorescent DIG detection were performed as described above. In the process of incubation with anti-DIG antibody, rabbit anti-NeuN antibody (1:200 dilution, Merck Millipore ABN78) was also included in the incubation. Before the HNPP fluorescence detection, sections were incubated with AlexaFluor 488-conjugated secondary antibodies (1:200 dilution, Jackson ImmunoResearch). Sections were then counterstained with DAPI and mounted in PermaFluor (Thermo Fisher Scientific).
Immunohistochemistry.
For Figure 2, coronal cryosections of the OT (20 μm thickness) were prepared from the rostral tip to the caudal end. Immunohistochemical analysis was performed as described previously (Murata et al., 2011). The primary antibodies used were rabbit anti-DARPP-32 monoclonal antibody (1:200 dilution, Abcam ab40801) and mouse anti-NeuN monoclonal antibody (1:200 dilution, Merck Millipore MAB377). Secondary antibodies were AlexaFluor 488- or Cy3-conjugated antibodies (1:200 dilution, Jackson ImmunoResearch). Sections were incubated with appropriate antibodies, counterstained with DAPI, and mounted in PermaFluor (Thermo Fisher Scientific).
Image acquisition and quantification.
Sections were examined with a bright-field microscope (Olympus, BX51) with the Neurolucida system (MBF Bioscience) for Figures 1A,B, 5, and 9; a fluorescent microscope (Zeiss, Axioplan 2 Imaging) for Figure 2A; and a confocal laser scanning microscope (Leica, TCS SP5) for Figures 1C,D,F, 2B,C, and 8A,B,I.
mRNA signals obtained by NBT/BCIP color development well overlapped with cell structures visualized by nuclear fast red staining. Quantification of mRNA(+) cells by a main rater was confirmed by an independent researcher who was blind to the experimental conditions of the animals.
To quantify the intensity of the D1 mRNA signal per cell, the purple-colored signal obtained by NBT/BCIP color development was captured in the cyan channel of the CMYK color mode. Signal intensity per D1 mRNA (+) cell, whose area was determined by nuclear fast red staining, was quantified for 150 cells (50 cells per mouse × 3 mice) for a given compartment (cortex-like compartment, cap compartment, and Islands of Calleja) and then averaged. The average signal intensity of a D1 mRNA (−) cell in cortex-like compartment (average from 150 cells; 50 cells per mouse × 3 mice) was subtracted from the average signal intensity of a D1 mRNA (+) cell for each compartment. The subtracted value was regarded as the specific intensity of the D1 mRNA signal per cell in the compartment. The ratio of the value in the Islands of Calleja to that in the cortex-like compartment or cap compartment was calculated.
Mapping and reconstruction of domain structures and c-fos(+) cell distribution in the OT.
We used Neurolucida (MBF Bioscience) to visualize the domain structure of the OT (Fig. 3) and the distribution of c-Fos(+) cells in a set of coronal sections (see Figs. 5B, 8C,F, and 9B) and to quantify the density of c-Fos(+) cells (see Figs. 6⇓⇓–9). For Figure 3, serial coronal sections of the OT (20 μm thickness) from its rostral tip were selected at the rate of one in every two, and the information of the selected sections (56 sections) was analyzed. The coronal sections were immunostained with anti-DARPP-32 antibody and anti-NeuN antibody (Fig. 2). In each coronal section, we delineated the cap compartment, Islands of Calleja, and cortex-like compartment of each domain. Cap compartments were identified as dense cell structure that protrudes toward the surface or lateral edge of the OT. Islands of Calleja were also dense cell structure that locates in the superficial layer of the anteromedial OT and deep layer of the central OT. Immunoreactive cap compartments and immunonegative Islands of Calleja were differentiated by immunostaining for DARPP-32. After confirming that the spatial distribution of cap compartments and Islands of Calleja were closely similar among mice, they were identified and discriminated under nuclear fast staining from the cell size, cell density, staining intensity, and spatial localization, and used as landmarks for OT domain mapping. Cortex-like regions were divided into compartments based on the distribution of cap compartments and Islands of Calleja. In case the cortex-like regions were continuous at the gaps of cap compartments or Islands of Calleja, the boundary of the cortex-like compartments were defined by imaginary lines linking the center of those compartments.
For Figure 5, serial coronal sections of the OT (20 μm thickness) from its rostral tip were selected at the rate of 1 in every 5, and the 20 selected sections were analyzed for c-Fos(+) cell distribution. For Figure 8, serial coronal sections of the anteromedial domain were selected at the rate of 1 in every 5 (see Fig. 8C) and serial coronal sections of the lateral domain were selected at the rate of 1 in every 10 (see Fig. 8F). The four selected sections for the anteromedial domain and seven sections for the lateral domain were analyzed to examine D1 or D2 mRNA expression in each c-Fos(+) cell. The density of c-Fos(+) cells with or without D1/D2 mRNA expression in each area was calculated by the total number of cells over the total area (mm2). For Figure 9, analysis of the APC was done using the same sets of coronal sections as used in the analysis of Figures 5⇓–7. We used the dorsal edge of the lateral olfactory tract as a landmark to divide the dorsal and ventral subregions of the APC (Ekstrand et al., 2001). For the three-dimensional view presentation for Figures 5 and 8 the data of c-Fos(+) cell distribution in the OT were rotated 60° around the x-axis from the back view; and for Figure 9, the data of c-Fos(+) cell distribution in the APC were rotated 15° around the x-axis and −30° around the y-axis from the back view.
Statistics.
Comparisons of behavioral index (Fig. 4) and density of c-Fos(+) cells (see Figs. 6⇓⇓–9) were performed among n = 6 mice per group except for air-delivered control groups (n = 4 mice), using one-way ANOVA with Tukey's post hoc test with Graphpad Prism 6 (Tables 1 and 2). For cluster analysis of the distribution of c-Fos(+) cells in the cortex-like compartments of the anteromedial, lateral, central, and posterior domain, and cap compartment (see Fig. 6C), the density parameter for individual mice was subjected to cluster analysis using Ward's linkage method with MATLAB. Differences were considered to be significant at p < 0.05.
Statistical results of one-way ANOVA
Statistical results of Tukey's multiple-comparison test
Results
Domain structures and cytoarchitecture of the mouse OT
As a first step in searching for functional compartmentalization in the OT, we examined the cytoarchitectonic structure of the OT. In the neostriatum and the nucleus accumbens, two types of MSNs are intermingled with each other; dopamine receptor D1-expressing MSNs and dopamine receptor D2-expressing MSNs (Graybiel, 2000). We examined the spatial arrangement of the cytoarchitectonically different subregions of the mouse OT using in situ hybridization with probes for dopamine receptors D1 and D2 (Meador-Woodruff et al., 1991; Weiner et al., 1991; Fig. 1), and immunohistochemistry with anti-DARPP-32 antibody, a marker for MSNs in the neostriatum and accumbens (Ouimet et al., 1984; Fig. 2).

Expression of D1 and D2 mRNAs in the cap, cortex-like compartment, and Islands of Calleja of the mouse OT. A, B, Distribution of D1 mRNA (A) and D2 mRNA (B) in coronal sections of the anterior OT (1.42–1.70 mm anterior of bregma; Franklin and Paxinos (2008)). Dashed lines represent the extent of the OT. Black arrowheads show the cap compartments, white arrowheads show the cortex-like compartments, and arrows show the Islands of Calleja. Boxed areas are magnified and shown at the bottom. Lower left, Cap compartment; lower right, cortex-like compartment and Islands of Calleja. NAc, Nucleus accumbens; LOT, lateral olfactory tract; AC, anterior commissure; D, dorsal; V, ventral; L, lateral; M, medial. C, D, Confocal images of double fluorescent labeling for D1 mRNA and NeuN immunoreactivity (C) and D2 mRNA and NeuN immunoreactivity (D). Left column, Cap compartment; middle column, cortex-like compartment; right column, Islands of Calleja. E, Percentage of D1 mRNA (red) or D2 mRNA (blue) positive cells among NeuN-expressing cells in the cap compartment, cortex-like compartment, or Islands of Calleja. D1 expression in the Islands of Calleja was weaker than that in the cap and cortex-like compartments and is represented by light red. We did not detect D2(+) NeuN-expressing cells in the cap compartment or Islands of Calleja. Each dot represents percentage in one animal and columns show mean (n = 3 mice). F, D1 mRNA expression (left), D2 mRNA expression (middle), and a merged view (right) in the cortex-like compartment. We did not observe D1 and D2 double-positive cells. Scale bars: A, 200 μm; C, D, 10 μm; F, 50 μm.

Expression of DARPP-32 in the cap, cortex-like compartment, and Islands of Calleja of the mouse OT. A, Immunoreactivity for NeuN (left) and DARPP-32 (right) in the anterior OT (top) and central OT (bottom) coronal sections. Arrowheads, Cap compartments; arrows, Islands of Calleja. B–D, Highly magnified view of double-immunostaining with NeuN (B), DARPP-32 (C), and a merged image (D) in an abutted cap compartment (arrowhead) and Islands of Calleja (arrow). Scale bars: A, 200 μm; B, 50 μm.
Previous studies of the mammalian OT have shown mosaic organization in three distinct types of compartments: cortex-like compartments, cap compartments, and Islands of Calleja (Hosoya and Hirata, 1974; Fallon et al., 1978; Millhouse and Heimer, 1984). Cortex-like compartments have a three-layered structure with GABAergic MSNs in layers II and III (Figs. 1A,B, 2A). This type of compartment is widely distributed throughout the OT. As shown in Figure 1A,B, a majority of neurons in cortex-like compartments strongly expressed either dopamine receptor D1 mRNA (57.2 ± 1.4% among NeuN-expressing cells, n = 3 mice, mean ± SD; Fig. 1C,E) or D2 mRNA (44.0 ± 0.7% among NeuN-expressing cells, n = 3 mice, mean ± SD; Fig. 1D,E). These neurons also expressed DARPP-32 (Fig. 2), indicating that they are MSNs. We did not detect double-positive cells that express both D1 and D2 in the cortex-like compartments (Fig. 1F).
Cap compartments are distributed at the surface of the lateral portion of the OT and contain small-sized MSNs (dwarf cells) densely packed in layer II (Hosoya and Hirata, 1974; Millhouse and Heimer, 1984). This dense cell structure typically protrudes toward the surface or lateral edge of the OT (Figs. 1A,B, 2A). In striking contrast to the cortex-like compartments, almost all neurons in cap compartments expressed D1 mRNA and DARPP-32, but not D2 mRNA (Fig. 1C–E).
Islands of Calleja contain densely packed granule cells (Fallon et al., 1978). Most of these neurons weakly expressed D1 mRNA (91.5 ± 0.2% among NeuN-expressing cells, n = 3 mice, mean ± SD; Fig. 1A,C,E) but did not express DARPP-32 (Fig. 2), suggesting that these neurons do not belong to MSNs but are local interneurons (Fallon et al., 1978). The intensity of D1 mRNA signal per cell in the Islands of Calleja was 0.45-fold that in the cortex-like compartment or cap compartment (Fig. 1A). High D1 expression in the cortex-like compartment and cap compartment and low D1 expression in the Islands of Calleja were confirmed by immunohistochemical analysis using anti-D1 antibody (data not shown). Islands of Calleja are located both at the most superficial and deep layers of the OT. The superficially located Islands of Calleja are localized in the anteromedial part of the OT, whereas those in the deep layer are distributed mainly in the central part of the OT (Fig. 2A). Although some parts of the Islands of Calleja abutted on cap compartment, immunostaining for DARPP-32 clearly distinguished immunoreactive cap compartments from immunonegative Islands of Calleja (Fig. 2B–D).
We then made flattened unrolled maps of the OT to determine the spatial arrangement of the cortex-like compartments, cap compartments, and Islands of Calleja (Fig. 3). We defined the area of cap compartments and Islands of Calleja by outlining the dense cell region. The unrolled map showed that cap compartments and Islands of Calleja provided the OT with compartment and domain structures, which were roughly aligned along the mediolateral axis. Given that cocaine or amphetamine self-administration experiments reported that the OT has a functional difference along the mediolateral axis (Ikemoto, 2003; Ikemoto et al., 2005; Shin et al., 2010), we speculated that such cytoarchitectonic compartments and domains in the OT might correlate to function. We thus defined structure-based domain organization in the OT as shown in the followings, as a tentative model to examine possible structure–function relationships in the OT.
The ventral view (Fig. 3B,D) clearly shows that the superficially located Islands of Calleja (shown in magenta) are invariably localized in the anteromedial region, and surround one or two cortex-like compartments (shown in green). We defined this domain with the superficially located Islands of Calleja and surrounded cortex-like compartments as the anteromedial domain (Fig. 3E).

Domain structures of the mouse OT. A, B, Three-dimensional reconstruction of the cap compartment, cortex-like compartment, and Islands of Calleja of the whole mouse OT in the left hemisphere, shown in dorsal view (A) and horizontally flipped ventral view (B). Orange, Cap compartment; magenta, superficial Islands of Calleja; purple, deep Islands of Calleja; green, anteromedial cortex-like compartment; yellow, lateral cortex-like compartment; cyan, central cortex-like compartment; blue, posterior cortex-like compartment. C, D, Three-dimensional reconstruction of the cap compartment (orange), and superficial and deep Islands of Calleja (magenta and purple, respectively) of the whole mouse OT in the left hemisphere in dorsal view (C) and horizontally flipped ventral view (D). Although the Islands of Calleja were divided into superficial and deep portion in our definition, DARPP-32-immunonegative region was continued throughout coronal sections. We speculate that the Islands of Calleja can be seen as one continuous structure (de Vente et al., 2001). E–H, Assignment of OT subregions into 4 domains: (E) anteromedial domain, including anteromedial cortex-like compartment (green) and superficial Islands of Calleja (magenta); (F) lateral domain, including lateral cortex-like compartment (yellow) and cap compartment (orange); (G) central domain, including central cortex-like compartment (cyan) and deep Islands of Calleja (purple); and (H) posterior domain, including posterior cortex-like compartment (blue). A, Anterior; P, posterior; L, lateral; M, medial; ctxl, cortex-like compartment; ICj, Islands of Calleja.
Cap compartments (shown in orange) extended from the anterolateral to the centrolateral parts of the OT, and are spatially arranged to surround a few cortex-like compartments (Fig. 3A–D, yellow). This domain with the cortex-like compartments and surrounding cap compartments will be referred to as the lateral domain (Fig. 3F). In addition to the anteromedial domain and the lateral domain, we tentatively defined two other structural domains in the OT. The central domain of the OT (Fig. 3A–C, cyan) is characteristic in that the deep layer of the cortex-like compartment of this domain is typically adjacent to the deep Islands of Calleja (shown in purple). This domain is located in the centromedial part of the OT, adjacent posterolaterally to the anteromedial domain and medially to the lateral domain (Fig. 3G). In the most posterior part of the OT, cap compartments and Islands of Calleja were scarce (Fig. 3A–D). We defined this cap and Islands of Calleja-scarce cortex-like compartments as the posterior domain (Fig. 3H, blue).
Based on this spatial map of the four structurally defined domains in the OT, together with cortex-like compartments, cap compartments and Islands of Calleja, we then examined whether particular learned odor-induced motivated behaviors activate specific domains and compartments of the OT (see Figs. 5⇓⇓–8).
Learning of distinct motivated responses to the same odor cue
To induce odor-cued specific motivated behaviors in mice, we trained them to associate the same odor with either an attractive sugar reward or an aversive electrical foot shock punishment so that the trained mice showed approaching or aversive responses to the learned odor cue (Tronel and Sara, 2002; Jones et al., 2005). We used amyl acetate or eugenol as a conditioning odor cue because neither agent itself induced clear approach or aversive behaviors in naive mice, and because mice easily learned to associate these odorants with either approach or aversion behaviors (Fig. 4). We prepared two groups of mice with distinct association learning paradigms: an odor-sugar reward association learning group (odor-sugar association) for inducing attractive motivation, and an odor-electrical shock punishment association learning group (odor-shock association) for inducing aversive motivation. We also prepared respective control groups of mice (odor-no sugar association and odor-no shock association) which were exposed to odors without either sugar reward or electrical foot shock punishment (Fig. 4A; for details see Materials and Methods).

Association learning of different behavioral responses to a same odor cue. A, Schedule for odor-sugar reward or odor-shock punishment association learning. Top, Odor-sugar association. Mice were transferred to conditioning cages and presented with odor and sugar four times per day. This procedure took 15–30 min and was repeated for 3 d. The odor-no sugar association group underwent the same procedure except that they were not delivered the sugar. Bottom, Odor-shock association. Mice were transferred to conditioning chambers scented with odor for 30 min and delivered with electrical foot shock at 0.5, 5, 10, and 25 min after the start of odor exposure. The odor-no shock association group underwent the same procedure except that they were not delivered the foot shock. B, Schedule for associated odor-induced behavior assay. After the association learning in (A), mice were kept in home cages for 2 d. Then, they received cue odor or pure air delivery in the home cages for 30 min and were fixed. C, D, Duration of digging behavior in the first 10 min after the cue odor or air delivery to mice. C, AA + No sugar → AA, amyl acetate (AA) delivery to mice which did not receive AA-sugar association; AA + sugar → AA, AA delivery to mice which received AA-sugar association; AA + No shock → AA, AA delivery to mice which did not receive AA-shock association; AA + shock → AA, AA delivery to mice which received AA-shock association; AA + sugar → air, air delivery to mice which received AA-sugar association. D, Eugenol (Eug) was used instead of AA. E, F, Duration of vigilant behavior consisting of freezing, defensive posture, and head retraction from the tube outlet in the first 10 min after the cue odor or air delivery to mice which received or did not receive cue odor-sugar or -shock association. Amyl acetate was used as a cue odor in (E) and eugenol was used as a cue odor in (F). G–J, Duration of rest/sleep (G), grooming (H), locomotive exploration (I), and nonlocomotive body movement (J) in the first 10 min after the cue odor or air delivery to mice. C–J, Each dot represents duration in one animal and the bars show mean (n = 6 mice except for air delivered mice; n = 4 mice). Statistical significance was calculated using one-way ANOVA with post hoc Tukey's test. **p < 0.01; ***p < 0.001; ns, not significant.
To minimize differences in OT activity due to nutritional state or housing conditions, all groups of mice underwent the same ad libitum feeding (for 1 day) and fasting (for 18–20 h) in the same housing conditions after the association learning. We then examined the behavioral responses of these mice to the cue odor. To avoid the possible effect of contextual cues of the environment used for association learning, the cue odor was delivered into the home cage via a tube whose end was implanted in the bottom of the home cage and covered by bedding. At 30 min after odor delivery, the mice were deeply anesthetized and fixed for histological analysis (Fig. 4B).
Although we recorded mouse behavior throughout the experimental timeframe, we especially assessed mouse behavior for the first 10 min after cue odor delivery because mice showed prominent odor-induced behavioral responses during this time period. Mouse behavior was categorized into the following six indexes: digging, vigilant behavior, rest/sleep, grooming, locomotive exploration, and nonlocomotive body movement (Fig. 4C–J; see Materials and Methods for the definition of each behavior).
Among them, digging was considered an index for attractive motivation, for the following reasons. First, digging was robust among all odor-sugar associated mice examined and similar to the behavior observed during odor-sugar association training. Second, digging behavior was significantly suppressed in food-supplied, satisfied mice (data not shown).
Vigilant behavior was categorized as an index of aversive motivation. Vigilant behavior was represented by freezing, a typical aversive and fear behavior (Jones et al., 2005), as well as sniffing the odor outlet followed by head retraction and alert exploration with distancing from the odor outlet, both of which are odor avoiding behaviors.
The odor-sugar association learning significantly increased digging response (Fig. 4C,D) and did not increase vigilant response (Fig. 4E,F) to both the amyl acetate and eugenol cues. In contrast, odor-shock association learning significantly increased vigilant response (Fig. 4E,F) and did not increase digging response (Fig. 4C,D) to both the amyl acetate and eugenol cues.
To confirm that the occurrence of digging and vigilant behavior was odor cue-driven, we also checked the behavior of trained mice without odor delivery, using pure air delivery after the odor-sugar or odor-shock association learning. Mice trained to associate amyl acetate with sugar or shock and then delivered pure air (air-control mice) showed significantly less digging behavior or vigilant behavior than the odor-delivered mice (Fig. 4C,E), indicating that the motivated behavior of the odor-delivered mice was triggered mostly by odor cues rather than contextual cues. Mice trained to associate eugenol with sugar or shock and then delivered pure air showed similar behaviors (data not shown). Although mice delivered only air mostly slept or rested during the observation timeframe (Fig. 4G), mice delivered the no unconditioned stimulus (US)-associated odor cues showed little rest/sleep behavior and significant grooming, exploration behavior, and body movement, suggesting that the no US-associated odor group actually sensed the odor cue (Fig. 4H–J).
Activation of distinct domains of the OT in mice showing different behavioral responses to the same odor cue
We then examined neuronal activity in the whole OT by c-Fos mRNA expression following behavioral responses to delivery of the conditioned odor cues (Figs. 5⇓–7). Serial coronal sections of the OT (20 μm thickness) from its anterior tip to the posterior end were obtained and sections were selected at the rate of one in every five to examine c-Fos mRNA expression. In the individual coronal sections (∼20 sections), distribution of each c-Fos(+) cell was reconstructed in a flattened OT map and its location was assigned based on the aforementioned domains and compartments (Fig. 3), namely cortex-like compartments of the anteromedial, lateral, central, and posterior domains; cap compartment in the lateral domain; superficial Islands of Calleja in the anteromedial domain; and deep Islands of Calleja in the central domain.

Distinct distribution of c-Fos mRNA(+) cells among mice showing different motivated behavioral responses to a conditioned odor cue. A, Distribution of c-Fos(+) cells in a coronal section of the anterior OT counterstained with nuclear fast red (1.42–1.70 mm anterior of bregma; Franklin and Paxinos (2008)). Top row, Amyl acetate delivery to mice which did not receive amyl acetate-sugar association (left end), to mice which received amyl acetate-sugar association (second from left), to mice which did not receive amyl acetate-shock association (second from right), and to mice which received amyl acetate-shock association (right end). Middle row, Eugenol delivery to mice which did not receive eugenol-sugar association (left end), to mice which received eugenol-sugar association (second from light), to mice which did not receive eugenol-shock association (second from right), and to mice which received eugenol-shock association (right end). Bottom row, Air delivery to mice which received amyl acetate-sugar association (left), and to mice which received amyl acetate-shock association (right). B, Three-dimensionally reconstructed view of distribution of c-Fos(+) cells in the whole OT. Experimental condition for each picture in B, respectively, corresponds to that in A. Each panel represents a data from one OT of one mouse. Each c-Fos(+) cell was represented by a single dot with the color as follows: orange, cap compartment; magenta, superficial Islands of Calleja; purple, deep Islands of Calleja; green, anteromedial cortex-like compartment; yellow, lateral cortex-like compartment; cyan, central cortex-like compartment; blue, posterior cortex-like compartment. Scale bar (in A), 200 μm. D, Dorsal; V, ventral; L, lateral; M, medial; A, anterior; P, posterior.
First, we examined the number of c-Fos-expressing MSNs, principal neurons in the OT, in MSN-containing compartments (cortex-like compartments and cap compartments, but not the Islands of Calleja; Fig. 6). To clearly show the relation between motivated behaviors and distribution of c-Fos-expressing MSNs, we aligned the data of the density of c-Fos(+) cells in Figure 6A,B, according to the association groups of mice (Fig. 6A, sugar association, B, shock association) and the used cue odors (left graphs, amyl acetate; right graphs, eugenol). The same data were differently aligned in Figure 6D–F according to the OT compartments (4 cortex-like compartments or cap compartment), including all the data of mice with distinct experimental conditions.

c-Fos activation of MSNs in the OT domains represents motivated responses. A, B, Density of c-Fos(+) cells in the cortex-like compartments (ctxl) and cap compartment. Comparison was made between mice that did and did not associate odor-cue with sugar (A), and between mice that did and did not associate odor-cue with shock (B). Amyl acetate (AA; left) or eugenol (Eug; right) was used as a cue odor. C, Cluster analysis of distribution patterns of c-Fos(+) cells based on their density in the 5 OT subregions shown in the following (D–H). The hierarchical tree grouped 48 mice into three major clusters according to their similarity in c-Fos(+) cell distribution patterns. These three clusters coincide with the shock-associated group, sugar-associated group and control group, which showed less digging or vigilant behavior responses, rather than types of cue odors. D–H, In these figures, the same data in A, B were realigned according to the OT compartments, including all the data of mice with distinct experimental conditions. Density of c-Fos(+) cells in the cortex-like compartment (ctxl; D, E, G, H) and cap compartment (F) are shown. In A, B and D–H, each dot represents cell density in one animal and bars show mean (n = 6 mice except for air delivered mice; n = 4 mice). Statistical significance was calculated among six or four groups of mice using one-way ANOVA with post hoc Tukey's test for each compartment. Note that statistical indications in A, B are copied from those in D–H, and are based on the comparison among six or four groups of mice. *p < 0.05; **p < 0.01; ***p < 0.001; ns, not significant.
In both the odor-no sugar association and odor-no shock association groups, the whole OT showed sparse distribution of c-Fos(+) cells with both the amyl acetate and eugenol cues (Figs. 5, 6A,B, open and filled black circles and squares). In the odor-sugar association group, a large increase in c-Fos(+) cells was observed in the cortex-like compartment of the anteromedial domain with both odor cues (Figs. 5, 6A, green circles and squares). In contrast, slight increase was observed in the lateral, central or posterior cortex-like compartments with both odor cues (Figs. 5, 6A). These results suggest that preferential activation of the cortex-like compartment of the anteromedial domain of the OT occurs in association with the odor-cued digging behavior.
In the odor-shock association group, a dramatic increase in c-Fos(+) cells was found in the cap compartment of the lateral domain, regardless of the types of odor used for the cue (Figs. 5, 6B, orange circles and squares). The cortex-like compartments also showed an increase in the number of c-Fos(+) cells with both odor cues (Figs. 5, 6B). These findings suggest that prominent activation of the cap compartment in the lateral domain occurs in association with odor-cued vigilant behavior.
It is notable that the spatial distribution of c-Fos(+) cells in the cortex-like compartments was quite different between the odor-sugar association group and odor-shock association group. In the anteromedial cortex-like compartment, an increase in c-Fos(+) cells was more prominent in the odor-sugar association group than in the odor-shock association group (Fig. 6D). In the lateral cortex-like compartment, in contrast, an increase in c-Fos(+) cells was more prominent in the odor-shock association group than odor-sugar association group (Fig. 6E). Increases in c-Fos(+) cells in the central and posterior cortex-like compartments did not significantly differ between the two groups (Fig. 6G,H). Such spatial difference in c-Fos(+) cell activation between odor-sugar and odor-shock association groups represents different types of motivated behaviors (attractive or aversive), rather than a differing extent of ubiquitous activation of the entire OT that might occur depending on the amount of sensed odor or general arousal level of the mice. We did not observe significant difference in the number of c-Fos(+) cells between the odor-no sugar association and odor-no shock association groups in any domain (Fig. 6D–H), supporting the idea that the difference in association learning schedule (times of odor exposure, days of training, and food restriction) did not primarily influence the odor-induced c-Fos expression.
The air-delivered control group showed a very small number of c-Fos(+) cells in the whole OT (for mice associated with AA, Figs. 5, 6D–H, black triangles; for mice associated with Eug, data not shown), supporting the idea that activation of the OT accompanies odor-induced motivated behaviors. In addition, because both the odor-no sugar associated group and odor-no shock associated group, which seemed to actually sense the odor cue (Fig. 4), showed sparse c-Fos activation in the whole OT (Figs. 5, 6D–H, open and filled black circles and squares), odor sensation and concomitant exploration behavior per se did not induce strong c-Fos activation in the OT.
To further examine the possibility that distinct compartments and domains in the OT represent motivated behaviors rather than types of odors, we performed cluster analysis of the c-Fos activity of MSNs based on the density of c-Fos(+) MSNs across the five MSN-containing compartments (Fig. 6C). A total of 48 mice, which received cue odors, were clustered into three major groups that coincided with the odor-shock association group, odor-sugar association group, and control groups including the odor-no sugar association and odor-no shock association groups. The clear clustering of the three major groups supports the idea that activation of the specific compartment and domain of the OT represents odor-induced motivated behaviors rather than the odor per se.
Granule cells in the Islands of Calleja also showed c-Fos activation in mice showing motivated behaviors (Figs. 5, 7). The data of the density of c-Fos(+) cells were aligned according to the association groups of mice and used cue odors (Fig. 7A,B). The same data were differently aligned according to the OT domains, including all the data of mice with distinct experimental conditions (Fig. 7C,D). The number of c-Fos(+) cells in the superficial Islands of Calleja of the anteromedial domain increased in both the odor-sugar association group and odor-shock association group (Fig. 7A,B). The air-delivered control group showed a very small number of c-Fos(+) cells in the superficial and deep Islands of Calleja (Fig. 7C,D, black triangles). These results suggest that granule cells in the anteromedial domain are also activated in association with motivated behaviors, whereas behavior type-specific activation was not evident in the present analysis.
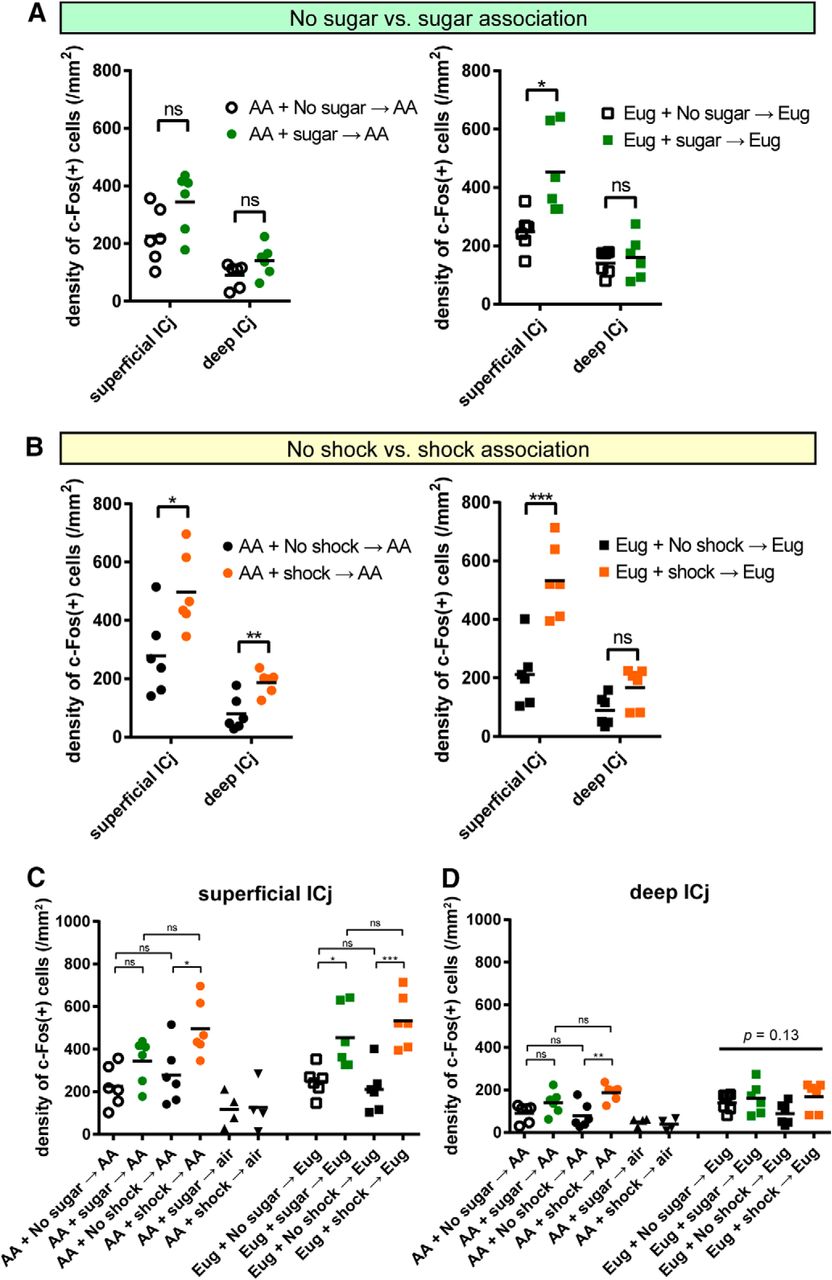
Granule cells in the Islands of Calleja also showed motivated behavior-dependent c-Fos activation. A, B, Density of c-Fos(+) cells in the superficial and deep Islands of Calleja. Comparison was made between mice that did and did not associate odor cue with sugar (A), and between mice that did and did not associate odor cue with shock (B). Amyl acetate (AA; left) or eugenol (Eug; right) was used as a cue odor. C, D, In these figures, the same data in A, B were realigned according to the compartments of Islands of Calleja, including all the data of mice with distinct experimental conditions. Density of c-Fos(+) cells in the superficial (C) and deep (D) Islands of Calleja are shown. Each dot represents cell density in one animal and bars show mean (n = 6 mice except for air delivered mice; n = 4 mice). Statistical significance was calculated among six or four groups of mice using one-way ANOVA with post hoc Tukey's test for each compartment. Note that statistical indications in A, B are copied from those in C, D, and are based on the comparison among six or four groups of mice. *p < 0.05; **p < 0.01; ns, not significant.
Distinct activation of D1 and D2 neurons in mice showing different behavioral responses to the same odor cue
MSNs in the cortex-like compartments of the OT consist of D1 neurons and D2 neurons, whereas MSNs in the cap compartments consist of D1 neurons only (Fig. 1). A functional difference between D1 and D2 neurons in the nucleus accumbens with attractive or aversive learning has been reported (Hikida et al., 2010). To address whether D1 and D2 neurons in the OT are differentially involved in controlling motivated responses, we examined the expression of D1 and D2 mRNAs in individual c-Fos(+) cells by double-fluorescent in situ hybridization in mice showing attractive or aversive motivated responses to the cue odors (Fig. 8). Because remarkable c-Fos activation was seen in the anteromedial and lateral domains, the analysis was focused on these domains. Given the similarity in behavior and c-Fos activation between the “odor + no sugar” group and odor + no shock group, we used the data for the odor + no shock group as representative control and described them as “odor + no US.”

Distinct composition of D1 neurons and D2 neurons in the c-Fos(+) cells of the anteromedial cortex-like compartment and lateral domain of the OT in mice showing different behavioral response to a conditioned odor cue. A, B, Confocal images of double-fluorescent in situ hybridization for D1 and c-Fos mRNAs (A) and D2 and c-Fos mRNAs (B) in the cortex-like compartment. Magenta and cyan arrowheads are double-positive cells and white arrowheads are c-Fos single-positive cells. C, Three-dimensionally reconstructed view of distribution of D1(+) c-Fos(+) cells and D2(+) c-Fos(+) cells in the anteromedial cortex-like compartment. Top row, D1(+) c-Fos(+) cells (magenta dots) and D1(−) c-Fos(+) cells (white dots) of mice with No US-associated odor delivery (left), sugar-associated odor delivery (middle), and shock-associated odor delivery (right) are shown. Bottom row, D2(+) c-Fos(+) cells (cyan dots) and D2(−) c-Fos(+) cells (white dots) of mice with no US-associated odor delivery (left), sugar-associated odor delivery (middle), and shock-associated odor delivery (right) are shown. D, E, Density of D1(+) c-Fos(+) cells (D) and D2(+) c-Fos(+) cells (E) in the anteromedial cortex-like compartment. F, Three-dimensionally reconstructed view of distribution of D1(+) c-Fos(+) cells and D2(+) c-Fos(+) cells in the lateral cortex-like compartment. Top row, D1(+) c-Fos(+) cells (magenta dots) and D1(−) c-Fos(+) cells (white dots). Bottom row, D2(+) c-Fos(+) cells (cyan dots) and D2(−) c-Fos(+) cells (white dots). Data of the OT of mice with no US-associated odor delivery (left), sugar-associated odor delivery (middle), and shock-associated odor delivery (right) are shown. G, H, Density of D1(+) c-Fos(+) cells (G) and D2(+) c-Fos(+) cells (H) in the lateral cortex-like compartment. I, Confocal images of double fluorescent in situ hybridization for D1 and c-Fos mRNAs (top) and D2 and c-Fos mRNAs (bottom) in the cap compartment of mice with the shock-associated odor delivery. J, K, Density of D1(+) c-Fos(+) cells (J) and D2(+) c-Fos(+) cells (K) in the cap compartment. We did not detect D2(+) c-Fos(+) cells in the cap compartments. In D, E, G, H, J, and K, circle symbols represent the data from mice that received amyl acetate delivery, and square symbols represent the data from mice that received eugenol delivery. The data for the odor + no shock group were used as the representative control and are shown as odor + no US. **p < 0.01; ***p < 0.001; ns, not significant (n = 6 mice, one-way ANOVA with post hoc Tukey's test). A, Anterior; P, posterior; L, lateral; M, medial. Scale bars: A, 10 μm; I, 50 μm.
A significant increase in c-Fos and D1 double-positive cells (D1(+) c-Fos(+) cells) was observed in the cortex-like compartment of the anteromedial domain in the odor-sugar association group (Fig. 8C,D) and in the cortex-like compartment of the lateral domain in odor-shock association group (Fig. 8F,G). These results suggest that activation of D1 neurons in the anteromedial and lateral cortex-like compartments represents attractive and aversive motivation, respectively. It is notable that the cap compartment of the lateral domain of the odor-shock association group showed a remarkable increase in c-Fos(+) cells (Figs. 5⇑–7), and we confirmed that these cells are D1(+) neurons (Fig. 8I–K).
In the odor-shock association group, an increase in the number of c-Fos(+) and D2 double-positive cells (D2(+) c-Fos(+) cells) was also seen in the cortex-like compartment of the anteromedial domain (Fig. 8C,E). The results suggest that D2 neurons in the anteromedial domain, which seems to represent attractive motivation, receive aversive odor signals and play a modulatory role in attractive motivation. We did not observe a significant increase in the number of D2(+) c-Fos(+) cells in the lateral domain of the odor-sugar association group (Fig. 8F,H).
We also quantified the density of D1(-) c-Fos(+) cells and D2(-) c-Fos(+) cells in both anteromedial and lateral domains (Fig. 8C,F, white dots), and the density of D1(−) c-Fos(+) cells and D2(−) c-Fos(+) cells corresponded well to that of D2(+) c-Fos(+) cells and D1(+) c-Fos(+) cells, respectively (data not shown). This observation confirmed the above conclusion and supported the notion that c-Fos(+) cells in the cortex-like compartment are MSNs that express either D1 or D2 (Fig. 1).
Spatial distribution of c-Fos(+) cells in the APC showed difference in mice showing different behavioral responses to the same odor cue
The OT receives olfactory sensory information from the OB and olfactory cortex. Among subareas of the olfactory cortex, the APC sends association axons massively to the OT (Haberly and Price, 1978a,b), and projection from subregions of the APC to subregions of the OT has been reported (Luskin and Price, 1983). To examine whether distinct learned odor-induced motivated behaviors accompany different subregional activation of the APC, we mapped c-Fos expression in the APC in the same groups of mice analyzed for OT c-Fos activation that showed learned odor-induced approach or aversive behavior (Fig. 9). We used the data for the odor + no shock group as the representative control and described them as “odor + no US.”

Different subregional distribution of c-Fos activated cells in the APC in response to sugar- or shock-associated cue odor delivery. A, Distribution of c-Fos(+) cells in a coronal section of the APC counterstained with nuclear fast red (1.42–1.70 mm anterior of bregma, Franklin and Paxinos (2008)). Top row, Amyl acetate delivery to mice which did not receive sugar or shock association (left), to mice which received amyl acetate-sugar association (middle), and to mice which received amyl acetate-shock association (right). Bottom row, Eugenol delivery to mice which did not received sugar or shock association (left), to mice which received eugenol-sugar association (middle), and to mice which received eugenol-shock association (right). Arrowheads, dorsal edge of the lateral olfactory tract (LOT). Dorsal edge of the LOT was used as a landmark to divide the dorsal and ventral subregions of the APC. B, Three-dimensionally reconstructed view of distribution of c-Fos(+) cells in the whole APC. Experimental condition for each picture in B, respectively, correspond to those in A. Each c-Fos(+) cell was represented by a single dot with the color as follows: light green, dorsal APC; light yellow, ventral APC. C, Ratio of density of c-Fos(+) cells in the dorsal APC over that in the ventral APC. The data for the odor + no shock group were used as the representative control and are shown as odor + No US. **p < 0.01; ***p < 0.001; ns, not significant (n = 6 mice, one-way ANOVA with post hoc Tukey's test). Scale bar: A, 200 μm. D, Dorsal; V, ventral; L, lateral; M, medial; A, anterior.
We found that although c-Fos(+) cells were widely distributed in the APC of both groups, the density of c-Fos(+) cells differed in different parts of the APC between the group showing approach behavior and the group showing aversive behavior (Fig. 9A,B). c-Fos(+) cells in the group showing approach behavior tended to be distributed more dorsally while those in the group showing aversive behavior were distributed more ventrally in the APC. The ratio of c-Fos(+) cell density in the dorsal versus ventral APC significantly differed between the odor-sugar association group and odor-shock association group for both amyl acetate and eugenol cues (Fig. 9C). These results raise the possibility that activation of different subpopulation of APC neurons in learned odor-induced approach and aversive behaviors contributed to the domain-specific activation of the OT.
Discussion
Structural–functional motivation domains in the olfactory tubercle
This study showed that specific domains in the mouse OT represent distinct learned odor-induced motivated behaviors. We divided the OT into four domains based on the spatial arrangement of the cap compartment and Islands of Calleja, which are characteristic structures of the OT and which provided the OT with domain structures. Thus-defined domains correlated well to functional domains: regardless of odorant type, D1(+) MSNs in the anteromedial domain were activated when mice showed approaching responses to sugar-associated odor cues, whereas D1(+) MSNs in the lateral domain were activated when mice showed aversive responses to shock-associated odor cues (Fig. 10). Although odorant receptor maps in the OB represent molecular features of odorants (Mori and Sakano, 2011) and the OB sends direct axonal projection to the OT, our data indicate that the OT has a spatial map of functional domains, each representing odor-induced motivated behaviors rather than odors.

OT as a hypothetical switchboard for learned odor-induced motivated behaviors. A schematic diagram illustrating motivation domains in the OT. Following approach behavior in response to a sugar reward-associated odor, c-Fos activation was observed in D1(+) MSNs (red) in the cortex-like compartment of the anteromedial domain (green oval). Following aversive behavior in response to a shock punishment-associated odor, c-Fos activation was observed in D1(+) MSNs (red) in the cap compartment (orange oval) and cortex-like compartment (yellow oval) of the lateral domain, and D2(+) MSNs (blue) in the cortex-like compartment of the anteromedial domain. GABAergic D1(+) MSNs may send their axons to GABAergic neurons in the topographically corresponding areas of the ventral pallidum (VP) which may tonically inhibit motivated behaviors. D1(+) MSNs and D2(+) MSNs may reciprocally inhibit each other via their recurrent axon collaterals. ctxl, Cortex-like compartment; A, anterior; P, posterior; L, lateral; M, medial.
These observations are consistent with a recent electrophysiological study showing that the OT encodes odor valence rather than odor identity (Gadziola et al., 2015). The increased c-Fos expression in MSNs in our study is presumably due to their increased firing. It is important for future studies to determine the domain and neuronal type selectivity of OT neuron firing during odor-induced behaviors.
In the anteromedial domain of the OT, D1(+) MSNs in the cortex-like compartment were activated by sugar-associated odors (Figs. 5⇑⇑–8), suggesting that the anteromedial domain represents learned odor-induced attractive motivated behaviors, including digging behavior to obtain foods. Because the anteromedial OT is anatomically bridged to the anteromedial part of the nucleus accumbens shell, which elicits appetitive behavior (Reynolds and Berridge, 2002, 2003), we speculate that the complex of the anteromedial domain of the OT and anteromedial part of the accumbens shell participate in the control of appetitive behavior. mRNA of cocaine- and amphetamine-regulated transcript (CART), which is related to feeding behavior, is strongly expressed in the anteromedial OT, whereas other domains express little CART mRNA (Douglass et al., 1995; Zhang et al., 2012). In addition, the idea that the anteromedial OT is involved in reward seeking is consistent with the report that self-administration of cocaine or amphetamine in the anteromedial but not posterolateral part of the OT facilitated hedonic self-administration (Ikemoto, 2003; Ikemoto et al., 2005; Shin et al., 2010).
In the lateral domain of the OT, D1(+) MSNs in the cap compartment and cortex-like compartment were activated by shock-associated odors (Figs. 5⇑⇑–8), suggesting that the lateral domain represents learned odor-induced aversive motivated behaviors, including vigilant behavior for avoiding foot shock. In particular, the cap compartment of the lateral domain receives direct axonal inputs from OB tufted cells that respond to the predator odor trimethylthiazoline and spoiled food odor 2-methylbutiric acid (Igarashi et al., 2012), which both induce innate aversive behaviors (Kobayakawa et al., 2007). These observations suggest that the cap compartment is activated by both innate and learned aversion-inducing odors and participates in the induction of aversive motivated behaviors.
It is currently unknown whether the OT encodes odor-induced behaviors other than attraction for foods or aversion from dangers in a domain-like organization. Further studies are necessary to examine how other types of motivated behaviors are represented in the OT. Such other motivated behaviors might involve the central and posterior domains, which did not show behavior type-specific c-Fos activation in our experiments (Figs. 5⇑–7).
Possible neuronal pathways from the OT domains that induce specific motivated behaviors
GABAergic D1(+) MSNs in the OT are considered to project to GABAergic neurons in the rostral extension of the ventral pallidum (rVP; Heimer et al., 1987; Zhou et al., 2003), which send axons to the thalamus, lateral hypothalamus, and VTA (Zahm and Heimer, 1987; Groenewegen et al., 1993). This implies that activation of D1(+) MSNs in the OT disinhibits the thalamus, lateral hypothalamus and VTA. MSNs in the anteromedial domain project to the medial part of the rVP (mrVP), whereas those in the lateral domain project to the lateral part of the rVP (lrVP; Heimer et al., 1987; Fig. 10). This topographic projection suggests that the activation of D1(+) MSNs in the anteromedial OT induces approach behavior via the mrVP-thalamus/hypothalamus/VTA pathway, whereas activation of D1(+) MSNs in the lateral OT induces aversive behaviors via the lrVP-thalamus/hypothalamus/VTA pathway. A functional difference in specific VP-VTA pathways is reported, showing that the rostral but not caudal VP-VTA pathway is involved in cue-induced cocaine-seeking behavior (Mahler et al., 2014).
We also observed that the shock-associated odor cues induced c-Fos activation of D2(+) MSNs in the anteromedial OT (Fig. 8). Food-seeking behavior is typically inhibited in the copresence of an odor predicting danger (Sakamoto et al., 2011). In analogy with the direct and indirect pathways in the neostriatum (Graybiel, 2000), we speculate that D2(+) MSNs in the anteromedial domain receive the shock-associated odor signals and may modulate the D1(+) MSN pathway in the anteromedial domain (Fig. 10). Granule cells in the Islands of Calleja in the anteromedial OT were also activated by the sugar- or shock-associated odor cues (Fig. 7). These might be involved in the modulation of MSN activity in this domain.
Possible neuronal circuit mechanisms for the learned odor cue-induced activation of the specific OT domains
How is the learned odor-cue information transmitted to the specific domains in the OT? The piriform cortex is thought to be responsible for the memory of odor objects (Neville and Haberly, 2004; Choi et al., 2011; Wilson and Sullivan, 2011). We found that learned odor-induced distinct motivated behaviors accompanied overlapping but different subregional distribution of activated cells in the APC (Fig. 9). The activation patterns of the OT and APC in the approach and aversive behaviors are consistent with the topographical axonal projection from the APC to the OT: the dorsal APC tends to project to the medial OT whereas the ventral APC tends to project to the lateral OT (Luskin and Price, 1983). The sugar-associated odor cues may be transmitted to the anteromedial OT via the dorsal APC, whereas the shock-associated odor cues might transmit to the lateral OT via the ventral APC. Further electrophysiological experiments are necessary to examine this possibility.
Domain-specific activation of the OT may involve topographic dopaminergic inputs from the VTA. The medial VTA projects to the medial portion of the ventral striatum, including the anteromedial OT, whereas the lateral VTA projects to the lateral portion of the ventral striatum, including the lateral OT (Ikemoto, 2007). Moreover, two types of dopamine neuron, the reward coding and saliency coding types tend to be located in the medial and lateral portions of the VTA, respectively (Bromberg-Martin et al., 2010). We speculate that rewarding sugar eating may induce activation of the medial VTA, which enhances the responsiveness of D1(+) MSNs in the anteromedial OT to the cue odor. In contrast, noxious foot shock may induce activation of the lateral VTA, which enhances the responsiveness of D1(+) MSNs in the lateral OT to the cue odor.
OT as a switchboard transforming odor signals to a variety of motivated behaviors
The central olfactory system transforms external odor information into a variety of motivated responses (Mori, 2014). Our results showed that domains of the OT represent distinct motivated behaviors (Fig. 6) and that D1(+) MSNs and D2(+) MSNs in each domain are activated differentially during distinct motivated behaviors (Fig. 8). Because D1(+) MSNs and D2(+) MSNs may reciprocally inhibit each other via their recurrent axon collaterals (Bolam et al., 1983; Yung et al., 1996), we speculate that each OT domain computes incoming odor information through the D1(+) MSN-D2(+) MSN interaction to determine whether the represented motivated behavior is activated or inhibited (Fig. 10). Therefore, the OT may play a key role as a switchboard that connects numerous olfactory inputs with a repertoire of motivated behaviors. This idea is consistent with the notion that the ventral striatum plays a pivotal role in motivation processing in relation to reward and danger (Berridge and Kringelbach, 2013).
The OT receives odor information from the OB via several pathways. The shortest and simplest pathway is the direct axonal projection from the OB. As mentioned previously, tufted cells that respond to predator or spoiled food odor project axons to the cap compartment of the lateral domain (Igarashi et al., 2012), which may mediate rapid aversive responses to odors predicting dangers.
In addition to the direct pathway, the OT receives massive axonal projection from areas of the olfactory cortex (Haberly and Price, 1978a,b; Neville and Haberly, 2004; Santiago and Shammah-Lagnado, 2004), as well as from the orbitofrontal cortex, agranular insular cortex, and medial prefrontal cortex (Berendse et al., 1992), which receive odor information directly or indirectly from the olfactory cortex. We speculate that odor-reward or odor-danger association learning may cause plastic changes in the functional connectivity of these olfactory cortex and prefrontal cortex pathways to each motivation domain of the OT. Therefore, this study provides a structural and functional framework for understanding the neuronal mechanisms for odor-reward and odor-danger association learnings that lead to odor-induced specific motivated behaviors.
Footnotes
This work was supported by the Kato Memorial Bioscience Foundation, Narishige Neuroscience Research Foundation, Takeda Science Foundation, Grant-in-Aid for Young Scientists (B) (25830032), and Grant-in-Aid for Scientific Research on Innovative Areas (26120709) to K. Murata; a Grant-in-Aid for Scientific Research (A) (23240046) to K. Mori; and by a Grant-in-Aid for Scientific Research (B) (24300118) and Grant-in-Aid for Scientific Research on Innovative Areas (25115708 and 26115506) to M.Y. We thank Dr H. Takebayashi and Dr K. Kobayashi for plasmids for in situ hybridization probes, Dr Y. Yoshihara for double in situ hybridization protocols, and the members of the Mori laboratory for valuable discussion.
The authors declare no competing financial interests.
- Correspondence should be addressed to either Dr Kensaku Mori or Dr Masahiro Yamaguchi,, Department of Physiology, Graduate School of Medicine, the University of Tokyo, 7-3-1 Hongo, Bunkyo-ku, Tokyo, 113-0033, Japan, moriken{at}m.u-tokyo.ac.jp or yamaguti{at}m.u-tokyo.ac.jp


