

Article Figures & Data
Figures
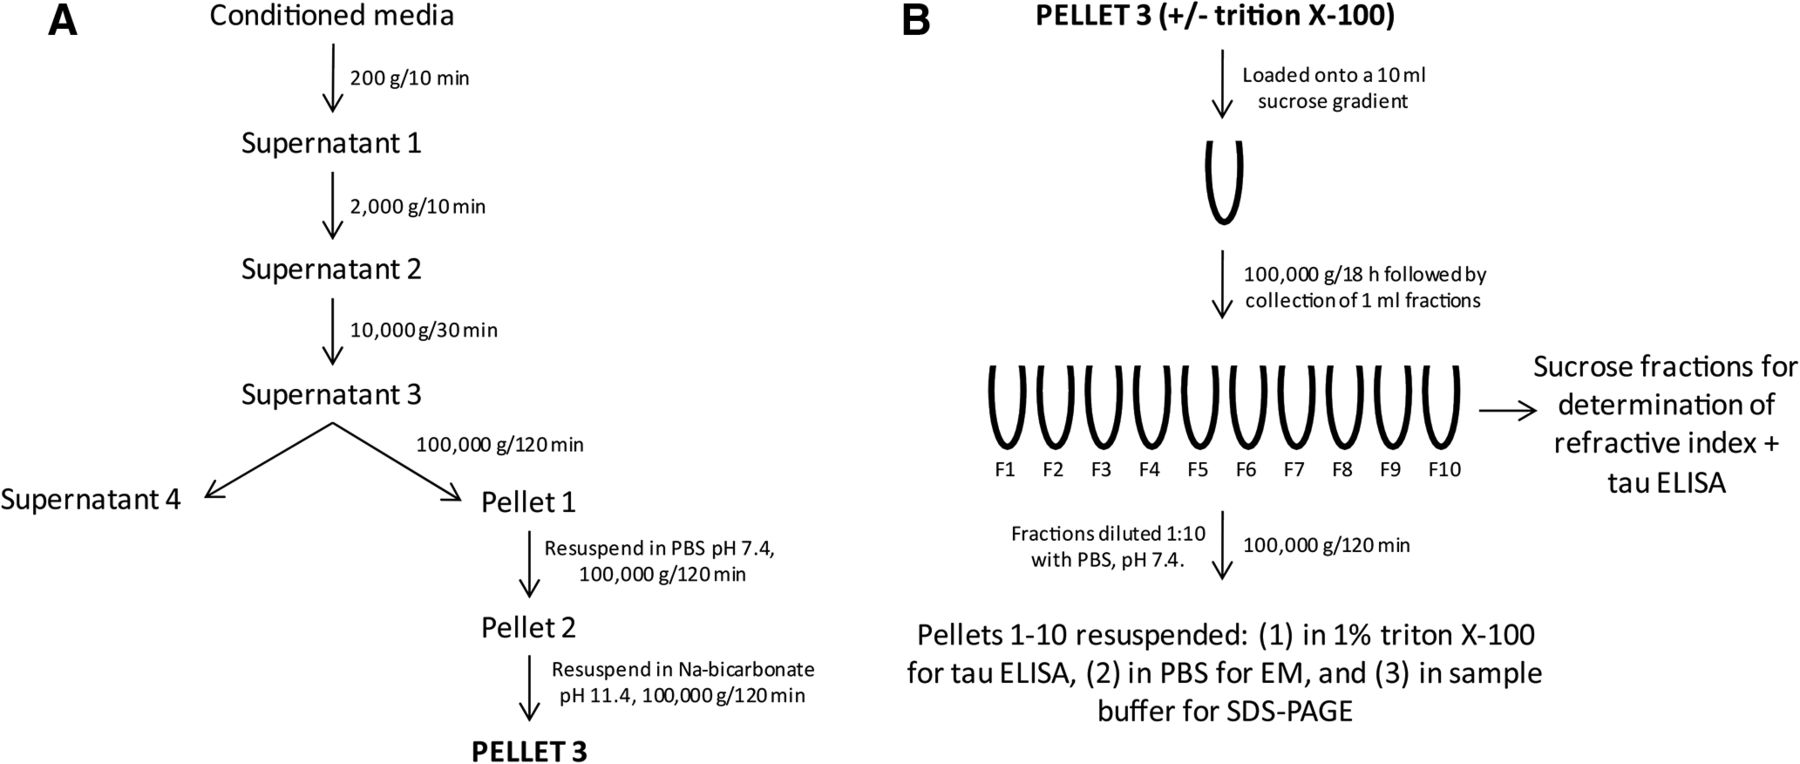
- Figure 1.
Centrifugation conditions used for isolation of exosomes from conditioned medium. A, Immediumtely after collection, the medium was subjected to three low-speed spins to remove cells and cellular debris and exosomes were pelleted by centrifugation at 100,000 × g for 2 h. Pellet 1 was resuspended in PBS and then centrifuged and Pellet 2 was washed in sodium-bicarbonate, pH 11.4, to remove proteins adventitiously associated with the exosomal membranes. B, Crude exosomes (Pellet 3) were treated with or without Triton X-100, loaded onto a 0.25–2.3 m sucrose gradient, and centrifuged at 100,000 × g for 18 h. Ten 1 ml fractions were collected, diluted 1:10 in PBS, centrifuged at 100,000 × g for 2 h, and the pellets analyzed.
- Figure 2.
Characterization of β3T and tau ELISAs. A, Calibration curve of β3T standard. The ELISA displays an LLOQ of ∼125 pg/ml. B, The BT2-Tau5 ELISA detects FL rodent adult tau 430 (■) and human tau 441 (●) with an LLOQ of ∼30 pg/ml, but does not detect K19. C, K9JA-K9JA ELISA detects FL rodent adult tau (■), human tau 441 (●), and K19 (▴) with an LLOQ of ∼30 pg/ml. D, K9JA-Tau46 ELISA detects FL rodent adult tau (■) and human tau 441 (●) with an LLOQ of ∼125 pg/ml, but does not detect K19. E, HJ9.4-Tau46 ELISA detects FL rodent adult tau (■) and the Tau12-Tau46 ELISA detects human tau 441 (●). In each case, the LLOQ is 125 pg/ml. Each data point is the average ± SD of three replicates. Where error bars are not visible, the SD is smaller than the size of the symbol. See Figure 3 for the location of mAb epitopes and the tau species predicted to be detected by each assay.
- Figure 3.
Schematic representation of FL tau and potential fragments detected by ELISA. N-terminal inserts are in yellow and CT repeat domains are in blue. The epitopes for the antibodies used in each ELISA are indicated by a black line and the amino acid numbering of the epitope boundaries is indicated. Sequences of minimal predicted length recognized by a given ELISA are shown in filled boxes and parts of tau fragments of uncertain sequence are indicated with a dashed line.
- Figure 4.
Healthy N2a cultures express low levels of tau, some of which can be detected in conditioned medium. A, Bright-field image of N2a cells after 24 h of conditioning. Scale bar, 50 μm. Because the cells were almost confluent and it was difficult to distinguish one cell from another, an edge of lower density is shown. B, Western blot analysis of lysates (12.5 μg of total protein/lane) treated with or without calf intestine alkaline phosphatase (CIP) using anti-tau antibodies HJ9.4 (aa 7–13), K9JA (aa 243–441), Tau46 (aa 404–441), and the negative control antibody 46–4. Recombinant rodent tau 431 (Rec), 10 ng, and CIP-treated mouse brain extract (Mse), 2.5 μg of total proteins, were loaded as controls and tau bands are indicated with a bracket. CIP treatment was used as an additional control because dephosphorylated tau tends to migrate a little faster. C, Medium collected from N2a cultures after 6, 24, and 48 h was analyzed for the presence of tau, LDH, and β3T. Percentage release was calculated according to the following equation: ([analyte in CM])/([analyte in CM] + [analyte in lysate]) × 100. D, Summary of five separate N2a-conditioning experiments reveals that tau is detected in CM at levels disproportionate to cytoplasmic marker proteins. Note that no β3T was detected in medium conditioned for 24 h.
- Figure 5.
The majority of tau in N2a-conditioned medium is free-floating and unaggregated, but a small amount is present in exosomes. The vast bulk of extracellular tau remains in solution after high-speed centrifugation; nonetheless, a small detectable fraction is pelleted and found inside exosomes. A, CM was processed as described in Figure 1A and the 100,000 × g pellet was treated with or without detergent (to disrupt exosomal membranes) before analysis with the BT2-Tau5 ELISA. High-speed centrifugation did not alter the levels of tau detected in N2a CM, but small amounts of tau were detected in the 100,000 × g pellet. Notably, tau levels were significantly increased in the 100,000 × g pellets after treatment with Triton X-100. B, Crude exosomes isolated from 400 ml of CM (Fig. 1A) were further fractionated by sucrose gradient centrifugation (Fig. 1B). The supernatants and pellets generated from each fraction were analyzed by the BT2-Tau5 ELISA. Tau is detected in the pellets from fractions with intact exosomes (1.10–1.15 g/ml sucrose buoyant density; ▴), whereas no tau can be detected if the exosomes were lysed before fractionation (+). Pretreatment of exosomes with Triton X-100 results in tau floating on top of the gradient (○). C, Western blot analysis of sucrose gradient fractions produced from a starting volume of 200 ml of CM. The blot was probed with the antibodies to exosomal markers, Alix, Flotllin-1, and PrP, and with choleratoxin-HRP to detect GM1 ganglioside. D, Representative EM image of sucrose gradient fraction 4. The image is typical of at least three fields from three separate samples. Scale bar, 100 nm. The results in A–D are representative of three experiments.
- Figure 6.
Free-floating tau is readily detected in CM from healthy iHCNs. A, Bright-field image of neurons 45 d after differentiation. Scale bar, 100 μm. Because the cells were almost confluent and it was difficult to distinguish one cell from another, an edge of lower density is shown. B, Western blot analysis of lysates with or without calf intestine alkaline phosphatase (CIP), 12.5 μg of total protein/lane, of 45 d postdifferentiation neurons (iHCNs) using anti-tau antibodies Tau12 (aa 6–18), K9JA (aa 243–441), Tau46 (aa 404–441), and the negative control antibody 46–4. Recombinant versions of all 6 human tau isoforms (Rec), 12 ng of total protein, and CIP-treated human brain extract (Hu), 4 μg of total protein, were loaded as controls. C, Medium collected from cultures after 48 h of conditioning was analyzed for tau, LDH, and β3T and the values presented are expressed relative to the amount of the corresponding protein detected in the lysates of the same cells. In 5 of 6 experiments, tau was released at significantly higher levels than LDH. No β3T was detected in CM. D, CM processed as described in Figure 1A. E, A crude exosomal pellet isolated from 35 ml of CM was further fractionated on a sucrose gradient according to Figure 1B. Tau was found in fractions with sucrose density of 1.10–1.16 g/ml (fractions 3–6).
- Figure 7.
Conditioned medium from healthy primary rat hippocampal neurons contain readily detectable levels of tau. A, Bright-field image of DIV 21 neurons. Scale bar, 50 μm. Because the cells were almost confluent and it was difficult to distinguish one cell from another, an edge of lower density is shown. B, Lysates (50 μg) of PRNs were treated with or without calf intestine alkaline phosphatase (CIP) and used for Western blotting with the anti-tau antibodies HJ9.4 (aa 7–13), BT2 (aa 194–198), K9JA (aa 243–441), Tau46 (aa 404–441), and the negative control antibody 46–4. Recombinant rodent tau 431 (Rec), 10 ng, and CIP-treated rat brain extract (Rat), 5 μg, were loaded as controls. C, Medium collected from DIV 21 neurons after 24 h of conditioning was analyzed for the presence of tau, LDH, and β3T. Tau was detected at levels disproportionate to the release of LDH and, in 5 of 8 experiments, the levels were significantly higher than LDH (p < 0.02). NS indicates that the levels of tau and LDH are not significantly different. β3T was not detected in the CM from any experiment. D, CM processed as described in Figure 1A. E, Crude exosomal pellet isolated from 35 ml of CM was further fractionated on a sucrose gradient according to Figure 1B. Tau was found in fractions with sucrose density 1.11–1.16 g/ml, fractions 3–6, consistent with exosomes.
- Figure 8.
The majority of extracellular tau is CT truncated. A, Mid-region, CT1, CT2, and FL tau detected in CM from DIV 21 PRNs. B, Mid-region, CT1, CT2, and FL tau detected in lysate from DIV 21 PRNs. C, Percentage release of LDH and mid-region, CT1, CT2, and FL tau from DIV 21 PRNs. Percentage release was calculated according to the following equation: ([analyte in CM])/([analyte in CM] + [analyte in lysate]) × 100. D, E, Lysate from PRN (∼2 μg tau/ml) with and without protease inhibitors was diluted 1:100 into PRN CM. A portion was snap frozen on dry ice and the remainder aliquoted and incubated at 37°C for 3, 6, 12, and 24 h. Tau detected by FL (D) and mid-region ELISAs (E) remained relatively constant over time, indicating little or no degradation of tau.
- Figure 9.
Aβ-induced cell compromise increases the amount of truncated tau in medium from primary rat hippocampal neurons. A, Aggregation of SEC-isolated Aβ(1–42) was followed using a continuous thioflavin T (ThT)-binding assay and fluorescence values are expressed in relative fluorescence units and plotted versus time. The ½tmax point at which sample was collected and used for toxicity experiments is indicated by the red arrow and the inset shows a negatively stained transmission EM of ½tmax Aβ(1–42). Scale bar, 100 nm. B, LDH activity in PRN CM after 1, 3, 5, and 7 d of treatment with 20 μm ½tmax Aβ(1–42); (■), 20 μm glutamate (▴), and vehicle (10.9 mm HEPES, pH 7.8; ●). Differences in LDH levels between the vehicle control and test conditions were compared on each day using the Student's t test. Glutamate caused an elevation in tau on all days (p < 0.01), whereas Aβ treatment increased tau only on days 5 and 7 (p < 0.01). Insets show MAP2-stained neurons after 7 d of treatment with 20 μm ½tmax Aβ(1–42) and 10.9 mm HEPES, pH 7.8. C, Tau detected by BT2-Tau5 (mid-region) ELISA in PRN CM after 1, 3, 5, and 7 d of treatment with 20 μm ½tmax Aβ(1–42); (■), 20 μm glutamate (▴), and vehicle (10.9 mm HEPES, pH 7.8; ●). Differences in tau concentration between the vehicle control and test conditions were compared on each day using the Student's t test. Glutamate treatment (▴) caused a significant elevation in tau on all days (p < 0.01), whereas Aβ(1–42) (■) caused a significant increase only on days 5 and 7 (p < 0.01). D, E, Tau detected by the CT1 (K9JA-K9JA; D) and CT2 (K9JA-Tau46; E) ELISAs evinced elevation on days 1, 3, 5, and 7 in medium from cells treated with glutamate (▴; p < 0.05) and on days 5 and 7 when cells were treated with Aβ(1–42) (■; p < 0.02). F, Tau detected in PRN CM by the FL (HJ9.4-Tau46) ELISA showed no difference between cultures treated with vehicle or glutamate on any day, whereas the levels of FL tau were elevated in CM from neurons treated with Aβ(1–42) (■) compared with vehicle (10.9 mm HEPES, pH 7.8; ●) on day 7 (p < 0.05). G, ADDLs were prepared as described in the Materials and Methods and characterized by aSEC (void volume indicated with an arrow) and negative contrast EM. Scale bar, 100 nm. H, Tau detected by BT2-Tau5 (mid-region) ELISA in PRN CM after 1, 3, 5, and 7 d of treatment with 0.5 μm ADDLs (♦), 20 μm glutamate (▴), and vehicle (10.9 mm HEPES, pH 7.8; ●). Differences in tau concentration between the vehicle control and test conditions were compared on each day using the Student's t test. Glutamate treatment (▴) caused a significant elevation in tau on all days (p < 0.05), whereas ADDLs (♦) did not cause a significant increase on any day (p > 0.05). I, Tau detected by the CT1 (K9JA-K9JA) ELISA in PRN CM after 1, 3, 5, and 7 d of treatment with 0.5 μm ADDLs (♦), 20 μm glutamate (▴), and vehicle (10.9 mm HEPES, pH 7.8; ●). Glutamate treatment (▴) caused a significant elevation in tau on all days (p < 0.01), whereas ADDLs (♦) did not cause a significant increase on any day (p > 0.05). The data shown are derived from a minimum of six wells per treatment.


Tables
Antigen Antibody Source Concentration Alix 3A9 Cell Signaling Technology 1 μg/ml Flotillin-1 18/Flotillin-1 BD Biosciences 1 μg/ml HIV glycoprotein 120 46-4 ATCC 1 μg/ml PrP ICSM35 D-Gen 0.5 μg/ml β3-tubulin ab68193 Abcam 1:250 dilution β3-tubulin TUJ1 Covance 5 μg/ml Tau (aa 6-18) Tau12 (human) EMD Millipore 0.1 μg/mla Tau (aa 7-13) HJ9.4 (rodent) Gift from David Holtzman 1 μg/mla Tau (aa 194-198) BT2 (human + rodent) Thermo Scientific 1 μg/mla,b Tau ( aa 210-241) Tau5 (human + rodent) Cell Signaling Technology 1 μg/mlc Tau (aa 243-441) K9JA (human + rodent) DAKO 1 μg/mla,b,c Tau (aa 404-441) Tau46 (human + rodent) Cell Signaling Technology 1 μg/mla Misfolded tau (residues 7-9 + 313-322) MC1 Gift from Peter Davies 5 μg/mla


