

Article Figures & Data
Figures
- Figure 1.
Preparation for studying local astrocyte effects on neuronal function. A, Schematic of cell culture system in which solitary neurons develop on either +astrocyte (blue circles) or −astrocyte (gray circles) microcultures. B, Examples of phase microscopy images (left) and TO-PRO-3 nuclear staining (right) of solitary neurons plated on +astrocyte (top row) and −astrocyte (bottom row) microcultures. Scale bar, 100 μm.
- Figure 2.
Evoked −astrocyte EPSCs, but not IPSCs, are desynchronized. A, Representative PSCs of GABAergic (left) and glutamatergic autaptic neurons (right) grown on +astrocyte microcultures (black traces, n = 9 and 12, respectively) or −astrocyte microcultures (gray IPSCs, n = 10; red EPSCs, n = 14). The bar graph summarizes differences in PSC waveforms between +astrocyte (black dotted line) and −astrocyte (gray and red bars, respectively) PSCs. −Astrocyte PSCs are normalized to +astrocyte PSC values. B, Representative traces of +astrocyte (black trace, n = 13) and −astrocyte (red trace, n = 17) EPSCs, focusing on synaptic delay between presynaptic stimulation and postsynaptic response (inset). C, Representative EPSCs from A, with asterisks denoting local minima in each trace (see Materials and Methods). D, Averaged local peak count and synaptic delay for +astrocyte and −astrocyte conditions displayed in bar graph (+astrocytes, n = 12; −astrocytes, n = 13). E, Two sequential evoked EPSCs from a −astrocyte glutamatergic neuron, separated by 25 s. Asterisks indicate local peaks detected via local peak count analysis, with color matched to trace color. F, Three evoked EPSCs recorded from +astrocyte glutamatergic neuron with 25 s between each stimulation. The boxed inset magnifies examples of quantal asynchrony occurring after the evoked response. *p < 0.05.
- Figure 3.
Large-scale asynchrony does not result from polysynaptic transmission. A, Schematic of a microculture containing multiple neurons with polysynaptic connections (left) and an autaptic −astrocyte microculture (right). B, C, EPSCs evoked by stimulating a neuron on a multineuron +astrocyte microculture (left) or a solitary neuron on a −astrocyte microculture (right). Asterisks denote local peaks. All EPSCs are normalized to the peak, and control and drug EPSCs are superimposed. The unscaled traces are displayed in the insets. Calibrations: 10 ms, 2 nA. EPSCs were evoked in control solution (black) or in 2.5 μm CdCl2 (orange; B). EPSCs in baseline solution (black) or in 50 nm NBQX (green; C). D, Common peak ratio (for a description of analysis, see Materials and Methods) was calculated for polysynaptic neurons (black bars) and −astrocyte neurons (red bars) in the CdCl2 experiment (left; n = 8 and 11, respectively) and NBQX experiment (right; n = 6 and 8, respectively). *p < 0.05.
- Figure 4.
Temporal abnormalities are partially conserved in fixed-astrocyte microcultures. A, Example EPSCs from solitary glutamatergic neurons in microcultures containing live astrocytes (green trace) or lightly fixed astrocytes (gray trace), obtained from the same coverslip and superimposed. B, Similar EPSCs, but from +astrocyte (black trace) and −astrocyte neurons (red trace). C, The bar graph displays EPSC waveform parameters of fixed-astrocyte EPSCs (gray bars; n = 14) and −astrocyte EPSCs (red bars; n = 14) normalized to their respective sibling live-astrocyte EPSCs (green and black dotted line; n = 11 and 12, respectively). *p < 0.05, Bonferroni corrected.
- Figure 5.
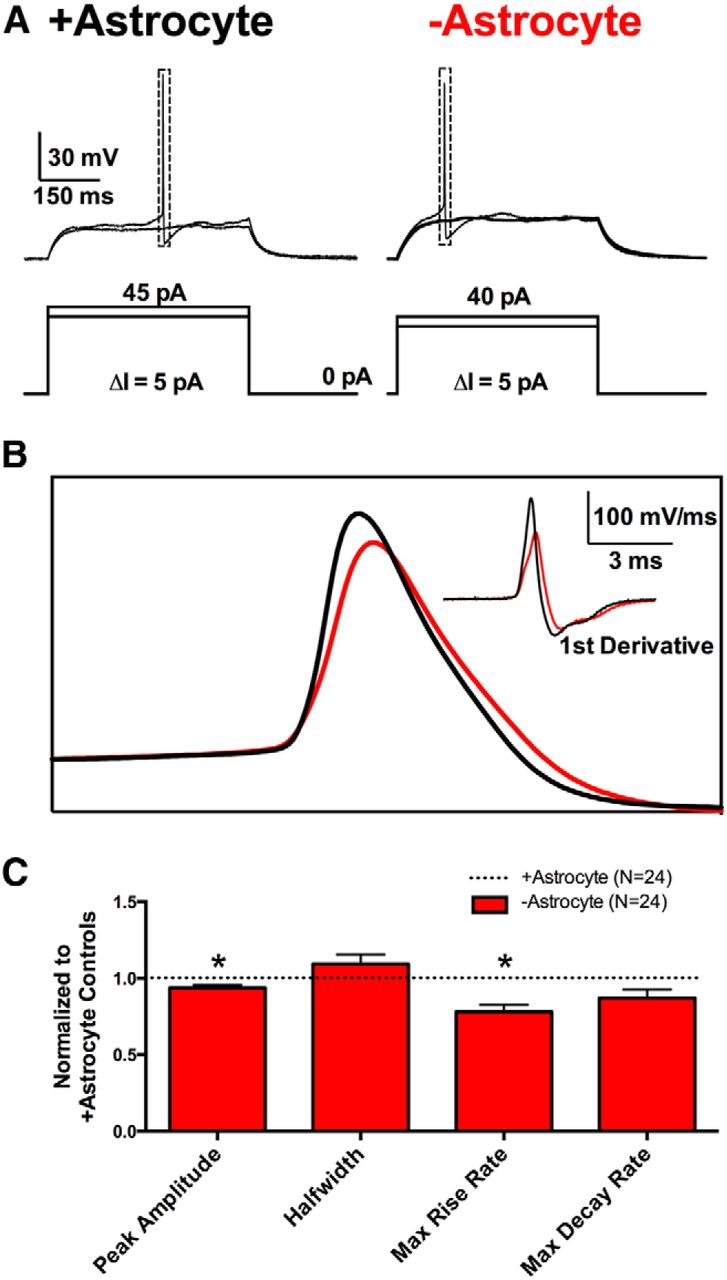
Somatic action potential waveforms are mildly affected by loss of local astrocytic support. A, Representative action potential initiation recordings from +astrocyte glutamatergic neurons (left) and −astrocyte glutamatergic neurons (right). The current-injection protocols displayed beneath the traces show current injections incremented (ΔI) in 5 pA steps until a single action potential was evoked. B, Superimposed +astrocyte (black) and −astrocyte (red) action potentials from A are displayed along with the first derivative of the action potentials (inset). C, Action potential waveform parameters are quantified in the bar graph below. −Astrocyte action potential values (red bars; n = 24) were normalized to +astrocyte controls (black dotted line; n = 24). *p < 0.05, Bonferroni corrected.
- Figure 6.
−Astrocyte and +astrocyte axons have similar physical properties. A, Example pan-Nav immunostaining (green; vGluT1, red) of a +astrocyte neuron (left) and −astrocyte neuron (right). The bar graph quantifies staining intensity, size, and location for −astrocyte neurons (red bars; n = 13) compared to +astrocyte controls (black dotted line; n = 14). −Astrocyte AIS immunostaining values were normalized to +astrocyte neuron immunostaining values. B, C, Distal axon morphology and EPSCs were compared between +astrocyte and −astrocyte glutamatergic neurons. B, Representative SMI-312 staining (left) of +astrocyte (top row) and −astrocyte (bottom row) glutamatergic neurons. Immunostaining was thresholded and binarized (right) for subsequent axon length and branching measurements. (For a description, see Materials and Methods.) C, EPSCs from +astrocyte neurons (n = 4; black and blue hues) and −astrocyte neurons (n = 6; red hues) before fixation and SMI-312 immunostaining. D, Plots of axon length (left), number of branch points (middle), and number of end points (right) for all +astrocyte (blue hue dots) and −astrocyte (red hue dots) neurons recorded and measured. The color of the dots corresponds with the color of EPSCs displayed in C. E, Representative SMI-312 (left) and filipin (right) stains for −astrocyte (top row) and +astrocyte (bottom row) glutamatergic neurons, verified in preceding whole-cell recordings. Proximal (arrows) and distal (arrowheads) axon regions of interest were defined on SMI-312 images and subsequently used to measure filipin intensity via background-subtracted line scan analyses. These analyses are quantified in the bar graphs (+astrocytes, n = 15; −astrocytes, n = 18). Filipin intensity was normalized to somatic filipin intensity to account for variations in staining intensity between biological replicates. Scale bars: A, E, 20 μm; B, 100 μm.
- Figure 7.
Action potential broadening may partially account for the disturbed −astrocyte EPSC waveform. A, C–D, Evoked baseline (control) and experimental (indicated drug) EPSCs from solitary neurons on +astrocyte microcultures are superimposed. A, EPSCs evoked in control saline (black) or in the presence of 100 nm α-dendrotoxin (teal). The right plot shows the time to EPSC peak for baseline (black symbols) and during drug application (teal symbols; n = 9 neurons). B, Immunostaining for Kv1.2 in −astrocyte (n = 7) and +astrocyte (n = 8) axons. Cells were triple labeled with anti-vGLUT1 to identify glutamatergic neurons, SMI-312 to identify axons, and anti-Kv1.2. The right panel shows that Kv1.2 immunofluorescence intensity normalized to corresponding SMI-312 immunofluorescence intensity did not differ between +astrocyte and −astrocyte axons from three independent stains. C, EPSCs evoked in control saline (black) or in the presence of 10 mm TEA (green). The right plot shows the change in time to peak when the bath (black) or drug (green) was applied (n = 10 neurons). D, EPSCs evoked in control saline (black) or in the presence of 200 μm 4-AP (purple). The right plot shows the change in time to peak when the bath (black) or drug (purple) was applied (n = 10 neurons). E, A train of 12 EPSCs at 20 Hz was evoked in −astrocyte neurons before (black traces) and after (red) 5 min of 20 μm EGTA-AM application. Control (black solid line) and EGTA-AM incubated (red solid line) EPSCs from the first stimulation are magnified with the decay of the 12th EPSCs (gray and red dotted lines, respectively) superimposed. The 12th EPSC peaks are scaled to 1st EPSC peaks for comparison. Asterisks under EPSCs denote identified local peaks. The bar graph quantifies the decay time constant of the 1st and 12th EPSCs for control (black bars) and EGTA-AM incubated (red bars) EPSCs. F, Local peak count of control EPSCs (black bars) and drug-treated EPSCs (colored bars) across all experiments. For summary data in C–E, *p < 0.05; **p < 0.01.
- Figure 8.
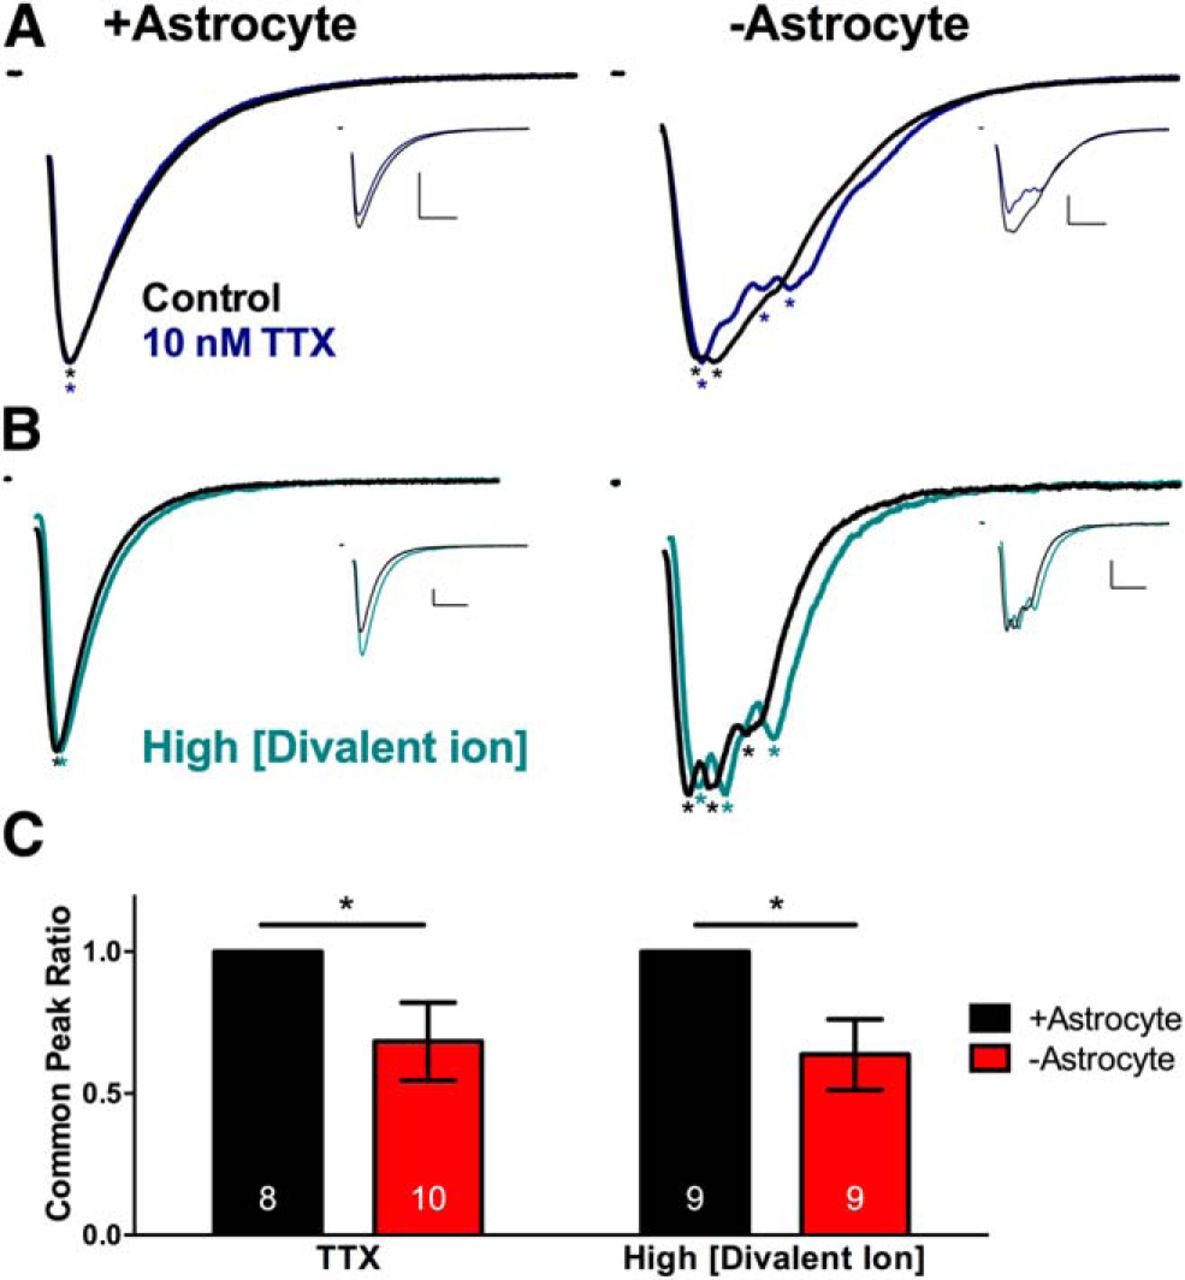
Decreasing membrane excitability alters temporal profile of −astrocyte EPSCs but not +astrocyte EPSCs. A, B, Evoked EPSCs from solitary neurons on +astrocyte microcultures (left) and −astrocyte microcultures (right). Local peaks are denoted by asterisks. All EPSCs are normalized to the largest peak, and control and experimental EPSCs are superimposed. Unscaled traces are displayed as insets. A, EPSCs evoked in control (black) or in 10 nm TTX (blue). Calibrations: 10 ms, 2 nA. B, EPSCs evoked in control (black) or in high extracellular divalent ion concentration (4 mm Ca2+, 3 mm Mg2+; teal). Calibrations: 10 ms, 500 pA. C, Bar graphs comparing common peak ratio between +astrocyte (black bars) and −astrocyte (red bars) EPSCs in the TTX condition (left; n = 8 and 10, respectively) and high extracellular divalent ion concentration (right; n = 9 and 9, respectively). *p < 0.05.
- Figure 9.
Longer, more variable action potential propagation for −astrocyte neurons. A, Schematic of the dual recording protocol performed on +astrocyte and −astrocyte glutamatergic neurons. A whole-cell patch pipette was placed at the soma, and a loose-seal extracellular pipette is placed along a distal thin neurite, the presumed axon. An action potential was evoked and recorded in the somatic whole-cell recording pipette, and the mainly capacitive current at the distal process was recorded with the loose-seal pipette. The extracellular action potential recording was compared to the first derivative of the somatic action potential, and the latency time was measured as the time between the peak of the somatic first derivative and the peak of the extracellular recording. B, C, Representative recordings from +astrocyte neurons (B) and −astrocyte neurons (C). EPSCs were evoked to assess large-scale asynchrony (left). The action potential measured at the distal neurite and the first derivative of the action potential are superimposed (right) and scaled to match baseline and maximum peak. The somatic action potential is displayed in the right inset. D, E, Plots of latency of action potential propagation (D) and extracellular action potential width (E). Dots represent individual +astrocyte neurons (black; n = 11 and 9, respectively) and −astrocyte neurons (red; n = 10 and 8, respectively). Values are mean ± SD. *p < 0.05.


