

Abstract
Compelling evidence suggests that pathological activity of the external globus pallidus (GPe), a nucleus in the basal ganglia, contributes to the motor symptoms of a variety of movement disorders such as Parkinson's disease. Recent studies have challenged the idea that the GPe comprises a single, homogenous population of neurons that serves as a simple relay in the indirect pathway. However, we still lack a full understanding of the diversity of the neurons that make up the GPe. Specifically, a more precise classification scheme is needed to better describe the fundamental biology and function of different GPe neuron classes. To this end, we generated a novel multicistronic BAC (bacterial artificial chromosome) transgenic mouse line under the regulatory elements of the Npas1 gene. Using a combinatorial transgenic and immunohistochemical approach, we discovered that parvalbumin-expressing neurons and Npas1-expressing neurons in the GPe represent two nonoverlapping cell classes, amounting to 55% and 27% of the total GPe neuron population, respectively. These two genetically identified cell classes projected primarily to the subthalamic nucleus and to the striatum, respectively. Additionally, parvalbumin-expressing neurons and Npas1-expressing neurons were distinct in their autonomous and driven firing characteristics, their expression of intrinsic ion conductances, and their responsiveness to chronic 6-hydroxydopamine lesion. In summary, our data argue that parvalbumin-expressing neurons and Npas1-expressing neurons are two distinct functional classes of GPe neurons. This work revises our understanding of the GPe, and provides the foundation for future studies of its function and dysfunction.
SIGNIFICANCE STATEMENT Until recently, the heterogeneity of the constituent neurons within the external globus pallidus (GPe) was not fully appreciated. We addressed this knowledge gap by discovering two principal GPe neuron classes, which were identified by their nonoverlapping expression of the markers parvalbumin and Npas1. Our study provides evidence that parvalbumin and Npas1 neurons have different topologies within the basal ganglia.
Introduction
The basal ganglia are an ensemble of subcortical nuclei that are critically involved in the control of action (Albin et al., 1995; Graybiel, 2008; Redgrave et al., 2010; Turner and Desmurget, 2010; Costa, 2011; Gerfen and Surmeier, 2011; Kravitz and Kreitzer, 2012). The external globus pallidus (GPe) is in a unique and powerful position to influence processing of motor information by virtue of its widespread projections to essentially all basal ganglia nuclei (DiFiglia et al., 1982; Beckstead, 1983; Walker et al., 1989; Kita and Kitai, 1994; Kita, 1994, 2007; Parent and Hazrati, 1995; Shammah-Lagnado et al., 1996; Nambu and Llinaś, 1997; Bevan et al., 1998; Smith et al., 1998a,b; Kita et al., 1999; Sato et al., 2000; Kita and Kita, 2001). Consistent with this idea, compelling evidence suggests that pathological activity of the GPe contributes to the motor symptoms of a variety of basal ganglia disorders such as Parkinson's disease (PD; DeLong, 1971; Kita and Kitai, 1991; Nambu and Llinaś, 1994; Bergman et al., 1998; Obeso et al., 2000; DeLong and Wichmann, 2007; Hammond et al., 2007; Obeso et al., 2008a,b; Edgerton and Jaeger, 2011; Jaeger and Kita, 2011).
While the prevailing circuit model asserts that the GPe is a homogeneous population of neurons that acts as a mere relay in the indirect pathway of the basal ganglia (Albin et al., 1989, 1995; Alexander and Crutcher, 1990; DeLong, 1990; Parent and Hazrati, 1995; Joel and Weiner, 1997; Graybiel, 2000), accumulating evidence suggests that neurons in the GPe are more heterogeneous than previously appreciated (Nambu and Llinaś, 1994; Kelland et al., 1995; Nini et al., 1995; Bevan et al., 1998; Kita et al., 1999; Cooper and Stanford, 2000; Raz et al., 2000; Günay et al., 2008; Mallet et al., 2008, 2012; Chuhma et al., 2011; Schmidt et al., 2013b; Mastro et al., 2014; Abdi et al., 2015; Dodson et al., 2015). In part because of the lack of reliable tools by which to classify GPe neurons, the majority of studies have assumed a broad continuum of electrophysiological phenotypes. Although several attempts have been made to differentiate GPe cell classes on the basis of their electrophysiological properties alone, the classification schemes used in these studies were based on criteria unique to each experimental setup (Kita and Kitai, 1991; Nambu and Llinaś, 1994; Cooper and Stanford, 2000; Mallet et al., 2008; Bugaysen et al., 2010). Only recently have studies addressed this problem by correlating electrophysiological properties of GPe neurons with objective criteria, such as their genetic signatures and projection targets (Mallet et al., 2012; Mastro et al., 2014; Abdi et al., 2015; Dodson et al., 2015). However, our understanding remains incomplete due to the limited genetic tools that allow reliable and efficient identification of GPe neuron classes. In this study, we attempt to reconcile the molecular, electrophysiological, and circuit properties of GPe neurons. Using a combinatorial strategy, several classes of GPe neurons were identified. Parvalbumin (PV)-expressing (PV+) neurons and Npas1-expressing (Npas1+) neurons were found to be two distinct populations of GPe neurons, and they amount to 55% and 27% of the total population, respectively. In addition, GPe neuron classes were characterized based on their expression of Lhx6, Foxp2, and choline acetyltransferase (ChAT). Finally, we found that autonomous firing in Npas1+ neurons was reduced in a chronic 6-hydroxydopamine (6-OHDA) lesion model of PD. In summary, we offer a revised classification scheme for GPe neurons in adult mice.
Materials and Methods
Animals.
All experiments detailed were performed in accordance with the Northwestern University Animal Care and Use Committee, and were in compliance with the National Institutes of Health Guide to the Care and Use of Laboratory Animals. A Npas1-Cre-2A-tdTomato BAC (bacterial artificial chromosome) transgenic mouse line (see below) was generated at the Northwestern Transgenic and Targeted Mutagenesis Laboratory. This mouse line is herein referred to as Npas1-tdTom for simplicity. Lhx6-eGFP and ChAT-Cre mice were generated from the GENSAT project (Gong et al., 2003; Gerfen et al., 2013). A PV-IRES-Cre driver line was obtained from The Jackson Laboratory (Hippenmeyer et al., 2005) and crossed with a floxed-stop tdTomato reporter line (Jackson Laboratory; Madisen et al., 2010) to generate PV-tdTom mice. Similarly, a ChAT-Cre line was crossed with the floxed-stop tdTomato reporter line to generate ChAT-tdTom mice. Heterozygous and hemizygous mice were used to minimize the potential alteration of the phenotypes in mice carrying the transgene alleles (Chan et al., 2012). Npas1 knock-out mice (Erbel-Sieler et al., 2004) were obtained from Dr. John Rubenstein (University of California, San Francisco, San Francisco, CA). Mice harboring targeted disruption in Kcnd2 (Kv4.2−/−) or Kcnd3 (Kv4.3−/−; Guo et al., 2005; Burkhalter et al., 2006; Norris and Nerbonne, 2010; Carrasquillo et al., 2012) were obtained from Dr. Jeanne Nerbonne (Washington University in St. Louis, St. Louis, MO). Double Kv4-null mutants (Kv4.2−/− and Kv4.3−/−) were used to confirm the molecular identity of channels underlying the transient, Kv4-like K+ current in GPe neurons. Genotypes of all transgenic mice were determined by tail biopsy followed by PCR to identify the presence of the relevant transgenes. C57BL/6J wild-type mice (Jackson Laboratory) were used in a subset of experiments. Both male and female mice were used in this study.
Drugs.
CPP and NBQX disodium salt were obtained from Tocris Bioscience. CGP55845, picrotoxin, QX314-Cl, and SR95531 were obtained from Abcam. KMeSO4, Na3GTP, and tetrodotoxin (TTX) were obtained from ICN Biomedicals, Roche, and Alomone Labs, respectively. All other reagents were obtained from Sigma-Aldrich. Drugs were dissolved as stock solutions in either water or DMSO and were aliquoted and frozen at −30°C before use. Each drug was diluted to the appropriate concentration by adding to the superfusate immediately before the experiment. The final concentration of DMSO in the superfusate was <0.1%.
Generation of Npas1 BAC mice.
Two founder mice expressing Cre and tdTomato under the control of the regulatory elements of Npas1 were generated using BAC recombineering techniques (Yang et al., 1997; Heintz, 2001; Gong et al., 2003; Schmidt et al., 2013a). The procedures used were similar to those described previously (Liu et al., 2003). In brief, a cassette with 100-bp targeting arms homologous to sequences flanking the ATG start codon within the first exon of Npas1 was commercially synthesized (Genewiz). A codon-optimized Cre recombinase (Shimshek et al., 2002), a P2A cleavable fusion peptide sequence (Szymczak et al., 2004; Kim et al., 2011), and tdTomato (Shaner et al., 2004) in a single open reading frame followed by a bovine growth hormone polyadenylation sequence (Cre-2A-tdTomato) were cloned between the 5′ and 3′ targeting arms. In addition, an f3-PGK-EM7-neoR-f3 (f3neof3) cassette was inserted downstream of the Cre-2A-tdTomato cassette as a selection marker (Liu et al., 2003). DNA fragments were linearized with FseI and introduced into bacterial cells carrying a BAC construct containing the regulatory elements of mouse Npas1 (Children's Hospital Oakland Research Institute BACPAC Resources Center, Oakland, CA). We inserted Cre-2A-tdTomato downstream from the Npas1 ATG translation initiation codon. The Npas1 coding sequence was removed to ensure no functional Npas1 RNA or protein expression from the BAC vector. Recombinants were identified based on kanamycin resistance and confirmed by colony PCR. Recombined BAC DNA containing the Cre-2A-tdTomato and f3neof3 insert was then transformed into Flp recombinase-expressing EL250 electrocompetent cells (Lee et al., 2001) to remove the NeoR cassette (Liu et al., 2003). Npas1-Cre-2A-tdTomato BAC DNA was purified using a modified Maxiprep (Qiagen) procedure, analyzed with pulsed-field gel electrophoresis, and injected into pronuclei of C57BL/6 (The Jackson Laboratory) fertilized oocytes to generate founder mice. The Npas1-tdTom mouse line was maintained in a C57BL/6 inbred strain as the dopaminergic system, which is crucial to the basal ganglia, is vastly different between strains (Ralph and Caine, 2005; Chan et al., 2012).
Stereotaxic injections of Fluorogold and adeno-associated virus.
For Fluorogold injections, mice aged postnatal day 45–50 were anesthetized with isoflurane and immobilized on a stereotaxic frame (David Kopf Instruments). A small craniotomy (∼1 mm diameter) was made with a dental drill (Osada) for injection into the subthalamic nucleus [STN; at (in mm) 1.75 caudal, 1.60 lateral, and 4.45 ventral to bregma]. Fluorogold (5 μg/μl; Fluorochrome) was dissolved in 0.9% (w/v) NaCl and 135 nl was injected using a calibrated glass micropipette (VWR) at a rate of 0.3–0.5 μl/min. Using identical procedures, 135 nl of adeno-associated virus (AAV) with a EF1α-DIO-hChR2(H134R)-eYFP cassette (7 × 10¹² viral genome/ml; University of Pennsylvania Vector Core, Philadelphia, PA) was injected into the GPe [at (in mm) 0.35 caudal, 1.95 lateral, 4.00 ventral to bregma] of mice aged postnatal day 28–35. The micropipette was left in situ for 5–10 min postinjection to maximize tissue retention of Fluorogold or AAV and decrease capillary spread upon pipette withdrawal. Mice injected with Fluorogold and AAV were processed for immunohistological analysis (see below) 7–10 d and 35–42 d after injection, respectively.
Chronic dopamine depletion.
Unilateral injection of 6-OHDA into the medial forebrain bundle (MFB) was used to lesion the nigrostriatal system (Glajch et al., 2012). 6-OHDA (2.5 μg/μl) was dissolved in 0.9% w/v NaCl with 0.1% w/v ascorbic acid. Using identical procedures to those for stereotaxic injection of Fluorogold and AAV, 1 μl of 6-OHDA was injected into the MFB [at (in mm) 0.7 caudal to bregma, 1.1 lateral to bregma, 4.8 ventral to dura] of mice at postnatal day 28–35. Three weeks after 6-OHDA injection, the degree of dopamine depletion was assessed by quantifying forelimb impairment in a cylinder task (Schallert et al., 2000). During a 5 min period of exploratory behavior in a clear glass cylinder (9 cm diameter), weight-bearing contacts made by each forepaw on the cylinder wall were counted. Mice with >20 total touches were excluded due to incomplete lesion. Asymmetry of forelimb usage was determined by calculating the ratio of contralateral (to the lesion) paw touches to ipsilateral paw touches. As impairment of the contralateral paw is expected upon dopamine depletion, a lower ratio of contralateral to ipsilateral touches indicated a more severe lesion. Electrophysiological experiments were performed 4–6 weeks after 6-OHDA injection.
Immunohistochemistry and quantifications.
Mice aged postnatal day 55–80 were anesthetized deeply with a ketamine-xylazine mixture and perfused transcardially first with 0.01 m PBS followed by fixative containing 4% paraformaldehyde, pH 7.4. Brain tissue was then postfixed in the same fixative for 1–2 h at 4°C. Tissue blocks containing the GPe were sectioned sagittally using a vibrating microtome (Leica Instruments) at a thickness of 60 μm. Floating sections were blocked with 2.5–10% (v/v) normal goat or donkey serum (Invitrogen) and 0.1% (v/v) Triton X-100 in PBS for 30–60 min at 4°C and were subsequently incubated in primary antibodies (Table 1) in the same solution for 16–24 h at 4°C. After washes in PBS, the sections were incubated with Alexa Fluor-conjugated IgG antibody (Life Technologies) at room temperature for 2 h. For peroxidase–diaminobenzidine reaction, sections were incubated with biotinylated secondary IgGs (Jackson ImmunoResearch) at room temperature for 2 h. Bound peroxidase enzyme activity was revealed using Tris-buffered saline containing 0.025% (w/v) 3-3-diaminobenzidine tetrahydrochloride, 0.05% (v/v) nickel chloride, and 0.003% (v/v) hydrogen peroxide. The sections were then washed, mounted, and coverslipped.
Primary antibodies used in this study
For cell quantification, data were acquired on a laser-scanning confocal microscope with a 60× 1.35 numerical aperture (NA) oil-immersion objective. Images encompassing the entire GPe were taken and stitched using FLUOVIEW Viewer3 (Olympus) and Photoshop CS6 (Adobe Systems). Cell counting was performed on Fiji (Schindelin et al., 2012) using a cell counter plugin. GPe sections from three different lateromedial levels (∼2.5, 2.1, and 1.7 mm from bregma) were sampled, and were assigned as lateral, intermediate, and medial, respectively. The GPe was defined based on the cytoarchitecture. Cells counts were obtained from one to nine sections from at least three mice. Values in text and figures represent medians of percentages calculated in each section.
Semiautomated cell density analysis (Table 2) was performed in Fiji using in-house algorithms (available upon request). Briefly, 10 z-stacks were acquired in the GPe of parasagittal sections from three different lateromedial levels as described above. Thirty total z-stacks per brain region were taken. Each z-stack was then broken into three separate, nonoverlapping 10 μm substacks that were used to make maximum z-projections. Cells were identified in maximum z-projections based on DAPI fluorescence, and individual ROIs were created for each cell. For each ROI, neurons were determined based on the fluorescence intensity of NeuN. Cell counts from each substack were summed within stacks and normalized by volume to estimate the cell density for each z-stack.
Quantification of GPe neuron classes
Visualized recording in ex vivo brain slices.
Mice aged postnatal day 55–85 were anesthetized with a ketamine-xylazine mixture and perfused transcardially with ice-cold artificial CSF (aCSF) containing the following (in mm): 125 NaCl, 2.5 KCl, 1.25 NaH2PO4, 2.0 CaCl2, 1.0 MgCl2, 25 NaHCO3, and 12.5 glucose, bubbled continuously with carbogen (95% O2 and 5% CO2). The brains were rapidly removed, glued to the stage of a vibrating microtome (Leica Instruments), and immersed in ice-cold aCSF. Parasagittal slices containing the dorsal striatum and the GPe were cut at a thickness of 240 μm and transferred to a holding chamber, where they were submerged in aCSF at 37°C for 30 min, and returned to room temperature before recording. Slices were then transferred to a small-volume (∼0.5 ml) Delrin recording chamber that was mounted on a fixed-stage, upright microscope (Olympus). As there is no clear demarcation between the GPe and the ventral pallidum in ex vivo brain slices, only neurons in the dorsal two-thirds of the GPe were sampled for electrophysiological analyses. Specifically, GPe neurons were visualized using differential interference contrast optics, illuminated at 735 nm (Thorlabs), and imaged with a 60× 1.0 NA water-immersion objective (Olympus) and a CCD camera (QImaging). Genetically labeled GPe neurons were identified based on their somatic tdTomato and eGFP fluorescence, and were examined with epifluorescence microscopy using a daylight (6500 K) LED (Thorlabs) and an appropriate filter cube (Semrock).
Recordings were made at room temperature (20–22°C) with patch electrodes fabricated from capillary glass (Sutter Instruments) pulled on a Flaming-Brown puller (Sutter Instruments) and fire polished with a microforge (Narishige) immediately before use. Pipette resistance was typically ∼2–5 MΩ. The internal solution for cell-attached and current-clamp recordings consisted of the following (in mm): 135 KMeSO4, 5 KCl, 10 Na2 phosphocreatine, 5 HEPES, 5 EGTA, 2 Mg2ATP, 0.5 CaCl2, 0.5 Na3GTP, and 0.2% (w/v) biocytin, pH adjusted to 7.25–7.30 with KOH. The liquid junction potential for this internal solution was ∼7 mV and was not corrected for. The internal solution for voltage-clamp recordings of IPSCs contained the following (in mm): 120 CsCl, 10 Na2phosphocreatine, 5 HEPES, 5 TEA-Cl, 2 Mg2ATP, 1 QX314-Cl, 0.5 Na3GTP, 0.5 CaCl2, 0.25 EGTA, and 0.2% (w/v) biocytin, pH adjusted to 7.25–7.30 with CsOH. All internal solutions had an osmolarity of ∼290 mOsm. Somatic patch-clamp recordings were obtained with an amplifier (Molecular Devices). To measure autonomous pacemaking in GPe neurons, only cell-attached recordings were used to prevent disruption of the intracellular milieu. For voltage-clamp recordings, whole-cell and pipette capacitance were compensated for. For current-clamp recordings, the amplifier bridge circuit was adjusted to compensate for electrode resistance. For hyperpolarization-activated cyclic nucleotide-gated cation (HCN) current recordings, neurons were stepped from a holding potential of −50 to −130 mV for 1 s. Depolarization-activated K+ currents were recorded in the presence of TTX. Neurons were prepulsed to −40 or −110 mV for 100 ms followed by a test pulse for 500 ms. Rapidly inactivating, Kv4-like K+ currents were defined by the amplitude of the yielded difference current. Tetraethylammonium (TEA; 1 mm) was added to the aCSF in the sample traces in Figure 9c to suppress the delayed rectifier currents. Slow-inactivating or noninactivating K+ currents were measured at 350–450 ms from responses to a test pulse to −30 mV preceded by a prepulse to −40 mV. To measure voltage-gated Na+ current, the TTX-sensitive component was isolated in a low sodium external solution containing the following (in mm): 72 TEA-Cl, 70 NaCl, 13.9 glucose, 10 HEPES, 3.0 CsCl, 2.5 KCl, 2 BaCl2, 2 CdCl2, and 1.0 MgCl2, pH adjusted to 7.35–7.40 with NaOH. Neurons were ramped from −80 to −20 mV in 4 s. Leak current was subtracted off-line by fitting the linear portion of the current at negative voltages. The signal for all voltage-clamp recordings was filtered at 1 kHz and digitized at 10 kHz with a digitizer (Molecular Devices). Stimulus generation and data acquisition was performed using pClamp10. To study the synaptic input from the dorsal striatum (dStr), striatopallidal axons were topographically activated using electrical stimulus delivered with a constant-current isolator (Digitimer) and a concentric bipolar electrode (Frederick Haer and Co.).
Data and statistical analyses.
Data analyses and curve fitting were performed with ClampFit10 (Molecular Devices), Fiji (http://fiji.sc/Fiji; Schindelin et al., 2012), and MATLAB8 (MathWorks). Ten to 15 min after a tight seal, a 2 min block of extracellular spikes from each cell was acquired and analyzed to measure autonomous firing rate and regularity [interspike interval (ISI); coefficient of variation (CV)]. Statistical analyses were performed with Prism6 (GraphPad) or MATLAB8. For characterization of the response to negative current injection, the trough was calculated as the most negative voltage achieved in response to a −160 pA current injection. Sag ratio was calculated as the ratio between the trough and the average voltage of the 60 ms region at the end of the step. For characterization of action potential waveforms, neurons were maintained at a potential of −70 mV by injection with slow current to suppress pacemaking, and were subjected to a 200 pA current step for 50 ms. Properties of the first action potential elicited in response to the current step were measured. Action potential peak is defined relative to 0 mV. Threshold was calculated from where the voltage slope first achieved 10 mV/ms immediately before an action potential. The maximum rising phase was calculated as the point at which the voltage slope was highest between the initiation of the action potential and the peak. The half-width was calculated as the width of the action potential at the voltage level that was halfway between the threshold voltage and the peak. Afterhyperpolarization was calculated as the most negative voltage achieved following the peak. Membrane resistance (Rm) was calculated by Rm = ΔVtest/ΔI where ΔVtest is a 10 mV step from −80 to −70 mV in the presence of TTX. Membrane capacitance (Cm) was calculated by Cm = Qt * ΔVtest where Qt is the integral of the transient current elicited by ΔVtest, a 10 mV voltage step. Normal distributions of data were not assumed regardless of sample size or variance. Data in the main text are presented as the median ± median absolute deviations (MADs), which are measures of central tendency and statistical dispersion, respectively. Box plots are used for the graphic representation of population data (Krzywinski and Altman, 2014; Streit and Gehlenborg, 2014). The central line represents the median, the edges represent the interquartile ranges, and the whiskers represent the 10th to 90th percentiles. Unless otherwise specified, sample size (n value) is defined by the number of recorded neurons. Outliers are not presented for clarity. For comparisons of more than two cell classes, a Kruskal–Wallis test was performed at a significance level (α) of 0.05. Comparisons for unrelated samples were performed using the Mann–Whitney U test at a significance level (α) of 0.05. A χ2 test was used for pairwise comparisons of cellular distributions with a threshold (α) of 0.01 for significance. Unless <0.0001, exact p values (two-tailed) are reported.
Results
Npas1+ GPe neurons can be identified using Npas1-tdTom mice
Recent lineage studies converge on the idea that the calcium-binding protein PV and the transcription factor Npas1 are differentially expressed in two largely nonoverlapping classes of GPe neurons (Flandin et al., 2010; Nóbrega-Pereira et al., 2010) throughout development. To identify and specifically manipulate Npas1+ GPe neurons, we generated a novel multicistronic BAC transgenic mouse line under the regulatory elements of the Npas1 gene (Npas1-Cre-2A-tdTomato, hereafter abbreviated as Npas1-tdTom). Two founder lines were successfully generated and designated as line 1 and line 2. Similar labeling patterns between the two founder lines were observed. Specifically, in addition to the GPe, tdTomato-labeled cell bodies were found throughout the cortex, hippocampus, basal magnocellular complex, internal globus pallidus, zona incerta, substantia nigra pars reticulata, and superior colliculus. In contrast, the dStr and the dorsorostral thalamus had few labeled neurons, although axonal fibers could be observed coursing through these areas (Fig. 1a). This distribution of labeled neurons was similar to that described for Npas1 in the literature (Erbel-Sieler et al., 2004; Stanco et al., 2014) as well as in a public database (Madisen et al., 2010).

Npas1-tdTom BAC transgenic mice faithfully report the localization of Npas1+ neurons in the CNS, including the GPe. a, Top, A photomicrograph of a mouse brain section showing the distribution of tdTomato-expressing neurons (black) in an Npas1-Cre-2A-tdTomato (Npas1-tdTom) BAC mouse. Bottom, A higher-magnification image showing the GPe and its neighboring areas. Note the labeling of neuropil in both the dStr and thalamic reticular nucleus (TRN). In contrast, the anterior commissure (ac) and the internal capsule (ic) were devoid of labeling. b, Immunohistochemical labeling of Npas1+ neurons in the GPe of Npas1-tdTom founder lines 1 (top) and 2 (middle). Note the high degree of colocalization between the Npas1-tdTom signal and the labeling of the endogenous Npas1 protein with the antibody. Bottom, Double immunofluorescent labeling of the endogenous Npas1 protein with a novel guinea pig (gp) antibody and a previously characterized (Erbel-Sieler et al., 2004) antibody. c, Immunofluorescent labeling with guinea pig (gp) and rabbit (rb) Npas1 antibodies in an Npas1 knock-out mouse. The lack of specific labeling further demonstrates the specificity of these novel antibodies. Abbreviations: anterior commissure (ac), basal magnocellular complex (bMg), cortex (Ctx), dorsal striatum (dStr), hippocampus (Hp), internal capsule (ic), substantia nigra pars reticulata (SNr), superior colliculus (SC), thalamus (Th), thalamic reticular nucleus (TRN), and zona incerta (ZI).
To complement our efforts in the identification of Npas1+ GPe neurons, we also raised two antibodies (in guinea pig and rabbit) that target Npas1 protein. To demonstrate the validity of the mouse lines and the antibodies generated, immunohistochemical labeling was performed on the Npas1-tdTom mice and Npas1 knock-out mice. Immunohistochemical labeling of the Npas1-tdTom BAC mice revealed that they faithfully reported the identity of Npas1+ GPe neurons, as a large majority of tdTomato-positive neurons in both Npas1-tdTom founder lines indeed expressed endogenous Npas1 protein (line 1 = 94 ± 12%, n = 470 neurons; line 2 = 88 ± 12%, n = 255 neurons; Fig. 1b). However, the tdTomato signal in line 1 mice better represented the entirety of the Npas1+ GPe neuron population (88 ± 7% of Npas1+ neurons were tdTomato+, n = 505 neurons) compared with that in line 2 mice (57 ± 16% of Npas1+ neurons were tdTomato+, n = 374 neurons). Therefore, only data from Npas1-tdTom founder line 1 are included in the rest of the study for precision and accuracy. Labeling produced by the novel antibodies was specific, as no signal was detected in the knock-out tissue (Fig. 1c). Furthermore, colocalization of the guinea pig Npas1 antibody and a previously characterized Npas1 antibody (Erbel-Sieler et al., 2004) was nearly complete (95 ± 4%, n = 587 neurons). As similar results were obtained with all three Npas1 antibodies used, the data generated with different antibodies were pooled throughout the current study.
PV+ and Npas1+ GPe neurons are distinct cell classes
Previous estimates of the proportion of GPe neurons that are PV+ span a wide range in rodents, from as low as 30% to as high as 80% (Hontanilla et al., 1994; Kita, 1994; Rajakumar et al., 1994; Mallet et al., 2012; Mastro et al., 2014). As the relative proportion and spatial distribution of different GPe neuron classes may affect our sampling and the interpretation of the existing literature, we sought to perform a comprehensive mapping of identified GPe neurons in mice at the outset of the study.
By performing immunohistochemical labeling of PV in the Npas1-tdTom line and Npas1 in a PV reporter line (PV-tdTom), we found that PV+ neurons and Npas1+ neurons formed two distinct cell groups in the GPe, making up 55% and 27%, respectively, of all neurons across the entire dorsoventral and lateromedial axes of the GPe (PV+ = 55 ± 6%, n = 1792 neurons; Npas1+ = 27 ± 4%; n = 2464 neurons; Fig. 2). Similar segregation of PV+ neurons and Npas1+ neurons was observed in the cortex and the hippocampus (Fig. 3). Additional breakdown of cell densities and relative abundance is presented in Table 2 and Figure 4. The abundance of PV+ neurons was largely consistent with reports that PV is expressed in a majority of GPe neurons (Kita, 1994; Rajakumar et al., 1994; Hontanilla et al., 1998; Nóbrega-Pereira et al., 2010; Mallet et al., 2012). Quantification from anatomical subdomains (see Materials and Methods) of the GPe revealed that the distribution of PV+ neurons exhibited a lateral (high) to medial (low) gradient (lateral = 60 ± 1%, n = 592; medial = 40 ± 1%, n = 632; p < 0.001), consistent with previous studies (Hontanilla et al., 1994; Kita, 1994; Rajakumar et al., 1994; Mastro et al., 2014; Fig. 4).

PV+ neurons and Npas1+ neurons are segregated in the GPe. a, Top, Low-magnification photomicrographs of sagittal sections showing an overview of the spatial distributions of PV+ (green) and Npas1+ (magenta) neurons within the GPe at lateral, intermediate, and medial levels (∼2.5, 2.1, and 1.7 mm lateral from bregma) in PV-tdTom mice. Bottom, High-magnification images of sections shown above. b, Parallel analysis was performed on Npas1-tdTom mice. ic, Internal capsule.
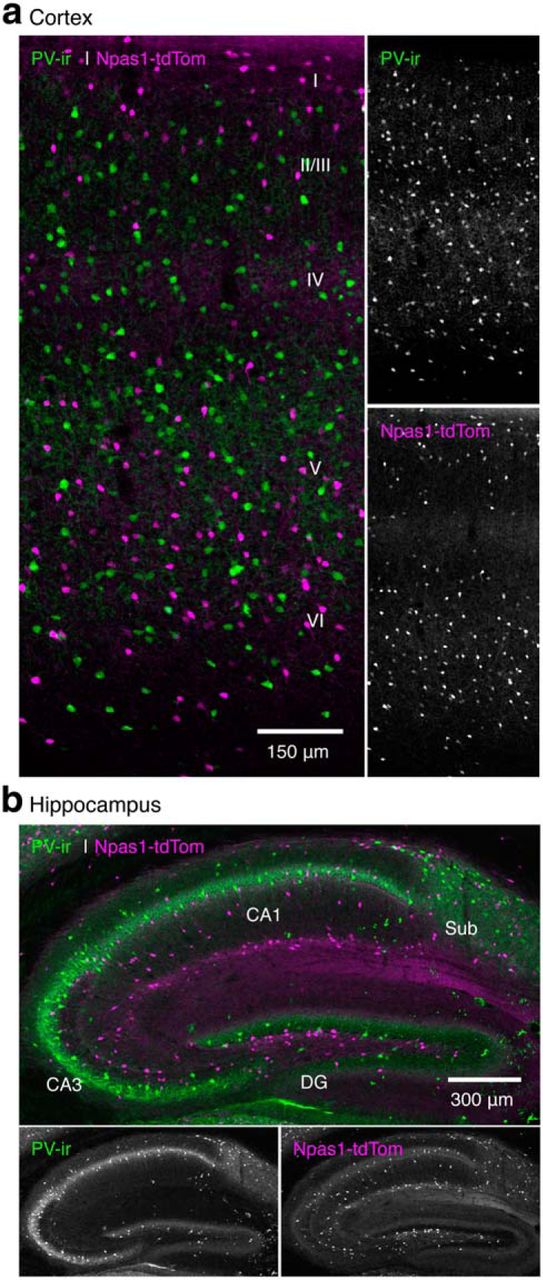
PV+ neurons and Npas1+ neurons are segregated in both the cortex and hippocampus. a, b, Photomicrographs of sagittal sections showing the subregion-specific expression and segregation of PV+ (green) and Npas1+ (magenta) neurons within the sensorimotor cortex (a) and the hippocampus (b) in the Npas1-tdTom mice. For clarity, the two channels are separated and presented in monochrome. DG, Dentate gyrus; sub, subiculum.
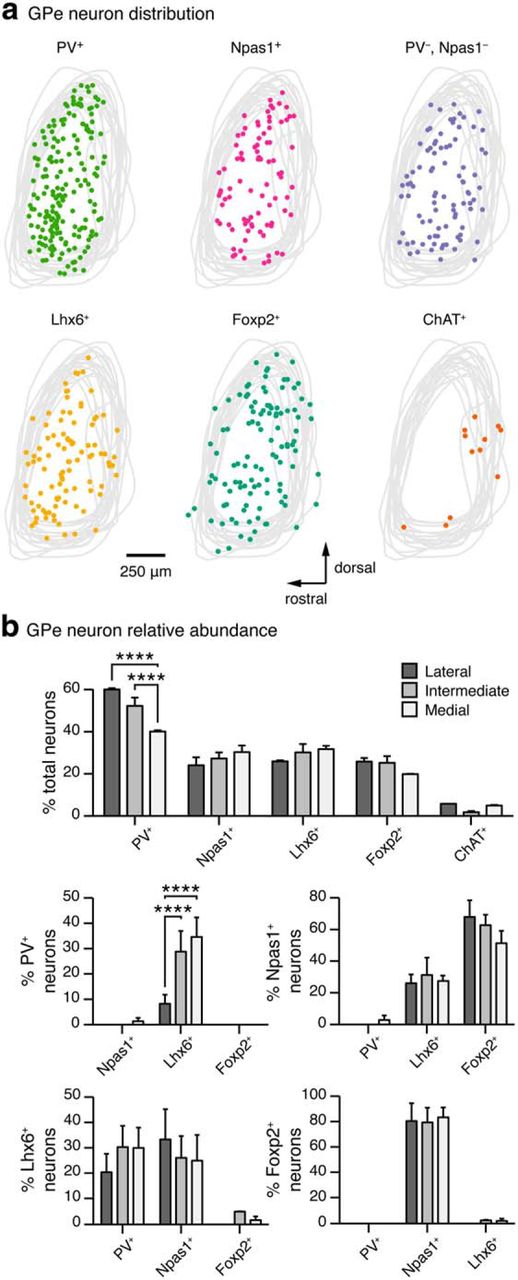
Spatial distribution and relative abundance of different GPe neuron classes. a, Graphic representation of densities and spatial distributions of identified GPe neurons across the dorsoventral and rostrocaudal axes. The confines of the GPe were defined by the cytoarchitecture. Cells located at lateral, intermediate, and medial levels (∼2.5, 2.1, and 1.7 lateral from bregma) were charted and collapsed onto a single sagittal plane. Representative data from a single mouse are shown in each case. Outlines of the GPe from a few representative examples were overlaid. Except for ChAT neurons, which often lined the caudoventral border of the GPe, all other identified GPe neurons are distributed throughout the GPe. b, Relative abundance of neuron classes in different lateromedial subdivisions of the GPe. (PV+ = 55 ± 6%, n = 1792 neurons; Npas1+ = 27 ± 4%, n = 2464 neurons; Lhx6+ = 30 ± 4%, n = 1028 neurons; Foxp2+ = 24 ± 3%, n = 1369 neurons; ChAT+ = 5 ± 1%, n = 1071 neurons) Percentage total was calculated from HuCD+ cells within each section. Note that PV and Npas1 were expressed in a largely nonoverlapping fashion (0 ± 0%). In contrast, considerable overlap between Lhx6 with PV (27 ± 7%, n = 619) or Npas1 (26 ± 8%, n = 1140) was observed; the remaining fraction was uniquely labeled with Lhx6. 80 ± 10% (n = 941) of the Foxp2 neurons coexpress Npas1; the remaining 20% were uniquely labeled with Foxp2. Medians ± MADs and two-tailed p values are listed. Medians and MADs are also represented in a graphical format. Asterisks denote statistical significance level: ****p < 0.0001, χ2 test.
ChAT, Lhx6, and Foxp2 define additional GPe neuron classes
In addition to PV+ neurons and Npas1+ neurons, we observed cells that were labeled only with the nominal neuronal markers HuCD or NeuN and devoid of PV or Npas1 expression (Fig. 4a, Table 2). To further characterize these unidentified neurons, we examined their colocalization with different markers known to be expressed in GPe neurons.
GPe neurons arise primarily from the medial ganglionic eminence (MGE) and the lateral ganglionic eminence (LGE) during development (Flandin et al., 2010; Nóbrega-Pereira et al., 2010; Dodson et al., 2015). PV and the transcription factor Lhx6 are nominal markers for neurons arising from the MGE, and both are expressed in GPe neurons (Abdi et al., 2015; Dodson et al., 2015). To investigate whether Lhx6-expressing (Lhx6+) neurons account for the remaining unidentified GPe neurons, we made a genetic cross between the Npas1-tdTom line and the Lhx6-eGFP BAC line (Gong et al., 2003). By performing immunohistochemical analysis in these mice, we discovered that Lhx6+ neurons represented 30% of total GPe neurons (30 ± 4%, n = 1028 neurons; Fig. 4b, Table 2). Approximately half of these coexpressed either Npas1 or PV (Npas1+ = 26 ± 8%, n = 1140 neurons; PV+ = 27 ± 7%, n = 619 neurons; Figs. 4b, 5a,b, Table 2). The remaining fraction, which was devoid of Npas1 and PV expression, represented ∼14% of total GPe neurons.

Immunohistochemical analysis of identified GPe neuron classes. Composite confocal micrographs demonstrating the cellular expression of various GPe neuron markers. Colocalization of cell markers are indicated by arrowheads (white). a, Colocalization of PV immunoreactivity (magenta) with GFP fluorescence (green) in an Lhx6-GFP mouse. b, Colocalization of GFP (green) and tdTom (magenta) signals in a genetic cross between an Npas1-tdTom mouse and Lhx6-GFP mouse. c, No colocalization was observed between Foxp2 immunoreactivity (magenta) and GFP fluorescence (green) in an Lhx6-GFP mouse. d, Colocalization was observed between Foxp2 immunoreactivity (green) and Npas1 immunoreactivity (magenta). e, No colocalization was observed between Foxp2 immunoreactivity (magenta) and tdTom fluorescence (green) in a PV-tdTom mouse. f, No colocalization was observed between PV immunoreactivity (magenta) and tdTom fluorescence (green) in a ChAT-tdTom mouse. g, No colocalization was observed between Npas1 immunoreactivity (magenta) and tdTom fluorescence (green) in a ChAT-tdTom mouse. h, No colocalization was observed between Foxp2 immunoreactivity (magenta) and tdTom fluorescence (green) in a ChAT-tdTom mouse.
The transcription factor Foxp2 is a nominal LGE marker (Ferland et al., 2003; Takahashi et al., 2003; Dodson et al., 2015), and can be used to delineate the abundance of LGE-derived GPe neurons. Foxp2 neurons represented 24% of GPe neurons (24 ± 3%, n = 1369 neurons; Fig. 4b, Table 2). Consistent with their expression in LGE-derived neurons, Foxp2 was not expressed by PV+ neurons (Figs. 4b, 5e, Table 2), and was expressed in only a small fraction of Lhx6+ neurons (2 ± 2%, n = 329 neurons; Figs. 4b, 5c, Table 2). In contrast, most Foxp2-expressing (Foxp2+) neurons (80 ± 10%; n = 941 neurons) expressed Npas1. Foxp2 was detectable in 60% of Npas1+ neurons (n = 1280 neurons; Figs. 4b, 5d, Table 2). Additionally, Foxp2 labeled a distinct class of GPe neurons that were devoid of PV, Npas1, and Lhx6 expression, accounting for ∼5% of the total GPe neuron population.
A small proportion of GPe neurons express ChAT (ChAT+) and are present primarily in ventrocaudal regions of the GPe (Mesulam et al., 1983; Rodrigo et al., 1998; Unal et al., 2012; McKenna et al., 2013; Sanders et al., 2015). To examine the contribution of ChAT+ neurons to the total GPe population, their abundance and anatomical distribution in ChAT-tdTom mice (see Materials and Methods) were charted (Fig. 4). As expected, ChAT+ neurons only amounted to 5% of the total GPe neuron population (5 ± 1%; n = 1071 neurons), and their distribution was consistent with that in previous studies (Mesulam et al., 1983; Rodrigo et al., 1998; Unal et al., 2012; McKenna et al., 2013). In addition, ChAT+ neurons did not express Npas1, Foxp2, or PV (Fig. 5).
GPe neuron classes differ in their projection targets
To examine whether PV+ neurons and Npas1+ neurons have distinct axonal projections, their axons were visualized by injecting a Cre-inducible eYFP adeno-associated virus (see Materials and Methods) into Cre recombinase-expressing PV-tdTom and Npas1-tdTom mice, respectively. A high density of eYFP+ axon fibers was present in the STN of PV-tdTom mice injected with the virus, but few axon fibers were observed in the dStr (Fig. 6a). In contrast, a high density of eYFP+ axon fibers was present in the dStr of Npas1-tdTom mice, but few axon fibers were observed in the STN. Because of the high neuron density within the STN (Oorschot, 1996), the sparsely arborized Npas1+ axons may still in fact have substantial contact with STN neurons. Our unpublished observations suggest that Npas1+ neurons indeed synapse onto a subset of STN neurons.

Identified GPe neurons differ in their axonal projections patterns. a, b, Left, Sagittal mouse brain sections showing the axonal projections from PV+ neurons and Npas1+ neurons. A Cre-inducible eYFP (green) adeno-associated virus was injected into PV-tdTom and Npas1-tdTom mice. PV+ neurons produced a high density of eYFP+ GPe axons in the center of the STN (b) but not the dStr (a). In contrast, Npas1+ neurons project heavily to the dStr (a) but not the STN (b). Sections were also immunolabeled for HuCD (blue) to decipher the cytoarchitecture. A single confocal optical plane is illustrated in both examples. Right, High-magnification images corresponding to those shown on the left are included. c, Confocal micrographs depicting the results from retrograde tracing using Fluorogold injections into the STN. Top, Images showing the majority of STN-projecting GPe neurons (94 ± 2%, n = 664 neurons) were PV+. Bottom, Identical analysis in the Lhx6-eGFP mouse revealed that 41% (41 ± 4%; n = 639 neurons) of STN projection GPe neurons were Lhx6+. d, Representative examples of IPSC recordings in whole-cell voltage-clamped identified GPe neurons. IPSCs were evoked with electrical stimulation of the dStr ex vivo. cp, Cerebral peduncle; ZI, zona incerta.
To further examine which GPe neuron classes project to the STN, the retrograde tracer Fluorogold was injected into the STN, and tracer fluorescence was subsequently visualized in the GPe. This confirmed that the majority of STN-projecting neurons were PV+ neurons (PV+ = 94 ± 2%; PV− = 6 ± 2%; n = 664 neurons; Fig. 6b). Retrograde tracing of STN-projecting GPe neurons in Lhx6-GFP mice showed that 41% of STN-projecting neurons were Lhx6+ (41 ± 4%; n = 639 neurons). These data corroborated virus-mediated tracing results, demonstrating that Npas1+ neurons are distinct from PV+ neurons and Lhx6+ neurons in their axonal projection patterns.
To firmly establish that different classes of GPe neurons are indeed an integral part of the basal ganglia circuits, the primary input nucleus of the basal ganglia—the dStr—was stimulated. The occurrence of IPSCs was monitored in identified GPe neurons under voltage clamp using a high-chloride internal solution. IPSCs were readily evoked in all GPe neuron classes examined (PV+ = 9 of 9 neurons; Npas1+ = 14 of 14 neurons; Lhx6+ = 10 of 11 neurons; ChAT+ = 5 of 5 neurons; Fig. 6d).
GPe neuron classes differ in their autonomous and driven activity
Previous studies suggest that GPe neurons are heterogeneous in their electrophysiological behavior, including their autonomous pacemaking rate ex vivo (Kita and Kitai, 1991; Nambu and Llinaś, 1994; Cooper and Stanford, 2000; Bugaysen et al., 2010; Mastro et al., 2014). We asked whether these different GPe neuron classes have distinct physiological properties, thereby giving rise to the apparent heterogeneity of electrophysiological behavior observed when a mixed population of neurons is randomly sampled. To this end, PV+ neurons, Npas1+ neurons, Lhx6+ neurons, and ChAT+ neurons were identified and patch clamped (see Materials and Methods).
Cell-attached recording revealed that PV+ neurons had higher autonomous firing rates than Npas1+ neurons and Lhx6+ neurons (PV+ = 17.3 ± 3.6 Hz, n = 64; Npas1+ = 8.7 ± 3.4 Hz, n = 36; Lhx6+ = 12.2 ± 6.1 Hz, n = 18; p < 0.0001). In contrast, ChAT+ neurons displayed little spontaneous activity (ChAT+ = 1.5 ± 0.9 Hz, n = 8) or did not fire at all (5 of 13 neurons), consistent with the literature (Bengtson and Osborne, 2000; McKenna et al., 2013). The regularity of spike timing in identified GPe neurons was measured as a function of the CV in the interspike interval (ISI; Fig. 7a,c). PV+ neurons fired more regularly than Npas1+ neurons, Lhx6+ neurons, or ChAT+ neurons (PV+ = 0.14 ± 0.04, n = 64; Npas1+ = 0.26 ± 0.12, n = 36; Lhx6+ = 0.24 ± 0.07, n = 18; ChAT+ = 0.43 ± 0.24, n = 8; p < 0.0001). We did not investigate the cellular mechanisms that account for spike timing variability, as they are complex and incompletely understood (Deister et al., 2013).

Identified GPe neurons differ in their autonomous and driven activity. a, Representative cell-attached recordings from PV+ neurons, Npas1+ neurons, Lhx6+ neurons, and ChAT+ neurons identified by fluorescent protein expression in their respective mouse lines. b, Representative traces of maximum firing in response to current injection from PV+ neurons, Npas1+ neurons, Lhx6+ neurons, and ChAT+ neurons identified by fluorescent protein expression in their respective mouse lines. c, Top, Box plots summarizing the autonomous pacemaking rate in GPe neuron classes (PV+ = 17.3 ± 3.6 Hz, n = 64; Npas1+ = 8.7 ± 3.4 Hz, n = 36; Lhx6+ = 12.2 ± 6.1 Hz, n = 18; ChAT+ = 1.5 ± 0.9 Hz, n = 8; p < 0.0001, Kruskal–Wallis test). ChAT+ neurons were significantly different from all other cell classes examined. Second from top, Box plots summarizing the firing regularity (ISI CV) of GPe neuron classes (PV+ = 0.14 ± 0.04, n = 64; Npas1+ = 0.26 ± 0.12, n = 36; Lhx6+ = 0.24 ± 0.07, n = 18; ChAT+ = 0.43 ± 0.24, n = 8; p < 0.0001, Kruskal–Wallis test). Third from top, Box plots summarizing the maximum firing rate of GPe neuron classes (PV+ = 196 ± 5 Hz, n = 8; Npas1+ = 120 ± 10 Hz, n = 9; Lhx6+ = 106 ± 28 Hz, n = 15; ChAT+ = 6 ± 2 Hz, n = 9; p < 0.0001, Kruskal–Wallis test). ChAT+ neurons were significantly different from all other cell classes examined. Fourth from top, Box plots summarizing the current injection amplitude at which neurons reached their maximum rate (PV+ = 910 ± 105 pA, n = 8; Npas1+ = 600 ± 110 pA, n = 9; Lhx6+ = 330 ± 80 pA, n = 15; ChAT+ = 440 ± 90 pA, n = 9; p = 0.0008, Kruskal–Wallis test). Bottom, Box plots summarizing the rate accommodation (calculated as ratio of the first ISI to the last ISI in the spike train with maximum firing rate) in GPe neuron classes (PV+ = 0.74 ± 0.01, n = 8; Npas1+ = 0.61 ± 0.05, n = 9; Lhx6+ = 0.70 ± 0.07, n = 15; ChAT+ = 0.70 ± 0.3, n = 9; p = 0.0835, Kruskal–Wallis test). Medians ± MADs and two-tailed p values are listed. Medians, interquartile ranges, and 10th to 90th percentiles are also represented in a graphical format. Asterisks denote statistical significance level: *p < 0.05, **p < 0.01, ***p < 0.005, ****p < 0.001, Mann–Whitney U test.
Distinct firing levels and patterns of GPe neurons ex vivo have been previously reported (Kita and Kitai, 1991; Nambu and Llinaś, 1994; Cooper and Stanford, 2000; Bugaysen et al., 2010; Chuhma et al., 2011; Mastro et al., 2014). To survey the firing capacity of identified GPe neurons, currents of increasing intensity were intrasomatically injected until neurons went into depolarization block (Fig. 7b). PV+ neurons had higher maximum firing frequencies than Npas1+ neurons, Lhx6+ neurons, and ChAT+ neurons (PV+ = 196 ± 5 Hz, n = 8; Npas1+ = 120 ± 10 Hz, n = 9; Lhx6+ = 106 ± 28 Hz, n = 15; ChAT+ = 6 ± 2 Hz, n = 9; p < 0.0001). Furthermore, PV+ neurons were able to maintain firing in response to higher current injection amplitudes compared with the other neuron classes (PV+ = 910 ± 105 pA, n = 8; Npas1+ = 600 ± 110 pA, n = 9; Lhx6+ = 330 ± 80 pA, n = 15; ChAT+ = 440 ± 90 pA, n = 9; p = 0.0008; Fig. 7b,c). In line with this fast-spiking behavior of PV+ neurons, they also had a narrower action potential half-width (PV+ = 0.47 ± 0.04 ms, n = 20; Npas1+ = 0.69 ± 0.05 ms, n = 8; Lhx6+ = 0.73 ± 0.16 ms, n = 15; ChAT+ = 1.2 ± 0.10 ms, n = 13; p < 0.0001) and a more negative fast afterhyperpolarization (PV+ = −73.6 ± 1.7 mV, n = 20; Npas1+ = −68.6 ± 2.4 mV, n = 8; Lhx6+ = −68.4 ± 1.7 mV, n = 15; ChAT+ = −66.3 ± 2.5 mV, n = 13; p < 0.0001) than the other neuron classes. A complete listing of the action potential characteristics is shown in Table 3. The firing properties of identified GPe neurons are summarized in Figure 7.
Action potential and membrane characteristics of GPe neurons
GPe neuron classes differ in their intrinsic conductances
Several ion channels are known to be important for shaping autonomous pacemaking in GPe neurons, including HCN channels, Kv4 channels, delayed-rectifier potassium channels, and sodium channels (Chan et al., 2004, 2011; Mercer et al., 2007; Deister et al., 2009;). We sought to explore the possible differences in the currents mediated by these channels in PV+ neurons, Npas1+ neurons, and Lhx6+ neurons. Analysis of ChAT+ neurons was not pursued, as the autonomous activity in these neurons was absent or present only at low levels.
GPe neuron classes differed in their overall responsiveness to hyperpolarizing current injections (Fig. 8a,c). Voltage deflection (trough potential) produced by negative current injection (−160 pA) in PV+ neurons was less negative than that observed in other neuron classes (PV+ = −91.8 ± 8.8 mV, n = 33; Npas1+ = −132.7 ± 17.7 mV, n = 21; Lhx6+ = −114.3 ± 17.3 mV, n = 29; p < 0.0001). Sag ratio, which is a function of trough potential, was similarly smaller (PV+ = 1.04 ± 0.01, n = 33; Npas1+ = 1.16 ± 0.08, n = 21; Lhx6+ = 1.09 ± 0.06, n = 29; p < 0.0001). To assess whether the voltage responses were related to their HCN current amplitudes, whole-cell, voltage-clamp recordings from identified GPe neurons were performed. HCN channels were maximally activated with a voltage step to −130 mV from a holding potential of −50 mV (Robinson and Siegelbaum, 2003; Chan et al., 2004, 2011; Proenza and Yellen, 2006). Under this condition, PV+ neurons consistently exhibited larger HCN current than Npas1+ neurons and Lhx6+ neurons (PV+ = 168.4 ± 9.9 pA, n = 9; Npas1+ = 68.4 ± 7.1 pA, n = 11; Lhx6+ = 74.5 ± 28.4 pA, n = 9; p = 0.0001; Fig. 8b,c).

Identified GPe neurons have different levels of HCN currents. a, Representative voltage responses to a −160 pA current injection in PV+ neurons, Npas1+ neurons, and Lhx6+ neurons. b, Representative, leak-subtracted HCN currents evoked using a voltage step protocol (from −50 to −130 mV) in PV+ neurons, Npas1+ neurons, and Lhx6+ neurons. Capacitance transients were suppressed for clarity. c, Top, Scatter plot showing the relationship between trough and sag ratio in response to a −160 pA current injection in PV+ neurons (green), Npas1+ neurons (magenta), and Lhx6+ neurons (mustard). Middle, Box plots of trough potentials (PV+ = −91.8 ± 8.8 mV, n = 33; Npas1+ = −132.7 ± 17.7 mV, n = 21; Lhx6+ = −114.3 ± 17.3 mV, n = 29; p < 0.0001, Kruskal–Wallis test) and sag ratios (PV+ = 1.04 ± 0.01, n = 33; Npas1+ = 1.16 ± 0.08, n = 21; Lhx6+ = 1.09 ± 0.06, n = 29; p < 0.0001, Kruskal–Wallis test) in response to a −160 pA current injection in PV+ neurons, Npas1+ neurons, and Lhx6+ neurons. Bottom, Box plots of HCN current amplitude in PV+ neurons, Npas1+ neurons, and Lhx6+ neurons (PV+ = 168.4 ± 9.9 pA, n = 9; Npas1+ = 68.4 ± 7.1 pA, n = 11; Lhx6+ = 74.5 ± 28.4 pA, n = 9; p = 0.0001, Kruskal–Wallis test). Medians ± MADs and two-tailed p values are listed. Medians, interquartile ranges, and 10th to 90th percentiles are also represented in a graphical format. Asterisks denote statistical significance level: *p < 0.05, **p < 0.01, ***p < 0.005, ****p < 0.001, Mann–Whitney U test.
In addition to HCN currents, our past work suggests that Kv4-like K+ currents play a major role in regulating pacemaking in GPe neurons (Deister et al., 2009). As the main charge carrier underlying the afterhyperpolarization, Kv4-like K+ currents in GPe neurons deinactivate voltage-gated Na+ channels during each pacemaking cycle (Deister et al., 2009). As illustrated in Figure 9a, immunohistochemistry revealed that both Kv4.2 and Kv4.3 proteins were present in the GPe, consistent with the results of a previous study (Tkatch et al., 2000). These proteins were often colocalized, suggesting that both subunits can be expressed within a single cell (Fig. 9b). The functional expression of Kv4 channels on the somatodendritic processes of GPe neurons was demonstrated using voltage-clamp analysis. Using a biophysical method (Fig. 9c–e), Kv4-like K+ currents were readily detected in GPe neurons, consistent with previous studies (Stefani et al., 1992; Cooper and Stanford, 2000; Tkatch et al., 2000; Deister et al., 2009). PV+ neurons and Lhx6+ neurons displayed larger Kv4-like current amplitudes than Npas1+ neurons (PV+ = 419.8 ± 80.6 pA, n = 18; Npas1+ = 95.8 ± 19.3 pA, n = 7; Lhx6+ = 572.2 ± 120.2 pA, n = 12; p = 0.0001; Fig. 9c–e). To demonstrate the molecular identity of Kv4-like K+ currents in GPe neurons, voltage-clamp recordings from Kv4-null mutants (Kv4.2−/− and Kv4.3−/−) were performed. As expected, only very low levels (80.9 ± 17.9 pA, n = 11) of Kv4-like K+ currents were present in GPe neurons from Kv4-null mutants (Fig. 9d,e). These data were indistinguishable from those obtained from genetically identified Npas1+ neurons (p = 0.1509), suggesting that Npas1+ neurons do not express Kv4.2 or Kv4.3. The low current amplitudes observed in the Kv4-nulls were not due to a sampling bias toward recording from Npas1+ neurons, since the range (−82.8 to −130.5 mV, n = 10) of responses to a negative current (−160 pA) injection suggested both Npas1+ and PV+ neurons were represented in the dataset.

Identified GPe neurons have different levels of Kv4 currents. a, Light micrographs showing Kv4.2 (top) and Kv4.3 (bottom) immunoreactivity in the GPe and neighboring areas in two adjacent coronal mouse brain sections. amyg, Amygdala; GPi, internal globus pallidus; ic, internal capsule; Thal, thalamus. Higher-magnification images are showed on the right. b, Left, A composite confocal image showing the colocalization of Kv4.2 (cyan) and Kv4.3 (red) proteins in the GPe. Right, For clarity, the two channels are separated and presented in monochrome. c, Representative voltage-clamp recordings of Kv4-like current in identified PV+ neurons (n = 10), Npas1+ neurons (n = 6), and Lhx6+ neurons (n = 4). A family of currents was elicited from −70 to 0 mV from a holding potential of −50 mV. Prepulses at −110 and −40 mV were used to biophysically isolate Kv4-like currents (bottom). Voltage protocol for the isolation is illustrated as an inset. d, Difference currents (at −30 mV) were measured in identified GPe neurons and in double-null mutants (Kv4.2−/− and Kv4.3−/−). A representative recording from each cell group is shown. e, Box plots summarizing the amplitude of difference (top) currents (PV+ = 419.8 ± 80.6 pA, n = 18; Npas1+ = 95.8 ± 19.3 pA, n = 7; Lhx6+ = 572.2 ± 120.2 pA, n = 12; nulls = 80.9 ± 17.9 pA, n = 11; p = 0.0001, Kruskal–Wallis test) and sustained (bottom) current (PV+ = 388.0 ± 92.9 pA, n = 18; Npas1+ = 128.0 ± 70.9 pA, n = 7; Lhx6+ = 244.8 ± 28.4 pA, n = 12; nulls = 429.8 ± 142.2 pA, n = 11; p < 0.0001, Kruskal–Wallis test) measured in different GPe cell groups. Medians ± MADs and two-tailed P values are listed. Medians, interquartile ranges, and 10th to 90th percentiles are also represented in a graphical format. Asterisks denote statistical significance level: *p < 0.05, **p < 0.01, ***p < 0.005, ****p < 0.001, Mann–Whitney U test.
As the sustained (slow or noninactivating) K+ current was recorded alongside the Kv4-like K+ current recordings, a comparison between PV+ neurons, Npas1+ neurons, and Lhx6+ neurons was made. As illustrated in Figure 9e, the sustained K+ current in response to a −30 mV voltage step was larger in PV+ neurons than in Npas1+ neurons or Lhx6+ neurons (PV+ = 388.0 ± 92.9 pA, n = 18; Npas1+ = 128.0 ± 70.9 pA, n = 7; Lhx6+ = 244.8 ± 28.4 pA, n = 12; p < 0.0001). The general properties of this current were consistent with those of the classic delayed rectifier currents (Baranauskas et al., 1999; Coetzee et al., 1999; Rudy and McBain, 2001; Gutman et al., 2005). In support of these currents not being mediated by Kv4.2 and Kv4.3 channels, the size of this current in Kv4-null mutants was statistically indistinguishable from that in PV+ neurons (PV+ = 388.0 ± 92.9 pA, n = 18; Kv4-null = 429.8 ± 142.2 pA, n = 11; p = 0.7024). The larger amplitude of this current in PV+ neurons was consistent with their narrower action potential width and more hyperpolarized fast afterhyperpolarization compared with the other cell classes (Table 3).
Finally, as PV+ neurons displayed higher levels of autonomous pacemaking, a faster rate of rise in their action potentials, and lower action potential threshold compared with other cell classes (Table 3), we measured persistent Na+ (NaP) current as an estimate for voltage-gated Na+ channel expression in GPe neurons. Consistent with their action potential characteristics, PV+ neurons had larger NaP currents than PV− neurons (PV+ = 129.9 ± 27.9 pA, n = 12; PV− = 47.6 ± 12.6 pA, n = 6; p = 0.0020; Fig. 10).

PV+ and PV− GPe neurons have different levels of persistent Na+ currents. a, Representative voltage records of persistent sodium (NaP) currents evoked using a voltage ramp protocol (inset) in PV+ neurons and PV− neurons. b, Box plots of NaP amplitude in PV+ neurons and PV− neurons (PV+ = 129.9 ± 27.9 pA, n = 12; PV− = 47.6 ± 12.6 pA, n = 6; p = 0.0020, Mann–Whitney U test). Medians ± MADs and two-tailed p values are listed. Medians, interquartile ranges, and 10th to 90th percentiles are also represented in a graphic format. Asterisks denote statistical significance level: ***p < 0.005, Mann–Whitney U test.
GPe neuron classes differ in their autonomous activity in a PD model
We previously found that autonomous activity of GPe neurons is reduced in both acute and chronic dopamine-depletion models of PD (Chan et al., 2011). However, as the identities of GPe neurons in this study were not known, we did not know whether distinct classes of GPe neurons differed in their responsiveness to dopamine depletion. To pursue this, we first examined the autonomous activity of randomly sampled GPe neurons in wild-type mice. As expected, the firing rate was reduced in the 6-OHDA lesioned condition, consistent with previous observations (naive = 17.1 ± 3.7 Hz, n = 37; 6-OHDA = 7.3 ± 5.8, n = 46; p = 0.0002; Fig. 11a). To determine whether distinct classes of GPe neurons responded differently to 6-OHDA lesion, we recorded from identified neurons in the PV-tdTom and Npas1-tdTom mice. We found that autonomous firing of PV+ neurons remained constant between naive and 6-OHDA-lesioned mice (naive = 18.9 ± 3.7 Hz, n = 54; 6-OHDA = 18.4 ± 3.3 Hz, n = 21; p = 0.6753). In contrast, PV− neurons exhibited a reduction in their autonomous activity in the 6-OHDA-lesioned mice (naive = 11.6 ± 3.3 Hz, n = 25; 6-OHDA = 3.2 ± 3.3, n = 12; p = 0.0156; Fig. 11b,c). Concordantly, we found that Npas1+ neurons have reduced autonomous activity in the 6-OHDA-lesioned mice (naive = 9.1 ± 3.8, n = 41; 6-OHDA = 3.1 ± 1.5, n = 7; p = 0.0005), whereas Npas1− neurons have unaltered autonomous activity under the same condition (naive = 18.5 ± 3.6 Hz, n = 24; 6-OHDA = 17.4 ± 3.1 Hz, n = 7; p = 0.8687; Fig. 11b,d).

Autonomous firing of Npas1+ neurons is selectively reduced in a mouse model of PD. a, Frequency distribution histograms of unidentified GPe neurons in naive (black) and 6-OHDA lesioned (red) mice (naive = 17.1 ± 3.7 Hz, n = 37; 6-OHDA = 7.3 ± 5.8, n = 46; p = 0.0002). b, Representative cell-attached recordings from PV+ neurons and Npas1+ neurons in naive (black) and 6-OHDA lesioned (red) mice. Neurons were identified by fluorescent protein expression in PV-tdTom and Npas1-tdTom mouse lines. c, Frequency distribution histograms of PV+ neurons (left) and PV− neurons (middle) in naive (black) and 6-OHDA lesioned (red) PV-tdTom mice. Data are summarized as a cumulative plot (right). d, Frequency distribution histograms of Npas1− neurons (left) and Npas1+ neurons (middle) in naive (black) and 6-OHDA lesioned (red) PV-tdTom mice. Data are summarized as a cumulative plot (right).
Discussion
We generated a novel Npas1 BAC mouse and antibodies for the identification of GPe neurons. Using these tools along with available transgenic mice, we studied distinct classes of genetically defined neurons in the mouse GPe. Our present study argues that PV+ GPe neurons and Npas1+ GPe neurons are unique in their anatomical projections, intrinsic properties, and sensitivity to chronic dopamine depletion and should therefore be considered distinct functional neuron classes.
Molecular evidence for distinct GPe neuron classes
The cellular complexity of the GPe has been a long-standing question. Although several lines of evidence suggest multiple neuron classes exist within the GPe, their classification has been difficult due in part to a paucity of genetic tools with which to identify them. In the current study, we generated a novel Npas1 BAC transgenic mouse line to complement existing transgenic lines, and identified GPe neuron classes based on their expression of PV, Npas1, Lhx6, and ChAT.
Most previous studies converge on the idea that the GPe comprises one predominant cell class (DeLong, 1971; Bergstrom and Walters, 1981; Iwahori and Mizuno, 1981; DiFiglia et al., 1982; François et al., 1984; Nambu and Llinaś, 1994; Flandin et al., 2010). Our finding that PV is expressed in the majority (55%) of GPe neurons is consistent with this idea (Hontanilla et al., 1994; Kita, 1994; Rajakumar et al., 1994; Hoover and Marshall, 1999; Mallet et al., 2012). However, we also found that Npas1, Lhx6, and Foxp2 are expressed in large populations of neurons within the GPe. Consistent with previous studies, we found that expression of Npas1 and PV is segregated in the GPe and throughout the brain (Nóbrega-Pereira et al., 2010; Stanco et al., 2014; Dodson et al., 2015), suggesting these markers are identifiers of neurons with unique properties. Our anatomical and electrophysiological analyses corroborate this idea.
On the other hand, we found that 53% of Lhx6+ GPe neurons coexpress either Npas1 or PV. The remaining Lhx6+ GPe neurons, amounting to 14% of the total GPe neuron population, were devoid of both PV and Npas1. Though estimates of the number of eGFP-labeled GPe neurons in the Lhx6-eGFP mice are vastly different between research groups (Mastro et al., 2014; Abdi et al., 2015; Dodson et al., 2015), independent observations from all three laboratories converge on the existence of a subset of Lhx6+ GPe neurons devoid of expression of other markers tested in their respective studies. In agreement with the idea of a unique Lhx6+ GPe neuron class, our electrophysiological measurements have hinted at features that are unique in Lhx6+ neurons rather than merely representing a sampling from a mixture of PV+ neurons and Npas1+ neurons. Unfortunately, as Lhx6-eGFP expression alone is insufficient to delineate this GPe neuron class, alternative genetic tools will be needed in the future to help classify GPe neurons and reconcile the discrepancies across different laboratories.
Quantification of PV+ neurons (55%) and Npas1+ neurons (27%), along with Lhx6+-PV−-Npas1− neurons (14%), Foxp2+-Npas1− (5%) neurons, and ChAT+ (5%) neurons, suggests we are able to account for all neurons within the confines of the GPe (Fig. 12). Our findings thus provide a revised classification of mouse GPe neurons. As additional neuron subclasses appear to exist within the GPe, future molecular analyses will be useful in their genetic definition.

Diagrams summarizing the classification scheme derived from the current study. a, A diagram showing the neuronal makeup of the mouse GPe. PV+ neurons (green), Npas1+ neurons (magenta), Lhx6+ neurons (mustard), Foxp2+ neurons (teal), and ChAT+ neurons (rust) are included in this classification scheme. The area of the rectangles represents the size of each neuron population. ChAT+ neurons are 5% of the total GPe neuron population and show no overlap with other known classes of GPe neurons. b, PV+ neurons and Npas1+ neurons are two principal, largely nonoverlapping neuron classes in the mouse GPe. They represent 55% and 27% of the total GPe neuron population. PV+ neurons and Foxp2+ neurons are also nonoverlapping. The latter constitutes 24% of the total GPe population. In contrast, 27% of PV+ neurons are Lhx6+. c, Npas1+ neurons and Foxp2+ neurons are two largely overlapping populations; 80% of Foxp2 neurons express Npas1. The remaining (28%) Foxp2−-Npas1+ population is Lhx6+.
GPe neurons in relation to the basal ganglia circuitry
GPe neurons receive their primary GABAergic input from the dStr (Albin et al., 1989; Graybiel, 1991; Kita and Kitai, 1994; Wichmann and DeLong, 1996; Smith et al., 1998b; Bolam et al., 2000; Bevan et al., 2002; Kita et al., 2004; Rivlin-Etzion et al., 2006; Jaeger and Kita, 2011), but it was unknown whether all GPe neurons receive dStr inputs. We found that PV+ neurons, Npas1+ neurons, Lhx6+ neurons, and ChAT+ neurons universally receive GABAergic input from the dStr.
In contrast to their afferents, axonal projection patterns are distinct between different GPe neuron classes. We found that the 94% of STN-projecting neurons are PV+; this is consistent with previous studies and with the classic basal ganglia (Albin et al., 1989; Parent and Hazrati, 1995; Wichmann and DeLong, 1996; Smith et al., 1998a; Bevan et al., 2002; Mallet et al., 2012). We found that 41% of STN-projecting neurons are Lhx6+, suggesting many STN-projecting neurons coexpress Lhx6 and PV. On the other hand, Npas1+ neurons do not project heavily to the STN; instead, they project heavily to the dStr. This provides new information about the pallidostriatal projection that has been described for decades (Nauta, 1979; Staines et al., 1981; Beckstead, 1983; Jayaraman, 1983; Parent and De Bellefeuille, 1983; Staines and Fibiger, 1984; Smith and Parent, 1986; Shu and Peterson, 1988; Walker et al., 1989; Rajakumar et al., 1994; Spooren et al., 1996; Nambu and Llinaś, 1997; Bevan et al., 1998; Kita et al., 1999; Sato et al., 2000; Kita and Kita, 2001; Mallet et al., 2012).
The distinct projection targets of PV+ GPe neurons and Npas1+ GPe neurons suggest that they have different functional roles within the basal ganglia circuit. The traditional basal ganglia circuit model predicts that tonic activity of GPe neurons leads to the suppression of firing in basal ganglia output nuclei and consequential disinhibition of motor activity (DeLong, 1990; Wichmann and DeLong, 1996; Graybiel, 2000). Since the majority of GPe neurons belong to the downstream-projecting PV+ class, it is likely that they perform the role traditionally ascribed to the GPe as a whole. In contrast, Npas1+ neurons may broadly dampen striatal output to inhibit unwanted motor programs (Gage et al., 2010). PV+ GPe neurons and Npas1+ GPe neurons may also be differentially involved in encoding movement sequences (Dodson et al., 2015). The idea of distinct roles for GPe neuron classes is supported by studies showing GPe neurons can have distinct patterns of firing activity within different temporal phases of a movement sequence (Anderson and Horak, 1985; Turner and Anderson, 2005; Jin et al., 2014). The novel Npas1-tdTom line and antibodies described in this study should facilitate future studies of the role of Npas1+ GPe neurons in motor behavior.
Intrinsic properties of GPe neurons
Additional rationale for the division of GPe neurons into distinct classes comes from studies of their electrophysiological properties. Perhaps most well known is the seminal in vivo recording study conducted by DeLong (1971) in behaving monkeys in which GPe neurons were grouped into “high-frequency pausers” and “low-frequency bursters” on the basis of their autonomous firing patterns. Although many factors differentiate neuron electrophysiology in ex vivo mouse brain slices from that in behaving monkeys, we speculate that the rapidly firing PV+ neurons that we characterized correspond to the high-frequency pausers described by DeLong (1971), and that the more slowly firing Npas1+ neurons correspond to the low-frequency bursters. In their in vivo studies in rats and mice, Mallet et al. (2008), Mallet et al. (2012), Abdi et al. (2015), and Dodson et al. (2015) divided GPe neurons into two classes based on their activity levels in relation to cortical slow-wave oscillations, which in their later work they term “arkypallidal” neurons and “prototypical” neurons. They suggest that these two classes correspond approximately to those described earlier by DeLong (1971). The dichotomy of the prototypical and arkypallidal firing patterns of the neurons was similar to ours in that PV+ neurons fired more rapidly and Npas1+ neurons fired more slowly. Our current study thus identifies molecular markers that correlate with previously described heterogeneity in the intrinsic properties of GPe neurons in ex vivo slices (Kita and Kitai, 1991; Nambu and Llinaś, 1994; Cooper and Stanford, 2000; Bugaysen et al., 2010; Chuhma et al., 2011). Although many aspects of GPe neuron physiology and anatomy fit well into a dichotomous framework, our results also hinted that GPe neuron classification is more complex. It will be helpful in the future to classify GPe neurons in an unbiased fashion using single-cell transcriptomic analysis (Tang et al., 2009; Lovatt et al., 2014; Poulin et al., 2014; Zeisel et al., 2015).
We found that autonomous activity in Npas1+ GPe neurons is decreased in a chronic 6-OHDA lesion model of PD, while autonomous activity in PV+ GPe neurons is preserved. This suggests that the reduced activity in unidentified GPe neurons, observed previously in our ex vivo work (Chan et al., 2011), was in part attributable to sampling from Npas1+ GPe neurons (Chan et al., 2011). The reduced activity observed in Npas1+ GPe neurons may be a homeostatic response to chronic strengthening of excitatory drive. Computational models suggest that GABAA conductances in spiny projection neurons are important in regulating local membrane properties and subsequently, the power of antikinetic β-oscillations in the dStr (McCarthy et al., 2011; Damodaran et al., 2014). As Npas1+ GPe neurons have dense projections to the dStr, it is conceivable that Npas1+ GPe neurons may contribute to the aberrant dStr activity in the chronic PD model.
Footnotes
This work was supported by grants to K.E.G. [a Parkinson's Disease Foundation fellowship and National Institutes of Health (NIH) Grant NS-041234], J.E.P. (NIH Grants AG-020506 and AG-047782), N.J.J. (NIH Grant AG-036738), and C.S.C. (NIH Grants NS-069777, NS-069777-S1, and NS-047085). We thank Bonnie Erjavec, Thomas Madathany, and Elizabeth Augustine for their technical assistance; and members of the Chan laboratory for helpful discussions.
The authors declare no competing financial interests.
- Correspondence should be addressed to C. Savio Chan, Department of Physiology, Feinberg School of Medicine, Northwestern University, 303 East Chicago Avenue, Chicago, IL 60611. saviochan{at}gmail.com


