

Article Figures & Data
Figures
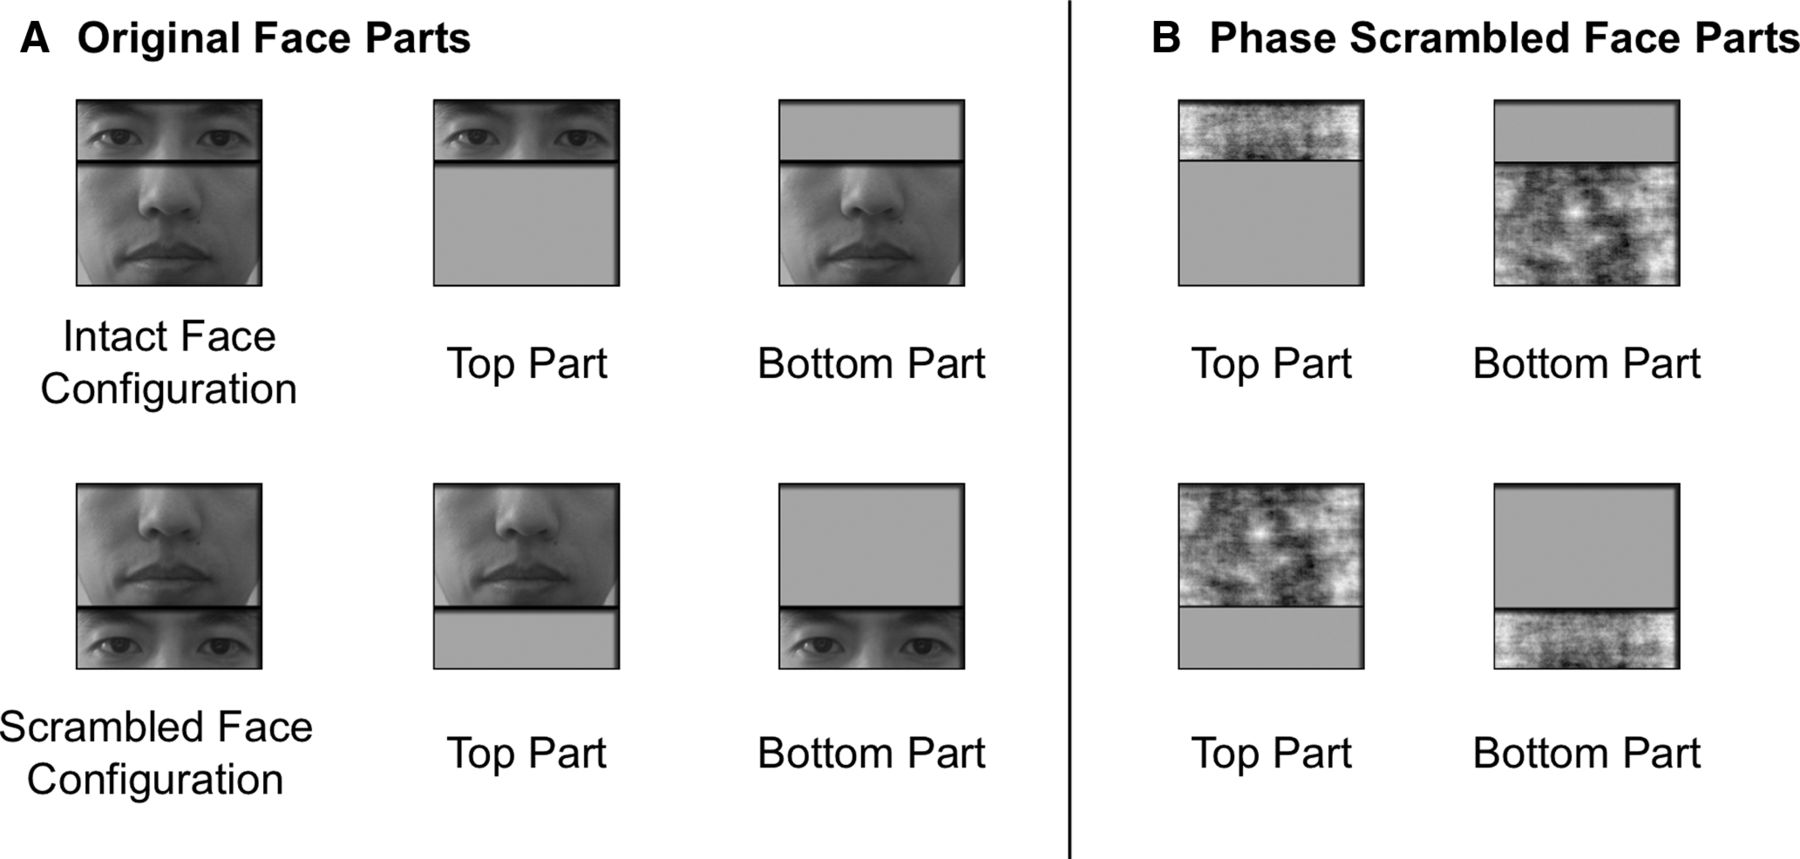
- Figure 1.
An illustration of the face stimuli used in the experiments. A, The stimuli used in the main experiment. These stimuli were created by gray-scaling male East Asian faces and dividing each face into two parts, with the upper part containing the eyes and the lower part containing the nose and the mouth. The two face parts were presented together either in the intact face configuration (the eyes above the nose and the mouth), or in a scrambled configuration (the eyes below the nose and the mouth). Each face part was also presented alone at the same location where it appeared in the intact and the scrambled faces. To make the transition between the two face parts similar and smooth in the intact and scrambled images, a black bar was added between the face parts in both conditions. B, The phase-scrambled face parts used in the follow-up control experiment. These were created by phase scrambling the face parts used in the main experiment to remove any recognizable face features but retain the same low-level visual features present in the intact face parts (such as size, luminance, and spatial frequency distribution profiles).
- Figure 2.
Face selective brain regions (faces > objects) in the right hemisphere of all seven DPs and all 12 controls shown on inflated brain surfaces. The dashed outline indicates the location of the right FFA on each brain. Activation maps were marked for the eight controls whose right FFA size matched that of DPs and whose data were included in the main MVPA analysis. RH, Right hemisphere; L, lateral; P, posterior; Controls, observers without developmental prosopagnosia.
- Figure 3.
Mean fMRI response amplitudes in the right FFA for the different object categories. Both DPs (left graph) and controls (middle and right graphs) showed equally strong face selectivity. The results were nearly identical whether all 12 (middle graph) or only the eight controls with a matching right FFA size were included (right graph). Error bars indicate SEM. Controls, Observers without developmental prosopagnosia.
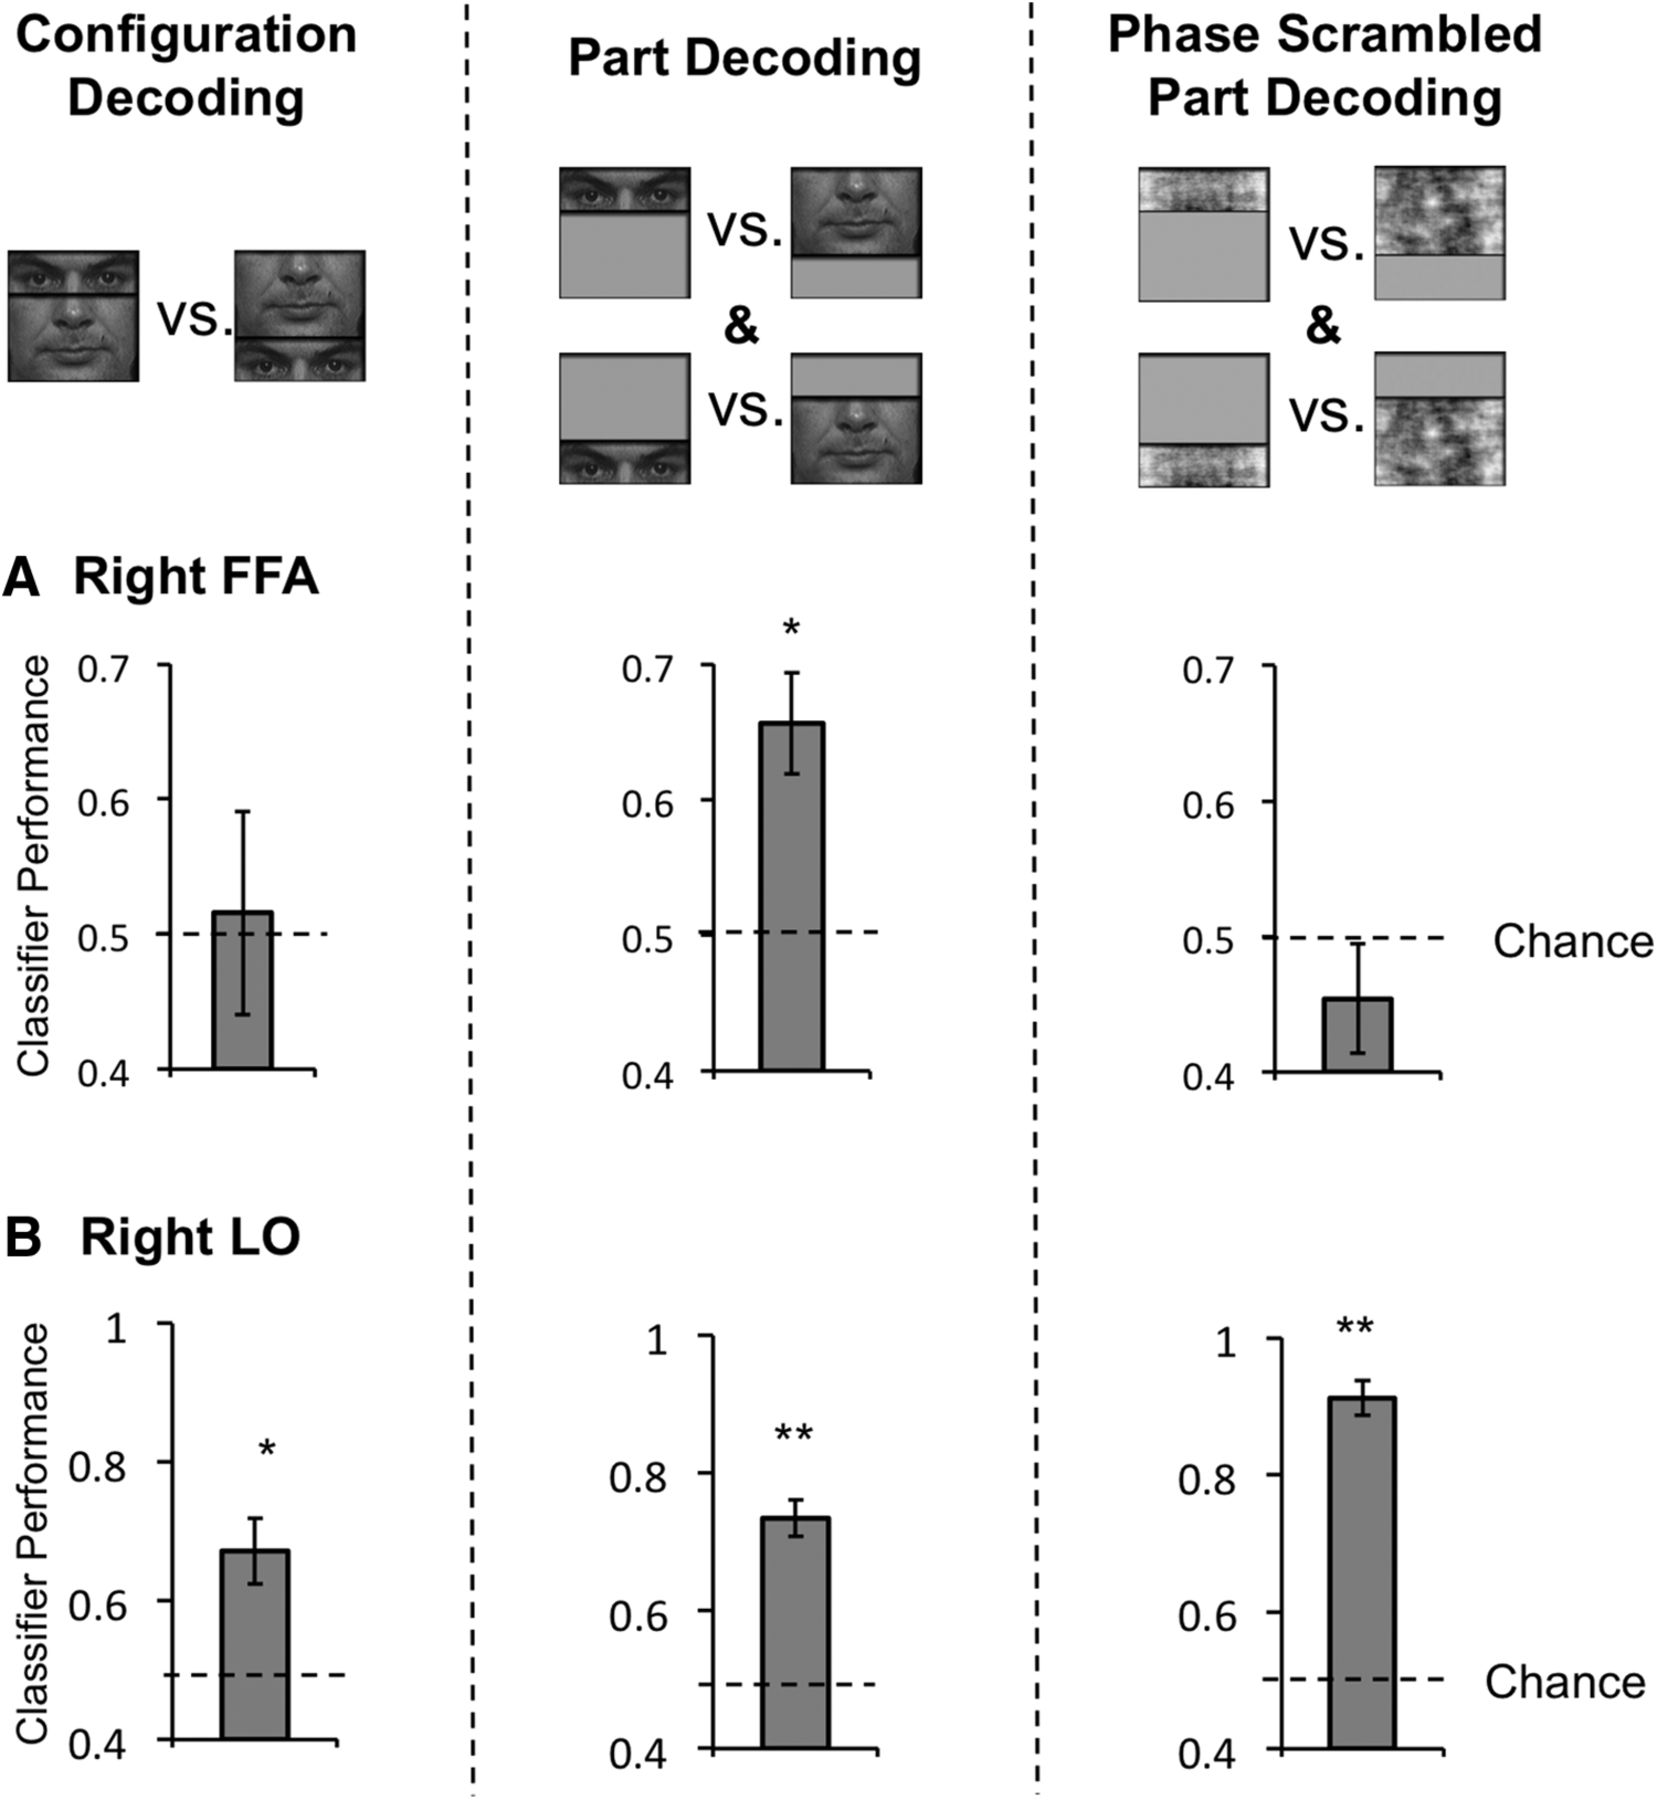
- Figure 4.
fMRI MVPA decoding performance in the main experiment for the seven DPs, the eight controls whose right FFA sizes matched those of DPs, and all 12 controls. Overall, very similar results were obtained whether 8 or 12 controls were included in the analyses. A, Right FFA decoding results. Left, Decoding was at chance for the intact and the scrambled faces in DPs, but was significantly above chance in controls, with a significant between group differences. Middle, Decoding for the two face parts shown at the same location was marginally significant in DPs and significant in controls, with no between group differences. Right, Decoding for the same face part shown at different locations was at chance for both DPs and controls. B, Right LO decoding results. Decoding was significant for all three comparisons, with no between group differences. Error bars indicate SEM; †p < 0.10, *p < 0.05, **p < 0.01; NS, nonsignificant; Ctrls, control observers without developmental prosopagnosia.
- Figure 5.
fMRI MVPA decoding performance in the two follow-up experiments. Results in the left two columns are from the follow-up DP experiment in which four DPs were tested with Caucasian faces as the stimuli. Results in the right column are from the follow-up control experiment in which 6 controls were tested with phase scrambled face parts. A, Right FFA decoding results. Left, Replicating the results from the main experiment, decoding for face configurations was at chance in DPs. Middle, Again replicating the results from the main experiment, decoding for face parts shown at the same location was significantly above chance in DPs. Right, Decoding for phase-scrambled face parts was at chance in controls. B, Right LO decoding results. Decoding was significantly above chance for all three comparisons. Error bars indicate SEM; *p < 0.05, **p < 0.01.
- Figure 6.
Mean univariate fMRI response amplitude measures for the different face stimuli used in the main experiment in the right FFA and the right LO. Results were shown for the seven DPs, the eight controls whose right FFA sizes matched those of DPs, and all 12 controls. Overall, the univariate measures produced similar, but weaker and less consistent results compared with those from MVPA. A, Right FFA response amplitudes. B, Right LO response amplitudes. Left, Response amplitudes for the intact and the scrambled face configurations. Middle, Response amplitudes for the two face parts averaged over the two presentation locations. Right, Response amplitudes for the two presentation locations averaged over the two face parts; † p< 0.10, *p < 0.05, **p < 0.01; NS, nonsignificant; Ctrls, control observers without developmental prosopagnosia.


Tables
Participant Gender Age Famous faces task Accuracy, % Z-score DP1 M 29 33.4 −4.48 DP2 M 28 66.7 −1.77 DP3 M 28 36.7 −4.21 DP4 F 28 16.7 −5.83 DP5 M 27 26.7 −5.02 DP6 M 26 43.4 −3.66 DP7 F 25 40.1 −3.94 DP8 M 28 46.7 −3.40 DP mean (SD) 6M/2F 27.4 (1.4) 38.8 (14.8) −4.04 (1.20) Control mean (SD) 6M/6F 25.5 (3.8) 91.6 (14.2) 0.25 (1.15) DP1–DP7 participated in the main experiment; DP1, DP4, DP5, and DP8 participated in the follow-up DP experiment. M, Male; F, female; SD, standard deviation.


