

Article Figures & Data
Figures
- Figure 1.
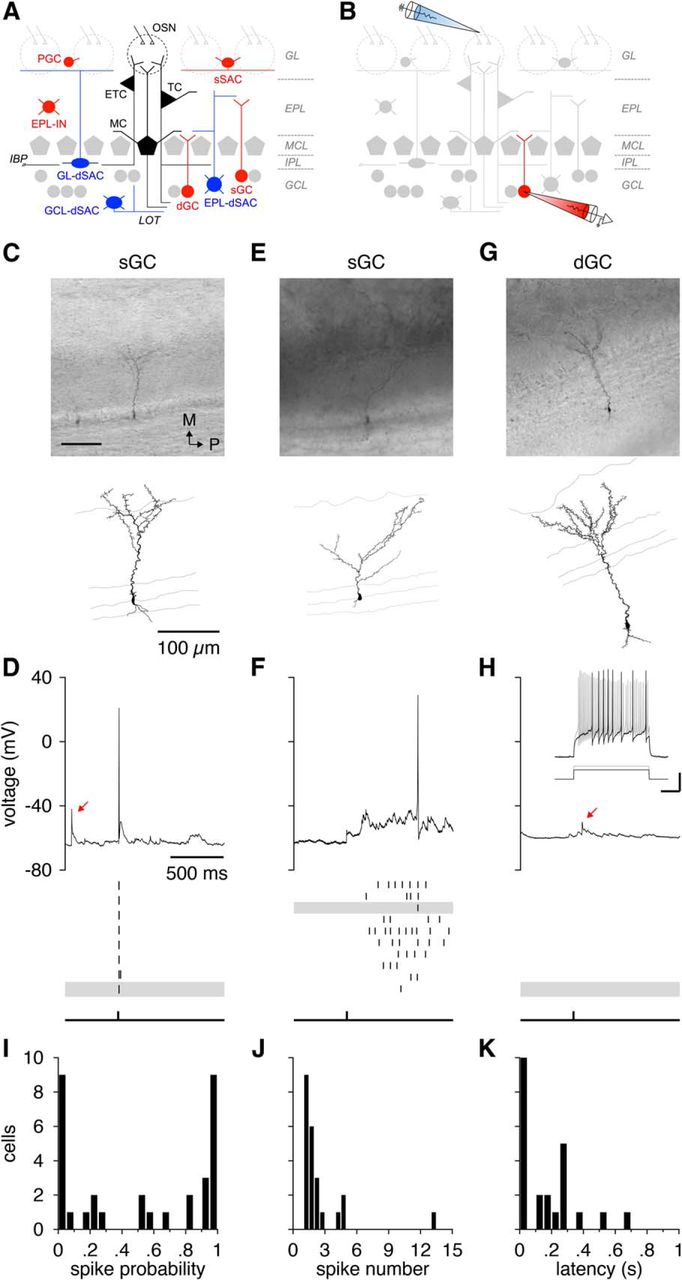
Glomerular activation drives asynchronous subthreshold and suprathreshold excitation of GCs. A, Circuitry of the MOB. Excitatory cell classes are shown in black. Inhibitory cell classes targeting excitatory cells are shown in red. Inhibitory cell classes targeting other inhibitory cells are shown in blue. GL, Glomerular layer; IPL, internal plexiform layer; ETC, external tufted cell; PGC, periglomerular cell; sSAC, superficial short-axon cell; EPL-IN, EPL-interneuron; GL-dSAC, GL-projecting dSAC; EPL-dSAC, EPL-projecting dSAC; GCL-dSAC, GCL-projecting dSAC; IBP, intrabulbar projection; LOT, lateral olfactory tract. B, Experimental design. GC activity was monitored using whole-cell patch-clamp recordings while single glomeruli were activated by low-level stimulation of OSN axons. C, Bright-field image (top; scale bar, 100 μm) and morphological reconstruction (bottom) of a representative sGC. Gray lines in this and all subsequent reconstructions correspond to the cell layers labeled in A. M, Medial; P, posterior. D, Representative voltage trace (top) and raster plot of spike times across multiple trials (middle) after a single OSN stimulation pulse (bottom) for the sGC shown in C. The highlighted trial in this and all subsequent raster plots corresponds to the representative trace shown. Red arrow marks a spontaneous spikelet. E, F, Same as C and D for another sGC showing a barrage of asynchronous EPSPs and unreliable, long-latency firing. G, H, Same as C and D for a representative dGC showing subthreshold excitation and spikelets (inset: suprathreshold response to step current injections; calibration: 0.5 s, 20 mV/100 pA). I, Histogram of mean spike probabilities across all trials. Note that several GCs exhibit only subthreshold responses. J, K, Histograms of mean number of spikes evoked (J) and mean first-spike latencies (K) per suprathreshold trial.
- Figure 2.
GCs integrate asynchronous synaptic excitation and synchronous synaptic inhibition. A, Bright-field image (left; scale bar, 100 μm) and morphological reconstruction (right) of a representative sGC. B, Representative excitatory current trace (top) and raster plot of EPSC times across multiple trials (middle) after a single OSN stimulation pulse (bottom) for the GC shown in A. C, PSTH of EPSC times plotted in B. Solid and dashed red lines and coloring show the mean and 95% confidence interval, respectively, of the EPSC probability 500 ms before OSN stimulation. D, Mean PSTH of EPSC times across sGCs. Shading denotes mean ± SEM. Red line shows a single-exponential fit. E–G, Same as B–D for synaptic inhibition onto sGCs. H–N, Same as A–G for dGCs.
- Figure 3.
Synaptic inhibition onto GCs is reliable across physiological theta frequency sniff rhythms. A, Bright-field image (left; scale bar, 100 μm) and morphological reconstruction (right) of a representative sGC. B, Representative excitatory current trace (top) and raster plot of EPSC times across multiple trials (middle) after five OSN stimulation pulses at 4 Hz (bottom) for the GC shown in A. C, PSTH of EPSC times plotted in B. Solid and dashed red lines and coloring show the mean and 95% confidence interval, respectively, of the EPSC probability 500 ms before the first OSN stimulation pulse. D, Mean PSTH of EPSC times across GCs. Shading denotes mean ± SEM. E–G, Same as B–D for synaptic inhibition onto GCs.
- Figure 4.
Glomerular activation drives reliable short-latency dSAC firing. A, Experimental design. dSAC activity was monitored using whole-cell patch-clamp recordings while single glomeruli were activated by low-level stimulation of OSN axons. B, Bright-field image (top; scale bar, 100 μm; inset: axonal boutons in the EPL) and morphological reconstruction (bottom; axon colored red) of a representative EPL-dSAC. C, Representative voltage trace (top) and raster plot of spike times across multiple trials (middle) after a single OSN stimulation pulse (bottom) for the EPL-dSAC shown in B. Note the highly reliable short-latency firing after OSN stimulation. D–G, Same as B and C for a second EPL-dSAC (D, E) and a representative GL-dSAC (F, G). Inset, GL-dSAC firing (or depolarization on a subthreshold trial) followed OSN stimulation (note the stimulus artifact) with a nonzero latency, consistent with synaptic excitation and non-antidromic stimulation by the extracellular stimulation electrode positioned within the ONL. H, Cumulative distributions of the mean first-spike latencies of MCs/TCs (from Burton and Urban, 2014) and dSACs and the onset of inhibition onto GCs after OSN stimulation. IPL, Internal plexiform layer; EPL-dSAC, EPL-projecting dSAC; GCL-dSAC, GCL-projecting dSAC.
- Figure 5.
Feedforward inhibition onto GCs is localized to proximal somatodendritic and distal apical dendritic domains. A, Experimental design. Feedforward inhibitory currents were recorded in GCs (clamped at the reversal potential of synaptic excitation) while focally puffing the GABAAR antagonist GBZ (with Alexa Fluor 488) near distal apical dendritic or proximal somatodendritic domains. B, Inhibitory current traces across multiple trials (top) after a single OSN stimulation pulse (bottom) in a representative GC, with transient application of GBZ near the soma (Bi; scale bar, 20 μm) or an apical dendritic branch (Bii). Note that GBZ (imaged just before puff termination) remained strongly localized throughout the duration of the puff application. C, Time course of peak inhibitory currents before, during (shaded regions), and after GBZ application. Gaps in data correspond to periods during which the puffing pipette was positioned and data were not collected. Note that both proximal (prox) somatodendritic and distal (dist) apical dendritic GBZ application reduced strongly the peak inhibitory currents recorded. D, E, Same as B and C for a second representative GC showing a strong reduction in peak inhibitory currents during proximal somatodendritic but not distal apical dendritic GBZ application. F, The decrease in mean peak inhibitory current during proximal or distal GBZ application relative to the mean peak current preceding GBZ application. Red lines and points correspond to the representative cells shown in B–E. Both proximal (p = 1.1 × 10⁻³, one-tailed t test; n = 5) and distal (p = 0.027, one-tailed t test; n = 7) GBZ application yielded average reductions in peak inhibitory currents that were significantly greater than zero. G, Same as F but plotting the decrease in peak inhibitory current for the trial immediately following the onset of GBZ application, at which point GBZ diffusion away from the site of application was at a minimum. Proximal GBZ application led to an immediate reduction in the peak inhibitory current (p = 4.5 × 10⁻³, one-tailed t test; n = 5), whereas distal GBZ application did not lead consistently to an immediate reduction in the peak inhibitory current (p = 0.11, one-tailed t test, n = 7). IPL, Internal plexiform layer. *p < 0.05; **p < 0.01.
- Figure 6.
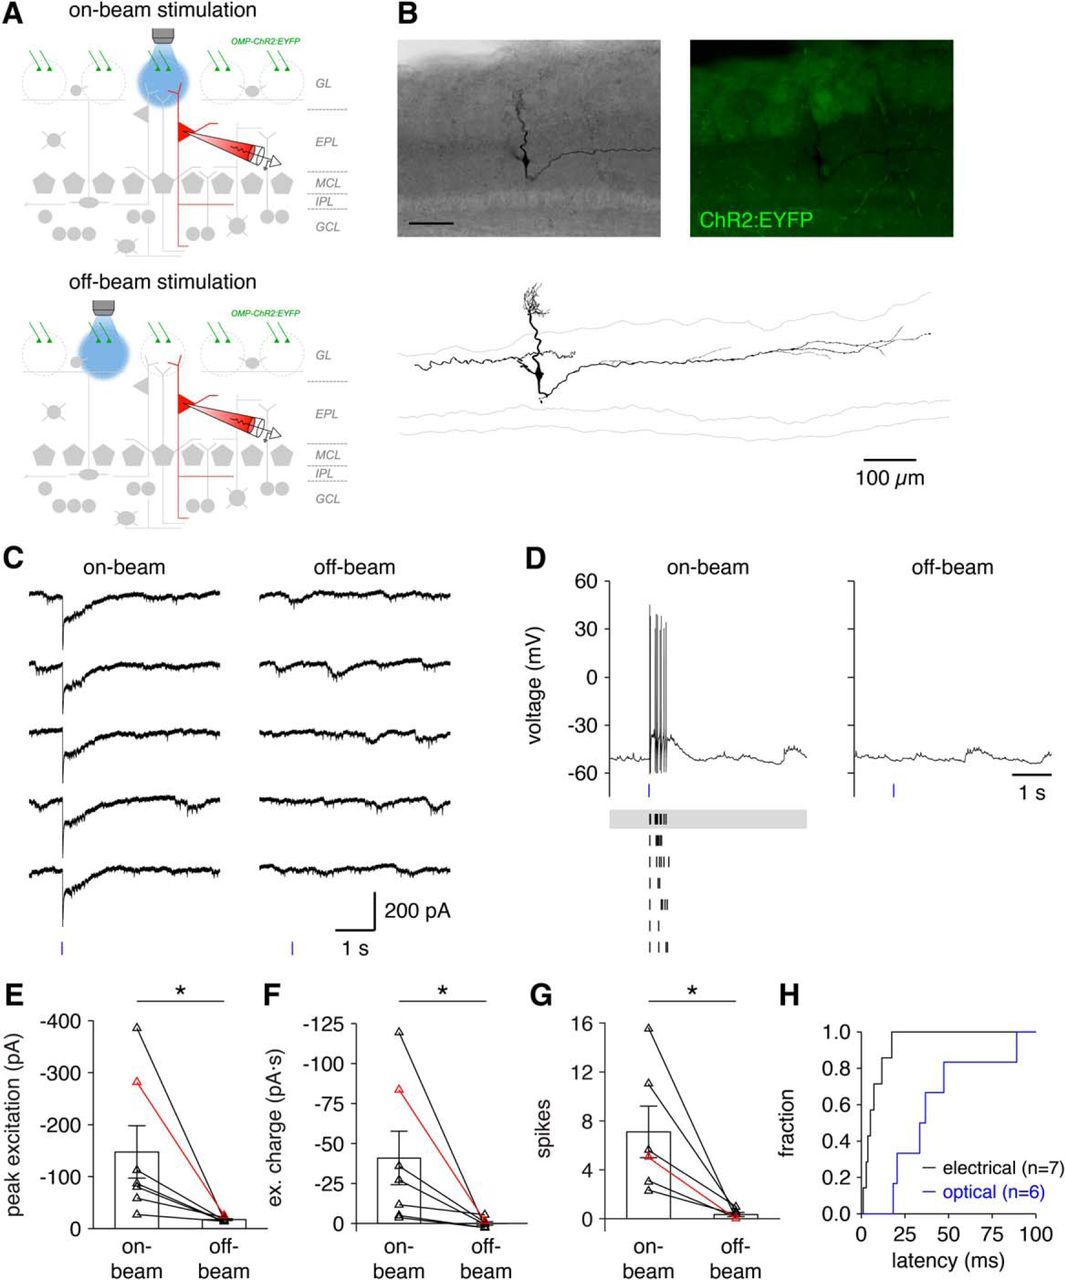
Optical activation of single glomeruli in gene-targeted OMP–ChR2:EYFP mouse brain slices. A, Experimental design. B, Bright-field (top left; scale bar, 100 μm) and epifluorescent (top right) images and morphological reconstruction (bottom) of a representative TC. C, Example current traces after brief targeted photostimulation (blue line) of the on-beam glomerulus (left) or rostrally neighboring off-beam glomerulus (right) for the TC shown in B. D, Representative voltage traces (top) and raster plot of spike times across multiple trials (bottom) after brief targeted photostimulation (blue line) of the on-beam (left) or rostrally neighboring off-beam (right) glomerulus for the TC shown in B. E–G, On-beam glomerular photostimulation evoked significantly greater peak excitatory currents (E; p = 0.020, one-tailed paired t test; n = 7), excitatory charge transfer (F; p = 0.025, one-tailed paired t test; n = 7), and spike rates (G; p = 0.012, one-tailed paired t test; n = 6) in TCs than off-beam glomerular photostimulation. Red lines and points correspond to the representative cell shown in B–D. H, Cumulative distributions of TC first-spike latencies after optical or extracellular stimulation of OSN axons within single glomerular microcircuits. Extracellular stimulation data from Burton and Urban (2014). IPL, Internal plexiform layer. *p < 0.05.
- Figure 7.
GCs receive convergent excitation and feedforward inhibition from multiple glomerular microcircuits. A, Experimental design. B, Bright-field image (top; scale bar, 100 μm) and morphological reconstruction (bottom) of a representative GC. C, Representative current traces after sequential uniglomerular (Ci–Civ) and multiglomerular (Ciii, light red) photostimulation (blue line) for the cell shown in B. Colors of traces correspond to the glomerular boundaries reconstructed in B. D, Peak excitatory and inhibitory synaptic currents measured within 500 ms of uniglomerular (uni) and multiglomerular (multi) photostimulation. Multiglomerular photostimulation significantly increased the peak excitatory (p = 7.3 × 10⁻³, one-tailed paired t test) and inhibitory (p = 4.2 × 10⁻⁴, one-tailed paired t test) currents measured across GCs (n = 16). Red lines and points correspond to the representative cell shown in B and C. E, The fold increase in peak inhibitory synaptic currents plotted against the fold increase in peak excitatory synaptic currents after multiglomerular versus uniglomerular photostimulation (n = 16). Black point shows mean ± SEM; red point corresponds to the representative cell shown in B and C. A strong but statistically insignificant trend existed toward a greater increase in inhibition than excitation (p = 0.058, two-tailed paired t test). No linear relationship existed between the fold increase in inhibition and excitation (p = 0.12, linear regression). F, G, Mean PSTHs of EPSC (left, black) and IPSC (right, blue) times after uniglomerular (F) and multiglomerular (G) photostimulation. Shading denotes mean ± SEM. Red line shows a single-exponential fit. H, Representative voltage traces (top) and raster plot of spike times across multiple trials (bottom) after uniglomerular (no shading) or multiglomerular (gray shading) photostimulation (blue line) for a representative GC (morphology not shown). I, J, Multiglomerular photostimulation evoked significantly more spikes per trial (I; p = 0.039, one-tailed paired t test) and tended to yield shorter first-spike latencies (J; p = 0.091, one-tailed paired t test) than uniglomerular photostimulation (n = 6). IPL, Internal plexiform layer. *p < 0.05; **p < 0.01; ***p < 0.001.
- Figure 8.
Feedforward inhibition and asynchronous excitation interact to reduce the temporal fidelity of GC firing. A, Biophysical multicompartmental GC model properties (see Materials and Methods; Li and Cleland, 2013). B, Ten to 30 excitatory events were delivered either synchronously or asynchronously with probabilistic latency drawn from the average PSTH of EPSC times after extracellular OSN stimulation. Inset, Zero to one inhibitory events were delivered to the distal apical dendritic and proximal somatodendritic domains with latency 6.9 ms after the onset of probabilistic (or artificially synchronous) excitation. C, Representative simulation with 20 artificially synchronous excitatory events (gex max = 110%) and feedforward inhibition (blue trace) or no inhibition (black trace). D, Representative simulation (top) and raster plot of spike times across multiple simulations (middle) with 20 physiologically asynchronous excitatory events (gex max = 110%) and feedforward inhibition (blue trace) or no inhibition (black trace) after simulated glomerular activation (bottom). E, Mean first-spike latency (averaged across 50 trials) for varying numbers and strengths of asynchronous excitatory inputs with feedforward inhibition (right) or without (left). F, Distribution of mean first-spike latencies for all permutations shown in E. G, H, Same as E and F for suprathreshold trial-to-trial spike-time reliability. I, Bath application of GBZ significantly reduced GC first-spike latencies evoked by extracellular OSN stimulation (p = 0.039, one-tailed paired t test; n = 5), matching simulation predictions (E, F). J, Change in mean suprathreshold trial-to-trial spike-time reliability versus change in mean first-spike latencies after bath application of GBZ. GCs exhibiting strong reductions in first-spike latencies likewise exhibited increased spike-time reliabilities, approximately matching simulation predictions (G, H). *p < 0.05.
- Figure 9.
Feedforward inhibition attenuates gemmule depolarization and Ca2+ influx triggered by coincident synaptic excitation. A, B, Experimental design. The influence of a single apical dendritic IPSP on the local gemmule depolarization and Ca2+ influx evoked by a single EPSP was monitored while varying the relative EPSP–IPSP timing. C, D, A single apical dendritic IPSP substantially reduced the maximum gemmule depolarization (C) and Ca2+ influx (D) evoked by a coincident or subsequent EPSP.
- Figure 10.
Feedforward inhibition onto GCs is a core feature of MOB circuitry that regulates GC-mediated inhibition of principal neurons. A, Canonical circuit diagram of GC synaptic inputs. Sensory input to the MOB activates MCs/TCs, which monosynaptically and asynchronously excite GCs and disynaptically and synchronously inhibit GCs via dSAC-mediated feedforward inhibition. B, The subcellular organization of excitation and feedforward inhibition can regulate local GC depolarization and consequent GABA release to control the balance between dendrodendritic recurrent and lateral inhibition of MCs/TCs. Activation of “glomerulus A” may drive excitation (MCA) and feedforward inhibition (dSACA) onto different GC dendritic branches (Bi), activating local GABA release while inactivating remote GABA release, yielding stronger recurrent inhibition of MCA than lateral inhibition of MCB and potentially disinhibiting MCB. Conversely, activation of glomerulus A may drive excitation and feedforward inhibition onto the same GC dendritic branch (Bii), inactivating local GABA release while activating remote GABA release to preferentially drive lateral inhibition. Feedforward inhibition onto any GC dendritic branch (Bi, Bii), and particularly onto proximal somatodendritic domains (Biii), can attenuate propagation of dendritic depolarization to the soma, supporting local dendritic spikes and independent, parallel processing between different GC dendritic branches.


Tables
GC dSAC Vthreshold (mV) −28.9 ± 7.8 (31) −46.0 ± 7.5 (9)* Amplitude (mV) 55.2 ± 12.0 (31) 72.7 ± 9.9 (9)* FWHM (ms) 1.00 ± 0.19 (31) 0.73 ± 0.17 (9)* Rising slope (mV/ms) 167.8 ± 64.3 (31) 272.3 ± 83.3 (9)* Falling slope (mV/ms) −60.3 ± 13.9 (31) −102.5 ± 29.5 (9)* ↵*p < 0.001 (two-tailed unpaired t test). Values reported are mean ± SD (n).
sEPSC sIPSC Frequency (Hz) 4.1 ± 4.3 (37) 1.5 ± 1.3 (37) Amplitude (pA) −17.0 ± 7.1 (37) 24.9 ± 10.5 (37) Rise10–90% (ms) 1.0 ± 0.3 (37) 1.5 ± 0.7 (37) τdecay (ms) 7.1 ± 3.7 (37) 19.7 ± 8.1 (37) Values reported are mean ± SD (n).


