

Abstract
Rett syndrome (RTT) is an autism spectrum disorder caused by loss-of-function mutations in the gene encoding MeCP2, an epigenetic modulator that binds the methyl CpG dinucleotide in target genes to regulate transcription. Previously, we and others reported a role of microglia in the pathophysiology of RTT. To understand the mechanism of microglia dysfunction in RTT, we identified a MeCP2 target gene, SLC38A1, which encodes a major glutamine transporter (SNAT1), and characterized its role in microglia. We found that MeCP2 acts as a microglia-specific transcriptional repressor of SNAT1. Because glutamine is mainly metabolized in the mitochondria, where it is used as an energy substrate and a precursor for glutamate production, we hypothesize that SNAT1 overexpression in MeCP2-deficient microglia would impair the glutamine homeostasis, resulting in mitochondrial dysfunction as well as microglial neurotoxicity because of glutamate overproduction. Supporting this hypothesis, we found that MeCP2 downregulation or SNAT1 overexpression in microglia resulted in (1) glutamine-dependent decrease in microglial viability, which was corroborated by reduced microglia counts in the brains of MECP2 knock-out mice; (2) proliferation of mitochondria and enhanced mitochondrial production of reactive oxygen species; (3) increased oxygen consumption but decreased ATP production (an energy-wasting state); and (4) overproduction of glutamate that caused NMDA receptor-dependent neurotoxicity. The abnormalities could be rectified by mitochondria-targeted expression of catalase and a mitochondria-targeted peptide antioxidant, Szeto-Schiller 31. Our results reveal a novel mechanism via which MeCP2 regulates bioenergetic pathways in microglia and suggest a therapeutic potential of mitochondria-targeted antioxidants for RTT.
Introduction
Epigenetic mechanisms play an important role in the brain's capability to adapt to environmental challenges (Borrelli et al., 2008). Microglia regulate neurodevelopment by actively surveilling and responding to brain microenvironments (Davalos et al., 2005; Nimmerjahn et al., 2005; Tremblay et al., 2010; Paolicelli et al., 2011; Schafer et al., 2012) and could be strongly influenced by epigenetic mechanisms. One novel mode of such epigenetic influence is bioenergetics (Wallace and Fan, 2010). However, few specific mechanisms linking epigenetics to bioenergetics have been demonstrated. Here we demonstrate such a pathway that plays a significant role in Rett syndrome (RTT) microglia. RTT is a neurodevelopmental disorder caused by loss-of-function mutations in the X-linked MECP2 gene. MECP2 encodes methyl-CpG-binding protein 2 (MeCP2), an epigenetic modulator that binds the methyl CpG dinucleotide in target genes to regulate transcription (Amir et al., 1999; Chahrour et al., 2008). RTT is the first established CNS disorder resulting from epigenetic dysregulation. RTT primarily affects young girls, who develop normally until 6–18 months of age when they start to regress, showing loss of neurodevelopmental milestones. Dendritic and synaptic abnormalities represent the neurobiological basis of RTT, although how MeCP2 deficiency causes neurological deficits remains poorly understood.
We and others previously showed a role of microglial abnormalities in RTT in mouse models (Maezawa and Jin, 2010; Derecki et al., 2012). Remarkably, MECP2 knock-out (Mecp2−/y) mice, which manifest human RTT-like symptoms and die at 9–10 weeks, became almost normal and lived to 1 year after their brains were populated with wild-type myeloid cells/microglia. They also showed significant phenotypic reversal after genetic re-expression of Mecp2 in myeloid cells (Derecki et al., 2012). Therefore, how MeCP2-deficient microglia (MDM) influence RTT pathology becomes a critical issue. MeCP2 is essential for microglial phagocytotic capability (Derecki et al., 2012) and is involved in fine-tuning of microglial responses to activation signals (Maezawa and Jin, 2010). Moreover, MDM constitutively produce glutamate at levels that could cause smoldering neurotoxicity manifested as pruning of synapses and dendrites (Hutchins and Barger, 1998; Maezawa and Jin, 2010), which could thus contribute to the synaptic/dendritic pathology of RTT. The overproduction is in part attributable to higher expression of mitochondrial phosphate-activated glutaminase (PAG; Maezawa and Jin, 2010). Over-release of glutamate was also observed in human mononuclear cells deficient in MeCP2 (O'Driscoll et al., 2013).
In our previous ChIP-seq (chromatin immunoprecipitation-sequencing) study, we identified a MeCP2 target gene, SLC38A1, which encodes a major glutamine transporter (GlnT) called SNAT1 (Yasui et al., 2013). This raised our interest because l-glutamine (L-Gln) is the precursor for glutamate and its transport across the plasma membrane is tightly regulated by GlnTs (Mackenzie and Erickson, 2004). L-Gln uptake by neuronal SNAT1 regulates the glutamine–glutamate/GABA cycle. However, the functional significance of SNAT1 in microglia has not been reported. Here we report that MeCP2 is a repressor of SNAT1 expression in microglia. Dysregulation of SNAT1 secondary to MeCP2 deficiency causes substantial disruption in microglial L-Gln homeostasis and mitochondrial function, as well as overproduction of glutamate, thus providing a fundamental epigenetic–bioenergetic mechanism for MDM abnormalities.
Materials and Methods
Mouse model of RTT.
All experimental protocols were performed with approval from the Institutional Animal Care and Use Committee of the University of California Davis. Mecp2tm1.1Bird/+ mice originated from Dr. Adrian Bird's laboratory (Guy et al., 2001) were obtained from The Jackson Laboratory. Mice were mated with C57BL/6J mice (The Jackson Laboratory). Mice were genotyped to determine the Mecp2 deletion according to the protocol provided by The Jackson Laboratory. The gender of the pups was determined using primers for the Sry gene on Y chromosome, which were 5′-TGGGACTGGTGACAATTGTC-3′ and 5′-GAGTACAGGTGTGCAGCTCT-3′. The CX3CR1-GFP mice (B6.129P-Cx3cr1tm1Litt/J) used to assess the purity of microglia isolated from the mouse brain were purchased from The Jackson Laboratory. The University of California Davis Institutional Animal Care and Use Committee approved all animal experiments.
Chemicals.
MK-801 was purchased from Calbiochem. Szeto-Schiller 31 (SS-31) peptide (d-Arg-2′6′-Dmt-Lys-Phe-NH2) was synthesized by American Peptide Company. MitoTracker and MitoSox were purchased from Invitrogen. p-Trifluoromethoxy carbonyl cyanide phenyl hydrazine (FCCP), rotenone, and 2-(methylamino)isobutyrate (MeAIB) were purchased from Sigma-Aldrich.
Acute isolation of microglia from mouse brain and flow cytometry.
Brains freshly removed from juvenile Mecp2+/y and Mecp2−/y mice were immediately dissociated to single-cell suspensions by using a Neural Tissue Dissection kit (Miltenyi Biotec). Microglia were isolated by CD11b MicroBeads (Miltenyi Biotec) according to the manufacturer's instructions. The whole procedure took ∼90 min. Acutely isolated microglia were over 94% pure based on flow cytometry assessments. Flow cytometry was performed using a CyAn-ADP flow cytometer (DakoCytomation). Data analysis was conducted using the SUMMIT software (DakoCytomation). The gating strategy to eliminate tissue debris and dead cells is presented in Figure 2A. Two methods were periodically used to confirm the purity of isolated microglia. First, the isolated microglia samples were labeled with FITC-labeled CD11b antibody, and the proportion of labeled microglia was determined. Second, microglia samples isolated from CX3CR1-GFP mice were analyzed for the proportion of GFP-labeled microglia (see Fig. 2B). Both methods consistently demonstrated 94–96% purity.
Cell cultures.
Primary microglia cultures were prepared from mixed glia cultures established from newborn mice with the “shaking-off” method as described previously (Suzumura et al., 1987). Microglia, after floating off and separating from mixed glia cultures on day 10 in vitro, were singly cultured and used within 48 h. In the present study, our preparations were ≥99% pure for microglia as demonstrated by anti-CD11b immunostaining. The hippocampal neuronal cultures were prepared from newborn wild-type C57BL/6J mice as described previously (Maezawa and Jin, 2010). Cells were cultured for 14 d in vitro. The astrocyte cultures were prepared from newborn mice as described previously and cultured for 14 d in vitro before being used for experiments (Maezawa et al., 2009). BV-2 cells were routinely cultured in DMEM with 5% fetal bovine serum (FBS). Cell viability was assayed by MTT (tetrazolium salt) as described previously (Maezawa et al., 2006).
Gene manipulation.
To knock down Mecp2, BV-2 cells were transfected with small interference RNAs (siRNAs) using a Lonza 4D Nucleofector (Lonza Walkersville) and a SF Cell Line 4D-Nucleofector X kit according to the manufacturer's instructions. Two sets of siRNA duplexes homologous to mouse Mecp2 sequence were designed using the HiPerformance Design Algorithm (Norvatis) and were purchased from Qiagen (catalog #SI02670668 and #SI02713172). As a transfection control, an All Stars Negative Control siRNA (Qiagen) was used. To express SNAT1 in BV-2 cells, cells were transfected with an SNAT1 expression plasmid (Varoqui et al., 2000) using a SF Cell Line 4D-Nucleofector X kit according to the manufacturer's instructions (Lonza Walkersville). The mitochondrially targeted catalase (mCAT) expression vector was a gift from Dr. Peter Rabinovitch at the University of Washington, Seattle (Schriner et al., 2005; Dai et al., 2011). After transfection, to be able to maintain viability of the cells from L-Gln toxicity, we routinely cultured the transfected cells in phenol red-free, 2 mm L-Gln-containing DMEM. This was prepared by supplementing L-Gln- and phenol red-free DMEM (catalog #A14430; Invitrogen) with glucose, sodium pyruvate, 2 mm L-Gln, and 2% FBS.
Glutamate assay.
The assay for glutamate production by primary microglia was performed as described previously (Maezawa and Jin, 2010). BV-2 cells were plated in 24-well plates at a density of 8 × 10⁴ cells/well and incubated for indicated numbers of hours. Conditioned media were collected, briefly centrifuged to remove cell debris, and analyzed by a Glutamate Colorimetric Assay kit purchased from BioVision. The result was normalized by total cellular protein.
ATP assay.
For the ATP assay, primary microglia or BV-2 cells were plated in six-well plates at a density of 1.0 × 10⁶ cells/well or 2.5 × 10⁵ cells/well, respectively, and cultured for 24 h. Cells were harvested using a Deproteinizing Sample Preparation kit (BioVision), and ATP was quantified using an ATP Colorimetric/Fluorometric Assay kit (BioVision) according to the manufacturer's instructions.
Oxygen consumption assay.
Transfected BV-2 cells were harvested by trypsinization and washed with PBS three times. Cells were resuspended in RPMI medium without L-Gln and with 10% FBS and plated onto a 96-well BD Oxygen Biosensor System plate (BD Biosciences) at a density of 1.6 × 10⁵ cells/well. The oxygen consumption was then quantified as we described previously (Rolo et al., 2009).
Fluorescent mitochondrial assays.
After culturing primary microglia or transfected BV-2 cells for the indicated time, cells were gently washed with PBS and incubated with MitoTracker Deep Red FM (Invitrogen) or MitoSox Red Mitochondrial Superoxide Indicator (Invitrogen) according to the manufacturer's instructions. After incubation, cells were gently scraped and resuspended in 0.1% BSA in PBS and analyzed by a Cyan-ADP Flow Cytometer (DakoCytomation).
Immunofluorescence staining and quantification.
Immunofluorescence staining and quantification were conducted as described previously (Maezawa and Jin, 2010). Briefly, neurons were fixed in 4% paraformaldehyde and stained with anti-PSD-95 (1:200; Cell Signaling) or anti-MAP2 (1:500; Millipore Bioscience Research Reagents) overnight at 4°C, followed by secondary Alexa Fluor 488-conjugated anti-mouse antibody or Alexa Fluor 568-conjugated anti-rabbit antibody (1:700; Invitrogen). Photomicrographs of MAP2-immunostained cultures were randomly taken from each culture condition. The images were transformed to 8 bit grayscale and analyzed by the ImageJ program. The photography and analysis of immunoreactivity were conducted in an investigator-blinded manner.
The localization of SNAT1 in each cellular element of the brain was conducted using a CSU-10 spinning disk confocal unit (Yokagawa) attached to an iX71 inverted optical microscope (Olympus). Images were collected through a 60×, 1.42 NA oil-immersion objective and recorded by an iXon 897 EM-CCD camera (Andor Technologies). Laser excitation was provided by an Innova 70C argon–kryton ion gas laser (Coherent) operating on all laser lines simultaneously. Images of single confocal optical slices were obtained using identical gain and used for in situ analysis of SNAT1. To quantify the intensity of SNAT1 immunoreactivity in individual cells, areas with costaining of the cell marker and SNAT1 were manually outlined and converted to grayscale images, and the integrated density (IntDen) values were obtained by ImageJ. IntDen provided a measure of intensity proportional to total volume and was calculated using area x immunoreactivity. Values from eight random images of hippocampal CA1–CA3 regions were taken for each mouse and averaged for comparison.
Western blot analysis.
Sample preparation and Western blotting were conducted as we described previously (Maezawa and Jin, 2010). The following primary antibodies (dilutions) were used: anti-MeCP2 (1:1000; Millipore), anti-NDUFA7 (1:1000; Abcam), anti-mitofilin (1:1000; Affinity Bioreagents), anti-GAPDH (1:3000; Millipore), and anti-β-actin (1:1000; Abcam). The well characterized, highly specific polyclonal anti-SNAT1 was described previously (Varoqui et al., 2000; Grewal et al., 2009) and was used in 1:1000 dilution.
Quantitative PCR.
RNA from primary microglia or transfected BV-2 cells was extracted by using a RNeasy Plus Mini kit (Qiagen), and cDNA was synthesized from 2 μg of total RNA using iScript Reverse Transcription Supermix (Bio-Rad). Quantitative PCR (qPCR) was performed using the SsoFast EvaGreen Supermix (Bio-Rad) in the CFX96 Touch Real-Time PCR Detection System (Bio-Rad). The result was normalized to β-actin. For Mecp2, the forward primer sequence was 5′-GACCCCTTGGGACTGAAGTT-3′ and the reverse primer sequence was 5′-CCACCCTCCAGTTTGGTT TA-3′. For SNAT1, the forward primer sequence was 5′-AGAGGACTAAGGTCTGTGG-3′ and the reverse primer sequence was 5′-CTTAGAGTGGTACCCAAGC-3′. For SNAT2, the forward primer sequence was 5′-GACACAGTAAGTGAGTGACG-3′ and the reverse primer sequence was 5′-CTCTCTTTGGATACCTGACC-3′. For β-actin, we used the commercially available primer set Mouse ACTB (Actin, Beta) Endogenous Control FAM Dye/MGB Probe, Non-Primer Limited (Invitrogen). The following forward/reverse primer pairs were used to quantify the M1/M2 activation status of microglia: CD86, 5′-CAAGAAGCCGAATCAGCCTA-3′/5′-TGGGGTTCAAGTTCCTTCAG-3′; MHCII (H2-T23), 5′-CTGTGGTGGCTTTTGTGATG-3′/5′-GCCAGTCAGAGGTCTGGAAG-3′; TNF-α, 5′-GACGTGGAACTGGCAGAAGAG-3′/5′-TGCCACAAGCAGGAATGAGA-3′; CD206 (Mrc1), 5′-TCATCCCTGTCTCTGTTCAGC-3′/5′-ATGGCACTTAGAGCGTCCAC-3′; Arg1, 5′-CCAACTCTTGGGAAGACAGC-3′/5′-TATGGTTACCCTCCCGTTGA-3′; Ym2 (Chil3), 5′-AGGAAGCCCTCCTAAGGACA-3′/5′-TGAGTAGCAGCCTTGGAATG-3′; and IGF-I, 5′-TGGATGCTCTTCAGTTCGTG-3′/5′-CACAATGCCTGTCTGAGGTG-3′ (Lee et al., 2013; Moreno et al., 2014; Tang et al., 2014).
Electron microscopy.
For electron microscopy (EM) embedding, the cell medium was decanted, and Karnovsky's fixative (2% paraformaldehyde plus 2.5% glutaraldehyde in 0.1 m phosphate buffer, pH 7.2–7.4) was added to a depth of about 5 mm. Cells were fixed for 1–2 h at room temperature and then overnight at 4–10°C. Cells were then osmicated, rinsed with phosphate buffer, dehydrated, and embedded in Epoxy resin, which was allowed to polymerize for 24 h at 70°C.
Blocks containing microglia cells were sectioned using an ultramicrotome (Ultracut; Leica) at 70–80 nm. Thin sections were collected on grids and stained with uranyl acetate and lead citrate. Grids were examined under a CM120 electron microscope (Philips) at 80 kV. EM images were acquired by a 2 × 2 k CCD camera using DigitalMicrograph software (Gatan). EM digital micrographs were processed using DigitalMicrograph, and the figures were composed in Adobe Photoshop (Adobe Systems).
Statistical analysis.
Statistical analyses were performed using SigmaPlot 11 software (Systat Software). ANOVA or repeated-measures ANOVA was used to compare quantitative values from cultures across groups. Tukey's studentized range test was used to adjust for multiple comparisons in post hoc pairwise tests.
Results
MeCP2 deficiency in microglia causes overexpression of glutamine transporter SNAT1
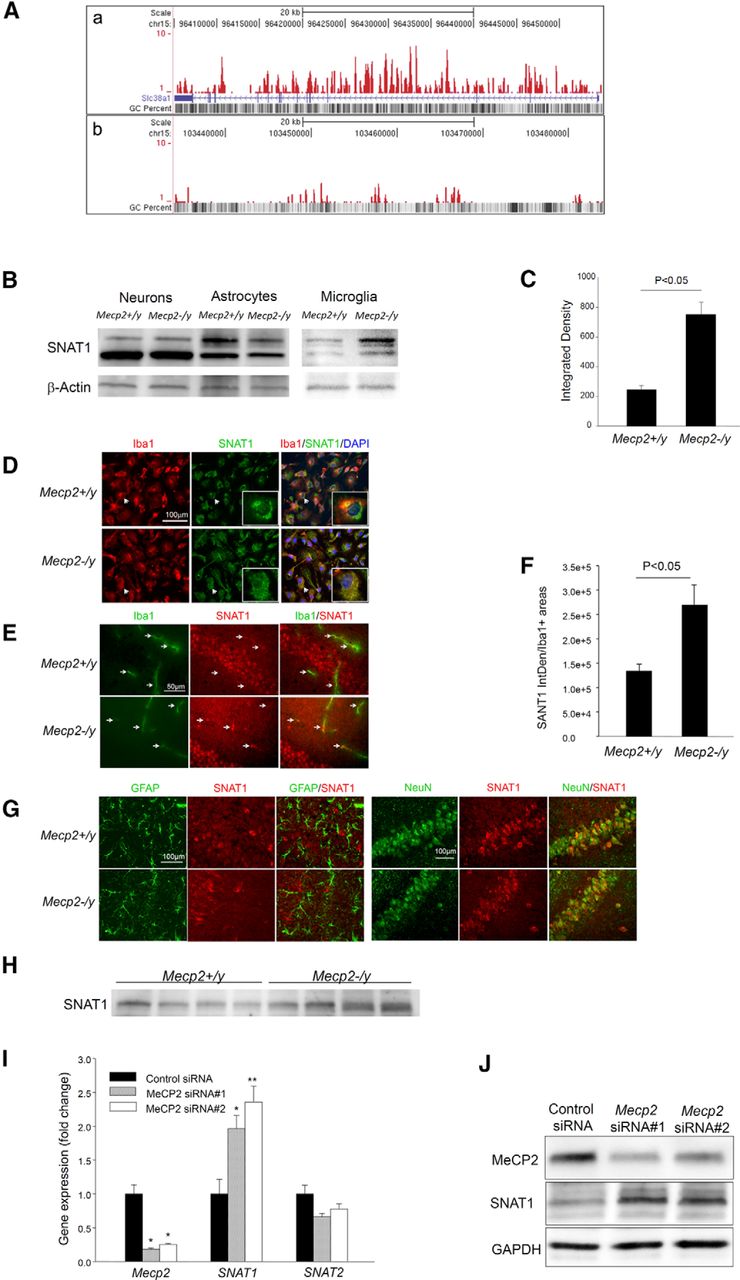
Our previous ChIP-seq study revealed that MeCP2 binds to the SLC38A1 (SNAT1) gene body (Fig. 1A), which is the predominant site of DNA methylation in immune cells (Deaton et al., 2011; Yasui et al., 2013). To evaluate whether this MeCP2 binding affects gene expression, we compared the SNAT1 transcript levels of primary microglia cultured from MeCP2-deficient (Mecp2−/y) mice and their wild-type (Mecp2+/y) littermates. qPCR showed that the SNAT1 transcript level in Mecp2−/y microglia was 148 ± 0.07% (n = 5, p < 0.001) of that in Mecp2+/y microglia. Western blot of primary microglia samples showed a cluster of SNAT1-immunoreactive bands centered ∼55 kDa, consistent with published data (Varoqui et al., 2000; Grewal et al., 2009). SNAT1 protein levels were approximately three times more abundant in Mecp2−/y than in Mecp2+/y microglia (Fig. 1B,C). This increase was also clearly demonstrated by immunocytochemistry. Figure 1D shows that SNAT1 immunoreactivities in primary Mecp2+/y microglia tend to cluster around nuclei, whereas those in Mecp2−/y microglia tend to distribute broadly throughout membrane or cytoplasm, approximating the pattern of Iba-1, a microglia/macrophage-specific calcium-binding protein.

MeCP2 is a transcriptional repressor of SNAT1 in microglia. A, ChIP-seq analysis revealed enrichment of MeCP2 binding sites within the gene body of SLC38A1, coding for the glutamine transporter SNAT1. a, The locations of uniquely mapped reads are shown as a series of peaks in the custom University of California Santa Cruz genome browser track. b, As a control, an intergenic region telomeric to SLC38A1 reveals very low levels of MeCP2 binding. B, Representative Western blots of lysates of primary neurons [14 d in vitro (DIV)], astrocytes (14 DIV), and microglia (11–12 DIV) cultured from neonatal mice of the indicated genotype. SNAT1 migrated as triplet bands ∼50 kDa. The band intensity of microglial SNAT1 was rather weak compared with that of neurons or astrocytes, and therefore the blots for microglial SNAT1 were developed longer. C, The bar graph shows mean ± SEM of microglial SNAT1 band intensities, normalized by those of β-actin, from six independent experiments. D, Cultured primary microglia of the indicated genotype were immunofluorescently costained for Iba-1 (red) and SNAT1 (green) and counterstained with DAPI (blue). Representative photomicrographs are shown. The insets show magnified images of the same cells indicated by the arrows. E, Sections of hippocampus of 8-week-old mice were immunofluorescently costained for Iba-1 (red) and SNAT1 (green) and imaged under a confocal microscope. Arrows point to representative Iba-1-positive microglia. F, The bar graph shows mean ± SEM of IntDen values of microglial SNAT1 immunoreactivity in sections, which were quantified in Iba-1-positive areas as described in Materials and Methods. Five 8-week-old mice per group were studied. G, Sections consecutive to those used in E were coimmunostained for GFAP (green)/SNAT1 (red) or NeuN (green)/SNAT1 (red). H, Western blot analysis of SNAT1 in brain homogenates from four Mecp2+/y and four Mecp2−/y (8-week-old) mice. I, Mecp2 knockdown in BV-2 microglial cells by two siRNAs increased the level of SNAT1, but not SNAT2, transcript, which is shown by qPCR (n = 6). J, Western blot analysis of the indicated proteins in BV-2 cells with Mecp2 knockdown by the two siRNAs.
Because the above comparisons were made using primary cultures generated from neonatal mice, we next examined whether the same conclusion could be made from juvenile Mecp2−/y mice, which show RTT-like symptoms. For this purpose, we acutely isolated microglia from brains of Mecp2−/y mice and their Mecp2+/y littermates using CD11b microbeads. The purity of the isolated microglia, determined by flow cytometry, was consistently between 94 and 96% (Fig. 2). Quantitative PCR revealed a consistent upregulation of SNAT1 transcript in Mecp2−/y microglia compared with Mecp2+/y microglia in both 5-week-old (177 ± 21%, n = 3, p < 0.01) and 8-week-old (163 ± 11%, n = 4, p < 0.005) age-matched pairs. Because SNAT1 overexpression was also seen at the age of 5 weeks when the Mecp2−/y mice usually show few RTT-like symptoms, it is not likely secondary to brain pathology. When the microglial SNAT1 was examined in situ by double immunofluorescence with confocal microscopy, microglia in Mecp2−/y mouse brains showed significantly increased SNAT1 immunoreactivities compared with those in Mecp2+/y brains (Fig. 1E,F). Remarkably, on a background of strong SNAT1 staining in neuronal soma and neuropil, many Mecp2−/y microglia showed bright SNAT1 staining in segments of microglia soma or processes, which was not observed in Mecp2+/y brains (Fig. 1E, arrows in the bottom middle image).

Gating strategy and purity of acutely isolated microglia. Microglia were isolated from juvenile mice as described in Materials and Methods and immediately subjected to flow cytometric analysis. A, A representative bivariate plot along the side (SS Lin) and forward (FS Lin) scatters of an acutely isolated microglia sample using CD11b magnetic beads. To exclude tissue debris and dead cells, the live-cell population was gated by R1, which was used for all subsequent analyses. B, To illustrate the purity of the isolated population, microglia isolated from 8-week-old CX3CR1-GFP mice, of which microglia were selectively marked by expression of enhanced green fluorescent protein, were subjected to flow cytometric analysis. More than 95% of R1-gated cells were positive for CX3CR1-GFP (gate R4, red histogram). The blue histogram represents a microglia sample isolated from a wild-type mouse, which served as a negative control. Please see Materials and Methods for a description of the second approach to assess the purity of acutely isolated microglia.
SNAT1 is also expressed in neurons and astrocytes. Interestingly, qPCR and Western blot (Fig. 1B) did not show upregulation of SNAT1 in primary cultures of Mecp2−/y neurons or astrocytes. Similarly, neurons and astrocytes in brain sections, highlighted by NeuN and GFAP, respectively, did not show any significant differences in SNAT1 distribution and staining intensity between Mecp2+/y and Mecp2−/y brains (Fig. 1G). Together, the results suggest a cell type-selective effect of MeCP2 and that the absence of MeCP2 may only cause increased GlnT activity in microglia. This result is also consistent with the facts that SNAT1 was not identified in prior expression profiling studies examining mixtures of neural cells or brain samples. Similarly, we did not detect significant overall increases in SNAT1 transcript or protein levels in the whole-brain preparations of Mecp2−/y mice (Fig. 1H).
System A transporter activities have been well characterized in BV-2 microglia cells (Schilling and Eder, 2004; Van den Eynden et al., 2011). To establish a causal link between MeCP2 and SNAT1 expression, we transfected BV-2 cells with two siRNAs targeting MeCP2. Both siRNAs effectively knocked down the expression of MeCP2 to ∼20% of control levels and also consistently increased SNAT1 expression (Fig. 1I). Western blotting confirmed that MeCP2 knockdown increased SNAT1 protein levels (Fig. 1J; n = 3, p < 0.05).
SNAT1 and SNAT2 are two of the three SLC38 gene family members that collectively account for the system A amino acid transport activity classically described in most cell types (Mackenzie and Erickson, 2004). Consistent with the lack of MeCP2 binding to the SNAT2 gene, SNAT2 expression was not affected by MeCP2 deficiency in both primary microglia and BV-2 cells (Fig. 1I). Together, the above data show that MeCP2 binds to the gene body of SNAT1 in microglia and acts as a transcriptional repressor.
SNAT1 overexpression causes L-Gln-induced cytotoxicity
We noticed that when Mecp2−/y microglia (Fig. 3A) or BV-2 cells with Mecp2 knockdown (BV-2/Mecp2-KD; Fig. 3B) were grown in medium containing 8 mm L-Gln (as contrasting to the 4 mm L-Gln in regular culture medium), they showed reduced viability. This toxicity was blocked by MeAIB, a paradigm analog inhibitor of system A transporters (Mackenzie and Erickson, 2004), suggesting that the toxicity was mediated by excessive L-Gln uptake. To test whether this is the consequence of SNAT1 overexpression, we transfected BV-2 cells with a SNAT1 expression plasmid vector (Varoqui et al., 2000). We confirmed that SNAT1 overexpression did not affect the expression of MeCP2 or SNAT2 (data not shown). When cultured in regular medium containing 4 mm L-Gln, cells with SNAT1 transcript over twofold the control level exhibited substantial toxicity over a period of 4–8 h. To be able to simulate the condition of SNAT1 expression under MeCP2 knockdown, we therefore titrated down the concentrations of the SNAT1 expression plasmid and identified a narrow window of ∼100–200 ng input plasmid that caused mild toxicity with approximately twofold increases in SNAT1 expression. Figure 3C shows that cells with SNAT1 overexpression (BV-2/SNAT1) demonstrated a L-Gln concentration-dependent decrease in viability, which was completely blocked by MeAIB. These results suggest that MeCP2 deficiency affects microglial viability through increased uptake of L-Gln by overexpressed SNAT1.

SNAT1 overexpression causes L-Gln-induced cytotoxicity in MeCP2-deficient microglia. A, Primary microglia cultured from neonatal mice of the indicated genotype were cultured in medium containing 8 mm L-Gln, with or without MeAIB (5 μm), for 24 h, and cell viability was assayed by MTT. n = 3; *p < 0.05. B, BV-2 cells transfected with control siRNA (BV-2/Cont) or with Mecp2 siRNA (BV-2/Mecp2-KD) were cultured in medium containing indicated concentrations of L-Gln for 24 h. A group of BV-2/Mecp2-KD cells was also treated with MeAIB (5 μm). Cell viability was determined by MTT assay. n = 3; **p < 0.001. C, BV-2 cells transfected with control plasmid (BV-2/Cont) or with SNAT1 expression plasmid (BV-2/SNAT1) were cultured in medium containing indicated concentrations of L-Gln for 24 h. A group of BV-2/SNAT1 cells was also treated with MeAIB (5 μm). Cell viability was determined by MTT assay. n = 3; *p < 0.05 and **p < 0.001. D, Brain sections were immunofluorescently stained for Iba-1 (green) and counterstained with DAPI (blue). The bar graph shows mean ± SEM of the ratio of Iba-1-positive microglia count/total cell (DAPI-positive nuclei) count. Five 9-week-old mice were studied in each group.
To determine the in vivo significance of the above finding, we quantified the number of microglia and compared between 9-week-old Mecp2+/y and Mecp2−/y brains. Using Iba-1 to label microglia, we found Mecp2−/y brains had significantly less microglia (Fig. 3D). In addition, microglia in Mecp2−/y brains tend to have less apparent Iba-1-positive processes. This is not likely attributable to decreased Iba-1 expression in Mecp2−/y brains because qPCR analysis of acutely isolated microglia did not reveal a difference in Iba-1 expression between groups. Our results suggest that SNAT1-related microglial toxicity could contribute to decreased microglial number in the Mecp2−/y brain.
SNAT1 mediates the effect of MeCP2 deficiency on microglial glutamate production
A previously established functional impairment that could cause synaptic dysfunction in RTT is overproduction of the excitatory neurotransmitter glutamate by MDM (Maezawa and Jin, 2010; O'Driscoll et al., 2013). This overproduction could be reduced by restriction of L-Gln in the medium (Maezawa and Jin, 2010). Given that L-Gln taken up by cells is quickly accumulated in mitochondria and hydrolyzed by mitochondrial glutaminase to glutamate (Matés et al., 2009), the upregulation of SNAT1 in MDM may contribute to overproduction of glutamate. Indeed, treatment of primary Mecp2−/y microglia with MeAIB to block SNAT1 activity reduced the glutamate production to the wild-type level (Fig. 4A). Furthermore, BV-2/Mecp2-KD and BV-2/SNAT1 cells also showed increased glutamate production (see Fig. 8B,C), confirming that MeCP2 deficiency/SNAT1 overexpression induces glutamate overproduction.

SNAT1 mediates the effect of MeCP2 deficiency on microglia glutamate production. A, Primary Mecp2−/y microglia released a high level of glutamate compared with Mecp2+/y microglia, consistent with a previous result (Maezawa and Jin, 2010). Glutamate levels were quantified in 24 h CM. The overproduction of glutamate was inhibited by treating Mecp2−/y microglia with MeAIB (5 μm). n = 4–7. B, Primary wild-type hippocampal neurons, 14 d in vitro, were incubated with the 4 h CM obtained from BV-2/SNAT1 cells at a concentration of 5% (5% CM + 95% regular neuron culture medium). A group of BV-2/SNAT1 CM-treated neurons was also treated with MK-801 (10 μm). At 24 h, neurons were immunostained for MAP2 (red) and PSD-95 (green). Representative photomicrographs are shown. The immunoreactivities were quantified for each treatment and presented as percentage of control (the group in which neurons were treated with CM from BV-2/Cont cells). n = 3. C, Same as described in B, except that neurons were incubated with the 8 h CM (5%) obtained from BV-2/Mecp2-KD cells. n = 3.
We next tested whether conditioned medium (CM) from BV-2/Mecp2-KD or BV-2/SNAT1 cells has neurotoxic effects. We transferred the CM to hippocampal neurons that had been cultured for 14 d in vitro. Within 24 h, neurons treated with CM from BV-2/Mecp2-KD and BV-2/SNAT1 cells, but not those treated with CM from control transfected cells, showed robust signs of dendritic damage. The immunofluorescent stain for the dendritic marker MAP2 showed a dramatic reduction in staining intensity and the length of dendrites stained (Fig. 4B,C). The damage to the postsynaptic structures was shown by immunofluorescent stain for PSD-95, a postsynaptic density scaffold protein (Fig. 4B,C). Moreover, the neurotoxic activity of these two kinds of CM could be blocked by the NMDA receptor antagonist MK-801 applied to neurons (Fig. 4B,C). These results recapitulate our prior results demonstrating neurotoxicity of CM from primary Mecp2−/y microglia (Maezawa and Jin, 2010) and support that SNAT1 overexpression mediates the neurotoxicity of MDM by causing glutamate overproduction.
SNAT1 overexpression mediates the effect of MeCP2 deficiency on mitochondrial integrity
L-Gln plays a key role in nitrogen metabolism and represents the storage and transport form of glutamate and ammonia. At elevated levels, intracellular L-Gln could damage mitochondria via its metabolism in mitochondria to ammonia and glutamate, causing cell toxicity or functional aberrations (Albrecht and Norenberg, 2006). Given that MeCP2 downregulation and consequent SNAT1 overexpression are associated with decreased microglial viability and glutamate overproduction, we hypothesize that overexpression of SNAT1 in MDM would affect mitochondrial function because of increased L-Gln uptake. Indeed, when we examined the electron micrographs of microglia isolated from Mecp2−/y brains, the most significant findings were increased mitochondrial numbers, to a striking degree in some individual microglia (Fig. 5A, top right). Higher-magnification EM images of Mecp2−/y microglia showed widespread abnormal “dissolving” features of mitochondria among those with normal morphology (Fig. 5A, bottom right, arrows). Using MitoTracker, a dye for marking mitochondria in living cells, and flow cytometry, we confirmed that microglia isolated from Mecp2−/y mice had significantly higher numbers of mitochondria compared with those from Mecp2+/y mice (Fig. 5B). This conclusion was also made with primary microglia cultures, as shown by microscopic visualization of MitoTracker staining (Fig. 5C) and flow cytometry quantification (Fig. 5D). This result was also supported by increased levels of two intrinsic mitochondria proteins, mitofilin and NDUFA7 (Fig. 5E). Moreover, the mitochondrial proliferation appears to be a direct consequence of MeCP2 downregulation and SNAT1 overexpression. At 24 h after transfection, BV-2/MeCP2-KD cells showed a 2.15 ± 0.18-fold increase (n = 3, p < 0.05) and BV-2/SNAT1 cells showed a 2.94 ± 0.23-fold increase (n = 3, p < 0.05) in MitoTracker labeling compared with their respective control BV-2 cells.

Abnormal mitochondria in acutely isolated Mecp2−/y microglia. A, Shown are representative electron micrographs of microglia. The left column shows normal ultrastructural features of wild-type Mecp2+/y microglia, and the right column shows abnormal morphological features of Mecp2−/y microglia. White arrows point to mitochondria with “dissolving” features in Mecp2−/y microglia. B, Flow cytometry of microglia acutely isolated from 8-week-old mice labeled with MitoTracker. Shown are representative traces and a bar graph summarizing data of mean fluorescence intensity obtained from four Mecp2+/y and four Mecp2−/y mice. C, D, Primary microglia labeled with MitoTracker. Representative immunofluorescence images are shown in C, and the flow cytometry result is shown in D. n = 3. E, Western blot analysis of mitochondria-specific proteins in primary microglia of the indicated genotype.
Cellular oxygen consumption is a specific and informative indicator of mitochondrial function (Rolo et al., 2009; Brand and Nicholls, 2011). The large numbers of cells afforded by the BV-2 culture allowed us to assay their oxygen consumption using a biosensor plate method (Rolo et al., 2009). As a positive control, the mitochondria protonophoric uncoupling agent FCCP (5 μm) was used to induce a maximal rate of oxygen consumption in BV-2 cells (Fig. 6A; Rolo et al., 2009). The oxygen consumption was increased in BV-2/Mecp2-KD and BV-2/SNAT1 cells compared with BV-2/cont cells in both basal (4 mm L-Gln) and FCCP-stimulated (Fig. 6A–D) conditions, consistent with their increased numbers of mitochondria. This effect was blocked by MeAIB, indicating that the observed differences were primarily driven by enhanced L-Gln uptake (Fig. 6C,D). It was also completely blocked by rotenone (10 μm; Fig. 6A,C,D), a mitochondrial complex I inhibitor (Giordano et al., 2012), suggesting that the L-Gln stimulatory effect was not caused by some extra-mitochondrial action. Together, these results indicate that L-Gln increases mitochondrial number or mass in MDM because of SNAT1 overexpression.

Abnormal mitochondria function in MDM. A, B, Representative traces of oxygen consumption by BV-2 cells under indicated conditions. FCCP or rotenone was added immediately before the measurements were started. RFU, Relative fluorescence unit. C, D, Fluorescence intensities of each condition at 45 min were subtracted by the intensity values of respective “null controls” (same types of cells treated with rotenone) and plotted. Oxygen consumption in BV-2 cells was driven by the presence of 4 mm L-Gln and enhanced by Mecp2 knockdown (Mecp2-KD; C) or SNAT1 overexpression (D). Enhancement by both could be blocked by MeAIB. n = 3; *p < 0.05. E–G, ATP production was reduced in primary Mecp2−/y microglia (E; n = 6), in BV-2/Mecp2-KD cells (F; n = 7), and in BV-2/SNAT1 cells (G; n = 6). ATP production was recovered by treating the cells with SS31 or transfecting the cells with the mCAT plasmid (F, G).
However, despite increased mitochondrial numbers, ATP production was significantly lower in Mecp2−/y microglia (Fig. 6E). Similar results were obtained in BV-2/Mecp2-KD and BV-2/SNAT1 cells (Fig. 6F,G). Thus, MeCP2 deficiency in microglia appears to uncouple mitochondrial respiration and ATP production, which may be driven by increased L-Gln uptake via overexpressed SNAT1.
Metabolic reprogramming and overproduction of glutamate in microglia are generally associated with an activation state. However, we previously reported that Mecp2−/y microglia showed minimal conventional morphological or biochemical signs of microglial activation (Maezawa and Jin, 2010). To further investigate whether MeCP2 deficiency or SNAT1 overexpression affects the activation status of microglia, we quantified several established markers for the “classical activation” (M1) and “alternative activation” (M2) states by qPCR (Colton, 2009). As shown in Figure 7, the expression levels of all markers used for characterization of the M1–M2 spectrum were rather low and showed no differences between ex vivo microglia acutely isolated from 8-week-old Mecp2+/y and Mecp2−/y mice. This result also supports the notion that MDM affects brain function not through assuming any conventionally defined activation state.

Characterization of the M1–M2 spectrum of Mecp2−/y microglia. qPCR of the listed M1 markers CD86, MHCII, IL-1beta (IL-1b), and TNF-α (TNFa) and M2 markers Arg-1, Ym-1, and IGF-I were performed on RNA samples of microglia acutely isolated from 8-week-old Mecp2+/y (n = 6) and Mecp2−/y (n = 7) mice. Two groups of RNA samples were used as positive controls: pMG-LPS, primary wild-type microglia treated with 100 ng/ml lipopolysaccharides for 24 h (n = 4), and LPS-ICV, microglia acutely isolated from 8-week-old wild-type mice at 24 h after bilateral intracerebroventricular injection of lipopolysaccharides (4 μg per side, n = 4). The expressions of the markers in both experimental groups were generally low, showing no polarization to either M1 or M2, and no differences between groups. In contrast, the two positive control groups showed some marker stratified polarization. N.S., No statistical significance; N.D., not done.
Increased mitochondrial reactive oxygen species contributes to microglial mitochondrial dysfunction in MeCP2 deficiency
Given that MDM showed increased mitochondrial numbers and oxygen consumption, high mitochondrial reactive oxygen species (mtROS), which is known to trigger proton leaks across the mitochondrial inner membrane, could cause mitochondrial uncoupling and reduced ATP production. Furthermore, mtROS could be a major source of oxidative stress causing extra-mitochondrial cellular dysfunction in RTT microglia. We tested this possibility by using MitoSOX, a fluorophore activated by superoxide oxidation in mitochondria, and found an increased mitochondrial superoxide level in Mecp2−/y microglia compared with Mecp2+/y microglia (Fig. 8A).

Increased mtROS in MDM. A, Flow cytometry of primary microglia cultured from neonatal Mecp2+/y and Mecp2−/y mice and labeled with MitoSox. Shown are representative traces and a bar graph summarizing data from three experiments. B, BV-2/Cont or BV-2/SNAT1 cells were cultured in medium with the L-Gln level reduced to 2 mm. Glutamate levels were quantified in the 4 h CM. n = 3–7. Glutamate production was increased in BV-2/SNAT1 cells, which was reduced to the normal level by treating the cells with SS-31 or cotransfecting the cells with the mCAT plasmid. C, BV-2/Cont or BV-2/Mecp2-KD cells were cultured in medium with the L-Gln level reduced to 2 mm. Glutamate levels were quantified in 8 h CM. n = 3–6. Glutamate production was increased in BV-2/Mecp2-KD cells, which was reduced by treating the cells with SS-31, but not by cotransfecting the cells with the mCAT plasmid.
To test whether enhanced mtROS production as a result of SNAT1 overexpression leads to mitochondrial dysfunction in microglia, we used two mitochondria-targeted approaches using the following: (1) SS-31, a cell-permeable, mitochondria-targeted peptide antioxidant (Zhao et al., 2004) able to concentrate 1000- to 5000-fold in inner mitochondrial membrane and help scavenge hydroxyl radicals and peroxynitrite and possibly HOCl and peroxyl radicals (Gruber et al., 2013); and (2) mCAT, a plasmid that has been shown to direct the expression of catalase only in the mitochondria (Schriner et al., 2005; Dai et al., 2011). In BV-2/Mecp2-KD and BV-2/SNAT1 cells, both approaches normalized the production of ATP (Fig. 6F,G) and reduced microglial glutamate production (Fig. 8B,C). One intriguing exception was that glutamate production was not reduced in BV-2/Mecp2-KD cells expressing mCAT, although it was reduced in BV-2/SNAT1 cells expressing mCAT (Fig. 8B). As expected, neither SS-31 nor mCAT reduced MitoSox levels (data not shown) because SS-31 is unlikely to react directly with superoxide (Gruber et al., 2013) and mCAT acts on hydrogen peroxide, downstream of superoxide. Together, these results support that mtROS makes major contributions to mitochondrial dysfunction in RTT microglia.
Discussion
Mitochondrial dysfunction is likely an important pathological mechanism for RTT. In fact, before the identification of the causative RTT genes, mitochondrial abnormalities were suspected as the cause of RTT (Philippart, 1986). Patients with RTT showed abnormal mitochondrial morphology (Ruch et al., 1989; Wakai et al., 1990; Dotti et al., 1993; Cornford et al., 1994), enzymatic defects of the mitochondrial respiratory chain (Eeg-Olofsson et al., 1989; Coker and Melnyk, 1991; Heilstedt et al., 2002), and increased oxidative stress (Sierra et al., 2001; De Felice et al., 2009). Recent RNA expression studies revealed gene alterations in RTT human and mouse samples (upregulation of ubiquinol-cytochrome c reductase core protein 1 and downregulation of cytochrome c oxidase subunit 1) that may lead to mitochondrial respiratory chain defects (Kriaucionis et al., 2006; Gibson et al., 2010). Mice with MECP2 knock-out also show mitochondrial dysfunction in the skeletal muscle (Gold et al., 2014) and abnormal mitochondrial ultrastructure in the dendrite (Belichenko et al., 2009). However, a MeCP2 deficiency-initiated molecular pathway to account for microglial abnormalities in RTT has not been reported, despite the significant role of microglia in RTT (Maezawa and Jin, 2010; Derecki et al., 2012, 2013; Schwartz et al., 2013). Starting from our recent ChIP-seq data (Yasui et al., 2013), we identified a novel mechanism, illustrated in Figure 9, that coherently links dysregulation of a direct target of MeCP2, SNAT1, to mitochondrial abnormalities. From both cultured Mecp2−/y microglia and/or those acutely isolated from juvenile mice, we consistently found abnormal SNAT1 expression, and aberrant mitochondrial number, morphology, oxygen consumption, ATP production, glutamate production, and level of ROS.

Proposed mechanism of SNAT1-mediated mitochondrial dysfunction and glutamate overproduction. Glu, l-Glutamate; GJhc, gap junction hemichannels. MeCP2 is a transcriptional repressor of the SNAT1 gene. MeCP2 deficiency directly upregulates SNAT1 and also indirectly upregulates PAG and the connexin 32 component of GJhc as reported previously (Maezawa and Jin, 2010), causing increased intracellular L-Gln concentration, mitochondria ROS generation, and enhanced glutamate production and release. ROS induces uncoupling and aggravates glutamate overproduction, which can be blocked by mCAT and SS-31.
Based on gene modification experiments conducted using BV-2 cells, the above multitude of mitochondrial abnormalities are a direct consequence of MeCP2 deficiency-induced SNAT1 overexpression. First, it may affect microglial viability. Corroborating the apparent in vitro vulnerability of MDM to minor changes in [L-Gln], secondary to SNAT1 upregulation, the number of Iba-1-labeled microglia was reduced, and the morphology of Iba-1-labeled microglial processes appeared subdued in the Mecp2−/y brain. Potentially aggravating this vulnerability, NMR microscopy studies revealed elevated cerebral L-Gln levels in Mecp21lox mice (Ward et al., 2009) and glutamine/Cr ratios in RTT girls (Horská et al., 2009). This elevation could be attributable to increased protein levels of glutamine synthetase, an exclusively astrocytic enzyme, in Mecp2−/y astrocytes (Okabe et al., 2012). We also previously showed increased transcript and protein levels of PAG, a major mitochondrial enzyme responsible for synthesis of glutamate from L-Gln, in Mecp2−/y microglia (Maezawa and Jin, 2010). Thus, it appears that MeCP2 epigenetically controls coordinated expression of a series of genes involved in metabolism of L-Gln in neuroglia. Wallace and Fan (2010) proposed an epigenomic–bioenergetic hypothesis that states that certain alterations in the epigenome change the coordinated expression of bioenergetic genes, contributing to several pathologies including RTT. To our knowledge, our study is the first to provide evidence for a MeCP2-regulated bioenergetic pathway to support this hypothesis in RTT.
A prediction of this hypothesis is diminishing bioenergetics from dysregulation of bioenergetics genes. Indeed, MeCP2 deficiency/SNAT1 overexpression presents a pattern consistent with an energy-wasting state, manifested by enhanced oxygen consumption and mitochondrial biogenesis but decreased ATP production. This may suggest low efficacy of oxidative phosphorylation caused by enhanced uncoupling. The other possibility is a metabolic reprogramming to favor aerobic glycolysis over oxidative phosphorylation, called the Warburg effect, which is known to be driven by L-Gln catabolism in cancer cells (Wise et al., 2008; Samudio et al., 2009). Whereas the detailed mechanisms remain to be uncovered, the bioenergetic deficits provide a best explanation for the fact that although MeCP2 is ubiquitously expressed, its deficiency only results in symptoms in high-energy flux tissues, such as the brain and muscle (Gold et al., 2014).
The other significant consequence of abnormal L-Gln metabolism in microglia is overproduction of glutamate, to a degree that may cause low levels of neurotoxicity manifested as pruning of synapses and dendrites (Hutchins and Barger, 1998; Barger et al., 2007), clearly shown in our current data and previous studies (Maezawa and Jin, 2010; O'Driscoll et al., 2013). Physiologically microglial production of glutamate results from oxidative burst producing superoxide by NADPH oxidase and requires lipid peroxidation (Barger et al., 2007). However, the mechanism relevant to MeCP2 appears to center on mitochondria-generated ROS rather than NADPH oxidase activity since two mitochondria-targeted antioxidants normalized the production of glutamate and ATP. A L-Gln-driven mechanism proposed for hepatic encephalopathy is that excessive L-Gln is hydrolyzed by PAG to toxic concentrations of ammonium (as well as high levels of glutamate; Fig. 9), which leads to production of mtROS (Jayakumar et al., 2004; Svoboda and Kerschbaum, 2009; Albrecht et al., 2010). Although it is likely that mtROS, especially hydroxyl radicals, reduce ATP production by their effects on components of the electron transport chain (Zhang et al., 1990), it remains to be elucidated how mtROS enhance abnormal glutamate production in MDM. Nonetheless, our data indicate that excessive mtROS are the “hub” of intertwined mechanisms leading to various mitochondria abnormalities in MDM. Moreover, the ability of SS-31 and mCAT to recover ATP production and reduce glutamate production by MDM is therapeutically significant. These mitochondria-targeted approaches have been developed because of disappointing outcomes of nontargeted antioxidants in clinical trials for aging-related conditions (Dai et al., 2014). Some such compounds have recently moved into clinical trials and could, in principle, benefit girls with RTT (Gruber et al., 2013; Dai et al., 2014). Our results provide the first evidence supporting such a promise. Because RTT is one of the few autism spectrum disorders whose cause is identified as a single gene mutation (Amir et al., 1999; Levitt and Campbell, 2009) and MeCP2 regulation is also abnormal in a large subgroup of autistic individuals (Samaco et al., 2005; Moretti and Zoghbi, 2006; Nagarajan et al., 2008; Levitt and Campbell, 2009; Ramocki et al., 2009), our studies may implicate a novel mechanism for autism where mitochondrial dysfunction also plays a role (Giulivi et al., 2010).
Footnotes
This work was supported by NIH Grants HD073631, HD064817, and GM076063 and by the University of California Davis Intellectual and Developmental Disability Research Center (Grant U54 HD079125). We thank Dr. Peter S. Rabinovitch for providing the mCAT expression plasmid.
The authors declare no competing financial interests.
- Correspondence should be addressed to Dr. Izumi Maezawa, Department of Pathology and Laboratory Medicine, University of California Davis Medical Center, Sacramento, CA 95817. imaezawa{at}ucdavis.edu


