

Article Figures & Data
Figures
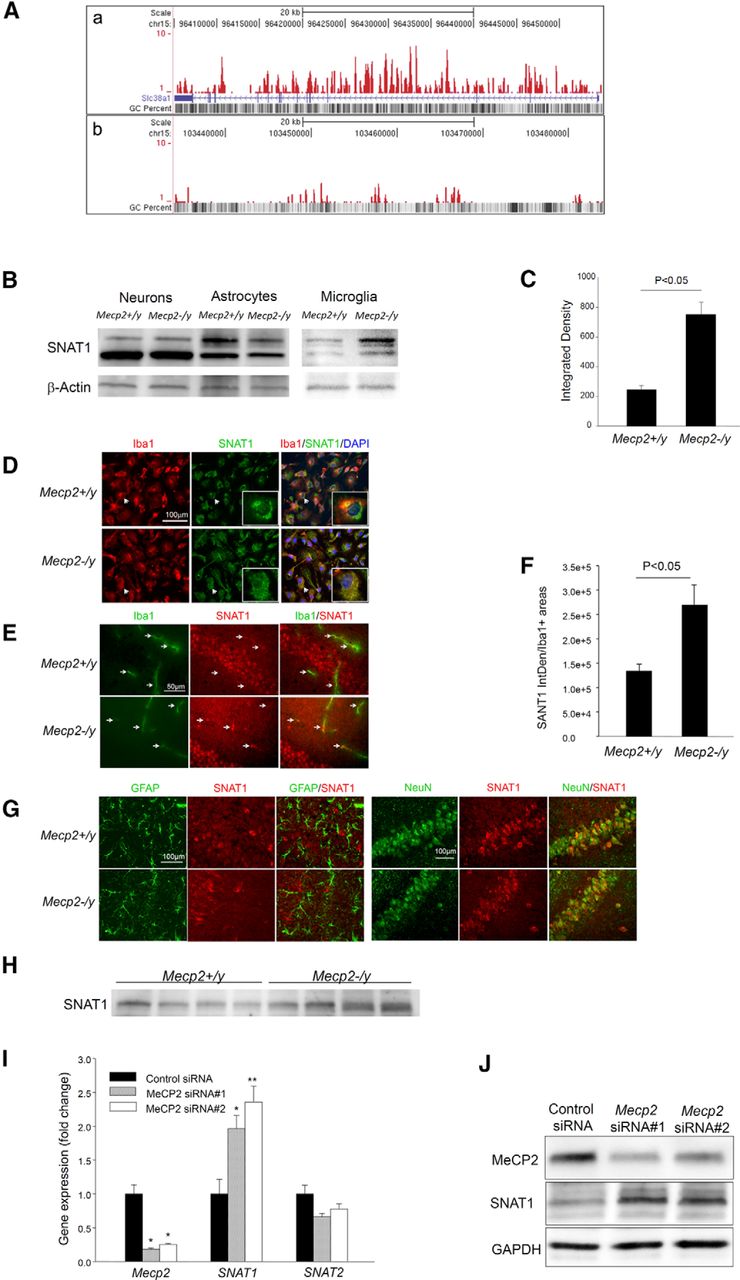
- Figure 1.
MeCP2 is a transcriptional repressor of SNAT1 in microglia. A, ChIP-seq analysis revealed enrichment of MeCP2 binding sites within the gene body of SLC38A1, coding for the glutamine transporter SNAT1. a, The locations of uniquely mapped reads are shown as a series of peaks in the custom University of California Santa Cruz genome browser track. b, As a control, an intergenic region telomeric to SLC38A1 reveals very low levels of MeCP2 binding. B, Representative Western blots of lysates of primary neurons [14 d in vitro (DIV)], astrocytes (14 DIV), and microglia (11–12 DIV) cultured from neonatal mice of the indicated genotype. SNAT1 migrated as triplet bands ∼50 kDa. The band intensity of microglial SNAT1 was rather weak compared with that of neurons or astrocytes, and therefore the blots for microglial SNAT1 were developed longer. C, The bar graph shows mean ± SEM of microglial SNAT1 band intensities, normalized by those of β-actin, from six independent experiments. D, Cultured primary microglia of the indicated genotype were immunofluorescently costained for Iba-1 (red) and SNAT1 (green) and counterstained with DAPI (blue). Representative photomicrographs are shown. The insets show magnified images of the same cells indicated by the arrows. E, Sections of hippocampus of 8-week-old mice were immunofluorescently costained for Iba-1 (red) and SNAT1 (green) and imaged under a confocal microscope. Arrows point to representative Iba-1-positive microglia. F, The bar graph shows mean ± SEM of IntDen values of microglial SNAT1 immunoreactivity in sections, which were quantified in Iba-1-positive areas as described in Materials and Methods. Five 8-week-old mice per group were studied. G, Sections consecutive to those used in E were coimmunostained for GFAP (green)/SNAT1 (red) or NeuN (green)/SNAT1 (red). H, Western blot analysis of SNAT1 in brain homogenates from four Mecp2+/y and four Mecp2−/y (8-week-old) mice. I, Mecp2 knockdown in BV-2 microglial cells by two siRNAs increased the level of SNAT1, but not SNAT2, transcript, which is shown by qPCR (n = 6). J, Western blot analysis of the indicated proteins in BV-2 cells with Mecp2 knockdown by the two siRNAs.
- Figure 2.
Gating strategy and purity of acutely isolated microglia. Microglia were isolated from juvenile mice as described in Materials and Methods and immediately subjected to flow cytometric analysis. A, A representative bivariate plot along the side (SS Lin) and forward (FS Lin) scatters of an acutely isolated microglia sample using CD11b magnetic beads. To exclude tissue debris and dead cells, the live-cell population was gated by R1, which was used for all subsequent analyses. B, To illustrate the purity of the isolated population, microglia isolated from 8-week-old CX3CR1-GFP mice, of which microglia were selectively marked by expression of enhanced green fluorescent protein, were subjected to flow cytometric analysis. More than 95% of R1-gated cells were positive for CX3CR1-GFP (gate R4, red histogram). The blue histogram represents a microglia sample isolated from a wild-type mouse, which served as a negative control. Please see Materials and Methods for a description of the second approach to assess the purity of acutely isolated microglia.
- Figure 4.
SNAT1 mediates the effect of MeCP2 deficiency on microglia glutamate production. A, Primary Mecp2−/y microglia released a high level of glutamate compared with Mecp2+/y microglia, consistent with a previous result (Maezawa and Jin, 2010). Glutamate levels were quantified in 24 h CM. The overproduction of glutamate was inhibited by treating Mecp2−/y microglia with MeAIB (5 μm). n = 4–7. B, Primary wild-type hippocampal neurons, 14 d in vitro, were incubated with the 4 h CM obtained from BV-2/SNAT1 cells at a concentration of 5% (5% CM + 95% regular neuron culture medium). A group of BV-2/SNAT1 CM-treated neurons was also treated with MK-801 (10 μm). At 24 h, neurons were immunostained for MAP2 (red) and PSD-95 (green). Representative photomicrographs are shown. The immunoreactivities were quantified for each treatment and presented as percentage of control (the group in which neurons were treated with CM from BV-2/Cont cells). n = 3. C, Same as described in B, except that neurons were incubated with the 8 h CM (5%) obtained from BV-2/Mecp2-KD cells. n = 3.
- Figure 5.
Abnormal mitochondria in acutely isolated Mecp2−/y microglia. A, Shown are representative electron micrographs of microglia. The left column shows normal ultrastructural features of wild-type Mecp2+/y microglia, and the right column shows abnormal morphological features of Mecp2−/y microglia. White arrows point to mitochondria with “dissolving” features in Mecp2−/y microglia. B, Flow cytometry of microglia acutely isolated from 8-week-old mice labeled with MitoTracker. Shown are representative traces and a bar graph summarizing data of mean fluorescence intensity obtained from four Mecp2+/y and four Mecp2−/y mice. C, D, Primary microglia labeled with MitoTracker. Representative immunofluorescence images are shown in C, and the flow cytometry result is shown in D. n = 3. E, Western blot analysis of mitochondria-specific proteins in primary microglia of the indicated genotype.
- Figure 6.
Abnormal mitochondria function in MDM. A, B, Representative traces of oxygen consumption by BV-2 cells under indicated conditions. FCCP or rotenone was added immediately before the measurements were started. RFU, Relative fluorescence unit. C, D, Fluorescence intensities of each condition at 45 min were subtracted by the intensity values of respective “null controls” (same types of cells treated with rotenone) and plotted. Oxygen consumption in BV-2 cells was driven by the presence of 4 mm L-Gln and enhanced by Mecp2 knockdown (Mecp2-KD; C) or SNAT1 overexpression (D). Enhancement by both could be blocked by MeAIB. n = 3; *p < 0.05. E–G, ATP production was reduced in primary Mecp2−/y microglia (E; n = 6), in BV-2/Mecp2-KD cells (F; n = 7), and in BV-2/SNAT1 cells (G; n = 6). ATP production was recovered by treating the cells with SS31 or transfecting the cells with the mCAT plasmid (F, G).
- Figure 7.
Characterization of the M1–M2 spectrum of Mecp2−/y microglia. qPCR of the listed M1 markers CD86, MHCII, IL-1beta (IL-1b), and TNF-α (TNFa) and M2 markers Arg-1, Ym-1, and IGF-I were performed on RNA samples of microglia acutely isolated from 8-week-old Mecp2+/y (n = 6) and Mecp2−/y (n = 7) mice. Two groups of RNA samples were used as positive controls: pMG-LPS, primary wild-type microglia treated with 100 ng/ml lipopolysaccharides for 24 h (n = 4), and LPS-ICV, microglia acutely isolated from 8-week-old wild-type mice at 24 h after bilateral intracerebroventricular injection of lipopolysaccharides (4 μg per side, n = 4). The expressions of the markers in both experimental groups were generally low, showing no polarization to either M1 or M2, and no differences between groups. In contrast, the two positive control groups showed some marker stratified polarization. N.S., No statistical significance; N.D., not done.
- Figure 8.
Increased mtROS in MDM. A, Flow cytometry of primary microglia cultured from neonatal Mecp2+/y and Mecp2−/y mice and labeled with MitoSox. Shown are representative traces and a bar graph summarizing data from three experiments. B, BV-2/Cont or BV-2/SNAT1 cells were cultured in medium with the L-Gln level reduced to 2 mm. Glutamate levels were quantified in the 4 h CM. n = 3–7. Glutamate production was increased in BV-2/SNAT1 cells, which was reduced to the normal level by treating the cells with SS-31 or cotransfecting the cells with the mCAT plasmid. C, BV-2/Cont or BV-2/Mecp2-KD cells were cultured in medium with the L-Gln level reduced to 2 mm. Glutamate levels were quantified in 8 h CM. n = 3–6. Glutamate production was increased in BV-2/Mecp2-KD cells, which was reduced by treating the cells with SS-31, but not by cotransfecting the cells with the mCAT plasmid.
- Figure 9.
Proposed mechanism of SNAT1-mediated mitochondrial dysfunction and glutamate overproduction. Glu, l-Glutamate; GJhc, gap junction hemichannels. MeCP2 is a transcriptional repressor of the SNAT1 gene. MeCP2 deficiency directly upregulates SNAT1 and also indirectly upregulates PAG and the connexin 32 component of GJhc as reported previously (Maezawa and Jin, 2010), causing increased intracellular L-Gln concentration, mitochondria ROS generation, and enhanced glutamate production and release. ROS induces uncoupling and aggravates glutamate overproduction, which can be blocked by mCAT and SS-31.


