

Abstract
The medial temporal lobe is implicated as a key brain region involved in the pathogenesis of Alzheimer's disease (AD) and consequent memory loss. Tau tangle aggregation in this region may develop concurrently with cortical Aβ deposition in preclinical AD, but the pathological relationship between tau and Aβ remains unclear. We used task-free fMRI with a focus on the medical temporal lobe, together with Aβ PET imaging, in cognitively normal elderly human participants. We found that cortical Aβ load was related to disrupted intrinsic functional connectivity of the perirhinal cortex, which is typically the first brain region affected by tauopathies in AD. There was no concurrent association of cortical Aβ load with cognitive performance or brain atrophy. These findings suggest that dysfunction in the medial temporal lobe may represent a very early sign of preclinical AD and may predict future memory loss.
Introduction
Alzheimer's disease (AD) is a neurodegenerative disorder characterized by the presence of extracellular amyloid-β (Aβ) plaques, intracellular tau tangles, and neurodegeneration leading to progressive cognitive impairment and dementia (Arnold et al., 1991; Braak and Braak, 1991). Postmortem studies estimate that ∼30% of cognitively healthy elderly meet the pathological criteria for AD with widespread cortical Aβ plaque deposition (Price et al., 2009; Braak et al., 2011), which is consistent with findings in Aβ PET imaging (Aizenstein et al., 2008; Jack et al., 2013). These individuals are thought to harbor “preclinical AD” as described by the National Institute on Aging Alzheimer's Association Research Criteria (Sperling et al., 2011).
There have been mixed findings concerning the effects of brain Aβ load using Aβ PET on cognitive performance and brain structures in preclinical AD. Although some studies have found that normal subjects with substantial cortical Aβ load have subtle memory impairments (Hedden et al., 2012; Villemagne et al., 2013), other studies have found no effects on any cognitive performance (Aizenstein et al., 2008). Similarly, some studies show that cognitively normal subjects with substantial Aβ load have subtle brain atrophy (Fjell et al., 2010), whereas other studies find no effects on brain structures (Josephs et al., 2008) or even the presence of larger regional brain volumes (Chételat et al., 2010). Both task-related and task-free fMRI studies have shown abnormal activity in the default network in Aβ-positive subjects (Hedden et al., 2009; Sperling et al., 2009; Mormino et al., 2011). Together, the existing data suggest that abnormal brain activity precedes brain atrophy and cognitive impairment in preclinical AD.
The medial temporal lobe (MTL) is implicated as a key brain region involved in the pathogenesis of AD and consequent memory loss. Postmortem studies find that tau tangles aggregate the earliest in trans-entorhinal cortex, which is the medial portion of the perirhinal cortex (Taylor and Probst, 2008), and then in the entorhinal cortex before the onset of dementia (Braak and Braak, 1991). Consistently, preclinical AD subjects exhibit reduced regional metabolism in the perirhinal and entorhinal cortices, which is related to later memory decline (Khan et al., 2014). Although their pathological relationship remains unclear (Mann and Hardy, 2013), the MTL tau is considerably increased in normal subjects with cortical Aβ (Braak et al., 2011; Sperling et al., 2014). Therefore, cortical Aβ load may serve as a reasonable indicator to the degree of tau tangle aggregation in the MTL in the cognitively normal elderly.
In the present study, we performed task-free fMRI focused on the MTL, together with Aβ PET imaging, in cognitively normal elderly subjects. We tested the hypothesis that cortical Aβ load in preclinical AD is associated with the regional pathology in the MTL, which may be reflected by disrupted functional connectivity between MTL subregions. Although both the perirhinal and entorhinal cortices are implicated in early AD pathology, our analyses were focused on the connectivity of the perirhinal cortex due to relatively milder fMRI signal loss as assessed in our data.
Materials and Methods
Participants.
Cognitively normal elderly human subjects were recruited with written consent before the study by the Memory and Aging Center and the Center for Imaging of Neurodegenerative Diseases at the University of California, San Francisco. Exclusion criteria included any significant medical illness, history of brain trauma, brain surgery, or evidence of other neurological diseases. The Clinical Dementia Rating (CDR) score was 0 for all participants and normal Mini Mental State Examination (MMSE) was >27. Genetic information of ApoE4 status was extracted from blood draw. Cognitive function was assessed with a battery of standard neuropsychological tests including the California Verbal Learning Test II (CVLT-II), Wechsler Memory Scale (WMS) visual reproduction, and Delis-Kaplan Executive Function System (D-KEFS). Memory function was further assessed by a behavioral pattern separation task (BPS-O), which was demonstrated to be sensitive to memory decline in aging (Stark et al., 2013). A total of 56 cognitively normal elderly subjects were enrolled. Six subjects were excluded from analysis due to severe head motion during MRI scanning, incomplete data acquisition, failed image quality assessment, or anatomical abnormality. The remaining 50 subjects, age 60–92 years (27 female, mean age 71.4 years), were included. Table 1 shows relevant demographic information.
Demographic, neuropsychological, and brain structure characteristics of the study cohort (N = 50)
Florbetapir PET imaging.
Amyvid florbetapir F18 AV-45 PET was acquired to determine Aβ plaque density in the brain. The scan was performed on either a GE Discover 690 at the San Francisco VA Medical Center (n = 16) or a GE Discovery STE VCT at the University of California, San Francisco at China Basin (n = 34). Standardized uptake value ratio (SUVr) was defined as the ratio of mean Aβ tracer uptake within six cortical gray matter regions (frontal, temporal, parietal, anterior cingulate, posterior cingulate, and precuneus) to the reference uptake in the entire cerebellum (Fleisher et al., 2011). An independent-samples t test found no site effects on SUVr (1.11 ± 0.14 vs 1.09 ± 0.14) controlling for age and ApoE4 status. Visual reading of cortical Aβ deposition was performed independently by two certified raters. A third certified rater was recruited if there was disagreement between the first two raters. All raters of visual reading were blind to SUVr, age, sex, and medical records. Raters determined positive cortical Aβ deposition when there was distinctly reduced contrast between cortical gray matter and adjacent white matter indicating greater tracer uptake in cortical gray matter (Fleisher et al., 2011).
MRI data acquisition.
MRI was performed on a 3 tesla Siemens Skyra system with a 16-channel receiver head coil. Participants were instructed not to consume caffeine for 12 h before scanning to limit its potential effects on functional connectivity in the brain (Rack-Gomer and Liu, 2012). In resting state with eyes closed, fMRI data were acquired with a gradient-echo, echoplanar, T2* weighted pulse sequence: TR/TE = 2000/30 ms; flip angle, 80°; parallel acceleration GRAPPA factor, 2; phase partial Fourier factor, 7/8; field of view, 154 mm; matrix size, 128 × 128; slice thickness, 3 mm; and feet-to-head phase-encoding direction. Global shimming and prescan normalization were applied to reduce susceptibility-induced signal loss and distortion in the brain. Particularly, the isocenter of shimming was set near hippocampal heads to obtain optimal shimming near hippocampus and the adjacent MTL cortices. The first five TRs were discarded to allow for T1 equilibration. Twenty oblique coronal slices with no gap were acquired perpendicular to the long axis of the hippocampus. The coverage was ∼1/3 of the entire brain with a focus on the MTL region. The acquisition time was 8 min (240 frames). For the coregistration purpose, 10 volumes were acquired with the same acquisition parameters as the MTL-fMRI sequence except that TR was increased to 6500 ms to capture the entire brain volume with 65 oblique coronal slices. Anatomical whole brain T1-weighted structural MRI was acquired with a 3D volumetric magnetization prepared rapid gradient echo (MPRAGE) sequence: TR/TE/TI = 2300/3/1000 ms; flip angle, 9°; field of view, 256 mm; matrix size, 256 × 256; slice thickness, 1 mm; and 192 continuous sagittal slices.
Structural MRI analysis.
Cortical volumes and thickness were measured with the FreeSurfer image analysis suite version 5.1 (Fischl and Dale, 2000; Fischl et al., 2004). The Aβ effects on cortical thickness and regional brain volumes were assessed using linear regression analyses against the SUVr controlling for age, education, and addition. In addition, the intracranial volume was controlled for in the analyses of regional brain volumes.
fMRI preprocessing.
The fMRI data were processed using with the FSL (Jenkinson et al., 2012) and AFNI software suites (Cox, 1996). All fMRI frames were aligned to the middle frame with rigid registration to reduce head motion effects. In addition to the six-parameter rigid body head motion, the mean intensity in deep white matter and CSF were regressed out to remove the effects of regionally nonspecific variability. Temporal filtering retained frequency in the range of ∼0.01–0.1 Hz. With ∼1/3 of the brain coverage in the fMRI, coregistration of fMRI volumes to structural MRI was done with a 2-step procedure. Using rigid registration for each individual brain, the mean MTL-fMRI volume was first aligned to the mean volume of the whole brain fMRI acquired with the same resolution and then aligned to the T1-weighted anatomical image. The fMRI data were smoothed by a Gaussian filter with 3 mm full-width at half maximum within the anatomical boundaries of the MTL.
The T1-weighted MRI template of the same study cohort, unbiased toward the degree of cortical Aβ load, was constructed using the image registration software Advanced Normalization Tools (Avants and Gee, 2004). Anatomical boundaries of the MTL structures consisting of hippocampus, entorhinal cortex, perirhinal cortex, and parahippocampal cortex, were manually outlined in the anatomical T1-weighted template based on anatomical landmarks (Insausti et al., 1998a; Insausti et al., 1998b). In addition, hippocampal heads were outlined on coronal slices starting from the anterior tip of hippocampus until the disappearance of the uncal apex (Yushkevich et al., 2010).
Temporopolar cortex was not outlined because it was not covered in the present fMRI acquisition protocol. All anatomical labels were registered from the anatomical T1-weighted template to each individual fMRI space using the established transformation.
Motion analysis in fMRI.
Head motion was assessed during fMRI acquisition to determine whether it introduced any bias to the functional connectivity analysis. Displacement of each fMRI frame to the previous frame was defined as the total translation in the 3D space based on rigid registration. For each individual subject, mean head displacement was defined as the root-mean-square of displacement over the entire time series (Van Dijk et al., 2012). The number of large motion events was defined as the number of fMRI frames that had >0.5 mm displacement from the previous frame. The rotation of each fMRI frame to the previous frame was defined as sum of the 3 element rotations in the 3D space. We used mean displacement as the major measurement of head motion because rotation is highly correlated with displacement (Van Dijk et al., 2012). Rotation has relatively small effects to the MTL structures for their adjacency to the center of rotational transformation in rigid registration across fMRI frames.
Signal loss analysis in fMRI.
Signal loss of fMRI often occurs in the MTL, especially in the entorhinal and perirhinal cortices (Olman et al., 2009). We assessed signal loss with both visual inspection and quantification. We first matched intensity histograms of mean fMRI volumes to reduce interscan image intensity variation. After histogram matching, the mean fMRI intensity of hippocampus was measured at 786.7 ± 24.4. We assumed that the mean fMRI signal intensity in other MTL subregions should be at a similar level as in the hippocampus if there was no signal loss. Therefore we used mean fMRI intensity of 400 (∼50% of the mean signal intensity in the hippocampus) as a threshold to assess fMRI signal loss in the MTL.
Anatomical ROI analysis of functional connectivity.
Our analyses were focused on the functional connectivity of the perirhinal cortex because of its vulnerability to tauopathies in the earliest pathological stages of AD (Braak and Braak, 1991; Braak et al., 2011) and also because of its relatively milder fMRI signal loss than the entorhinal cortex. It is well understood that the perirhinal cortex is more functionally connected to the anterior hippocampus than to the posterior hippocampus (Poppenk et al., 2013). This connectivity pattern was demonstrated in a recent fMRI study of intrinsic functional connectivity in healthy young adults (Libby et al., 2012). Therefore, we assessed Aβ effects on the intrinsic functional connectivity of the perirhinal cortex with the anterior hippocampus. The intrinsic functional connectivity was measured as Pearson's correlation of the mean fMRI time series of each pair of anatomical ROIs in the native fMRI space. Linear regression modeling was used to assess the relationship between cortical Aβ load and the functional connectivity, for which age, education, and sex were controlled as nuisance variables. Because we found no ApoE4 effects on any of the functional connectivity (p > 0.50 for all tests), ApoE4 status was not included in the final linear regression models.
For topographic differences within the perirhinal cortex (Suzuki and Amaral, 2003), we further investigated whether fMRI signal loss might bias the analysis of functional connectivity of the perirhinal cortex because fMRI signal loss might vary across subjects. We repeated the functional connectivity analysis with overlapped ROIs that survived the signal loss censoring. The overlapped ROIs were created in two steps. In the first step, the anatomical ROIs that were originally censored for fMRI signal loss in the native fMRI space were registered to the anatomical template using the established transformations. In the anatomical template space, the overlapped region of each censored ROI was created as the set of voxels that survived the censoring in >80% of the subjects. This criterion was heuristic and there were almost no voxels in the perirhinal cortex that survived the censoring in 100% of the subjects. This was a voxel-by-voxel decision so the composition of subjects might differ across the survived voxels. In the second step, the overlapped anatomical ROIs were registered back to each individual fMRI space, where the functional connectivity between ROIs was recalculated in the same manner as in the original analysis.
Voxelwise regression analysis of functional connectivity.
We performed voxelwise regression analysis to detect Aβ effects on the functional connectivity of the perirhinal cortex to other MTL subregions. Functional connectivity maps were created with the seed of either the left or right perirhinal cortex in the native fMRI space. Signal loss voxels in the entire fMRI coverage in the MTL were excluded in the same way as in the anatomical ROI analysis. The functional connectivity maps of the seeds were then warped to the anatomical template with established transformations. In the anatomical template, voxelwise linear regression analyses were performed on the correlation maps against the SUVr (p < 0.05, corrected).
Results
Visual assessment of cortical Aβ load in florbetapir PET determined that 23 participants were Aβ positive and 27 were Aβ negative. The SUVr was estimated in the range of 0.88 to 1.49. Except for minor discrepancies in 4 subjects, visual assessments matched with the cutoff threshold of SUVr at 1.10 (Landau et al., 2013). There was no significant relationship between ApoE4 status and cortical amyloid load (p = 0.11) in this group.
There were no significant effects of cortical Aβ load on any neuropsychological scores (Table 1), including the memory-related scores that were assessed with the CVLT-II and BPS-O tasks. Three scores in the D-KEFS that were related to executive function were marginally related to SUVr in single tests (Table 1), but the relationship was not significant after multiple-comparison correction controlling for the false discovery rate.
In the FreeSurfer analysis of T1-weighted MRI, we found no brain regions in which there was a negative relationship of either regional volumes or cortical thickness with SUVr. Therefore, there was no indication of Aβ-related atrophy in any brain regions. In contrast, SUVr had a positive relationship with gray matter volumes in the left entorhinal cortex (R2 = 0.15, p < 0.01) and right lateral orbitofrontal cortex (R2 = 0.09, p < 0.05). Neither of these relationships survived multiple-comparison correction.
Motion analysis in fMRI
The mean frame-to-frame head displacement in the entire fMRI scan was 0.13 ± 0.06 mm and the maximum frame-to-frame head displacement was 0.44 ± 0.23 mm. Consistent with previous studies (Power et al., 2012; Van Dijk et al., 2012), the mean frame-to-frame rotation was highly correlated with mean displacement (R2 = 0.69). The number of large motion events was no more than 10 for all subjects and 92% of the subjects had no more than three large motion events. Mean frame-to-frame head displacement was not significantly related to SUVr (R2 = 0.04, p = 0.15), but was related to age (R2 = 0.08, p = 0.04).
Signal loss analysis in fMRI
FMRI signal loss was present in the MTL (Fig. 1). The perirhinal and entorhinal cortices were the main MTL subregions that were affected by fMRI signal loss. The ratio of signal loss voxels estimated with the predefined threshold was 13.9 ± 15.8% in the left perirhinal cortex, 14.2 ± 12.0% in the right perirhinal cortex, 22.0 ± 24.4% in the left entorhinal cortex, and 18.0 ± 18.8% in the right entorhinal cortex. Visual inspection also found that there was relatively milder signal loss in the perirhinal cortex than in the entorhinal cortex. Subsequent analyses were therefore primarily focused on the functional connectivity of the perirhinal cortex even though the entorhinal cortex is also implicated in early AD pathology.

Mean fMRI volume of one example subject in coronal (A) and sagittal (B) views. L, Left; R, right; A, anterior; P, posterior; HH, hippocampal head; HB, hippocampal body; ERC, entorhinal cortex; PRC, perirhinal cortex; PHC, parahippocampal cortex.
Anatomical ROI analysis of functional connectivity
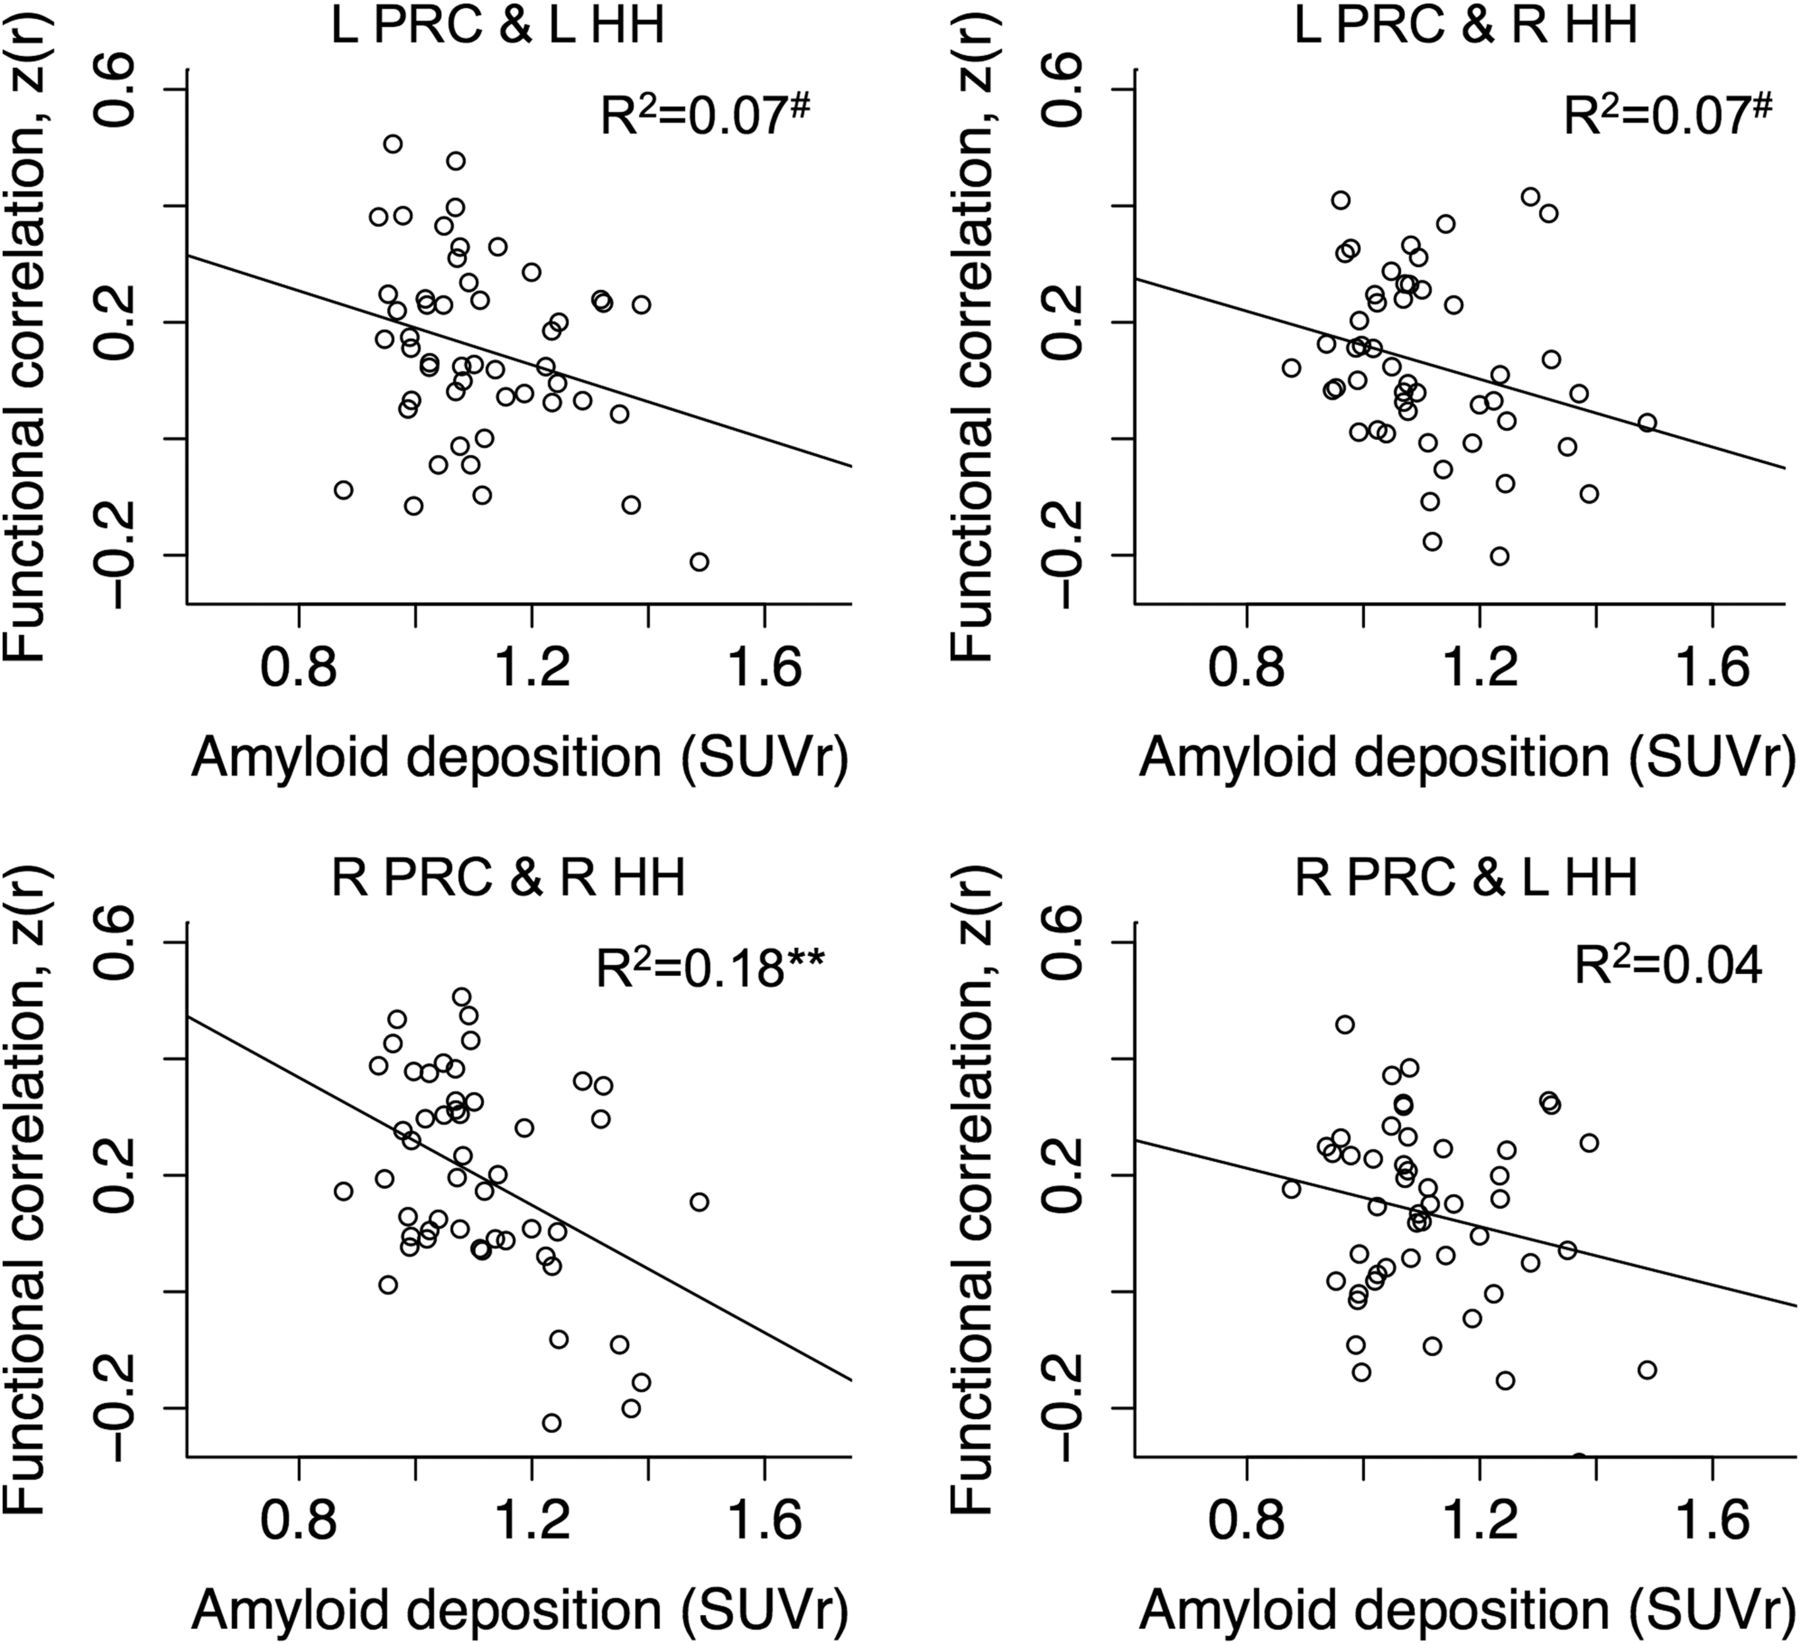
Linear regression analysis revealed a negative effect of cortical Aβ load on the intrinsic functional connectivity between the right perirhinal cortex and the right hippocampal head (R2 = 0.18, p = 0.002; Fig. 2). Marginal effects of cortical Aβ load were observed on the functional connectivity of the left perirhinal cortex to the left hippocampal head (R2 = 0.07, p = 0.06) and the right hippocampal head (R2 = 0.07, p = 0.07). A weak Aβ effect was found on the functional connectivity of the right perirhinal cortex to the left hippocampal head (R2 = 0.04, p = 0.15). There were no significant effects of age, sex, or education on any of the functional connectivity measurements (R2 < 0.07 for all the three independent variables together). We also found no significant relationship of mean head displacement with any of the functional connectivity measurements (R2 < 0.05, p > 0.15). Furthermore, independent linear regression analyses found no significant relationship of cortical Aβ load with the temporal variability (i.e., SD) of fMRI signals in each of the four ROIs (R2 < 0.05, p > 0.15).

Scatter plots of functional connectivity between anatomical ROIs of the perirhinal cortex and hippocampal heads against the SUVr. The correlation between the SUVr and the functional connectivity in each subplot was assessed controlling for age, education, and sex. L, Left; R, right; HH, hippocampal head; PRC, perirhinal cortex. #p < 0.1; *p < 0.05; **p < 0.01.
To determine whether fMRI signal loss had any effects on the findings, we repeated the functional connectivity analysis with the overlapped ROIs that survived the censoring of fMRI signal loss in the majority of the subjects. The overlapped ROI of the left perirhinal cortex was a contiguous region with the volume of 1228.5 mm3, which was centered at the Talairach coordinates of (x = −30.3, y = −6.6, z = −25.3); the overlapped ROI of the right perirhinal cortex was primarily a contiguous region with the volume of 1505.3 mm3, which was centered at the Talairach coordinates of (x = 31.4, y = −10.0, z = −25.8). These two overlapped ROIs were close to the medial portions of the perirhinal cortex (Fig. 3). Because the hippocampus was not severely affected by fMRI signal loss, the overlapped ROIs of the hippocampal heads remained the same as the original anatomical ROIs. In the analysis of cortical Aβ load and functional connectivity, there were only slight adjustments to the original findings, as shown in Figure 2. In particular, there was a slight increase of the negative Aβ effects on the functional connectivity between the right perirhinal cortex and the right hippocampal head (R2 = 0.20, p = 0.001; Fig. 3C). The functional connectivity of the two overlapped ROIs was highly consistent with that of the original ROIs (R2 = 0.75; Fig. 3D). Therefore, our original analyses of the functional connectivity in the MTL were robust against fMRI signal loss.

Overlapped ROI of the right perirhinal cortex that survived the signal loss censoring in the majority of the participants. A, The overlapped ROI was located near the medial portion of the right perirhinal cortex. It is labeled with red color in the sagittal and coronal views of the anatomical template image. B, Scatter plot against the SUVr of the functional connectivity between the overlapped ROIs of the right perirhinal cortex and the right hippocampal head. C, Scatter plot of the functional connectivity between the overlapped ROIs of the right perirhinal cortex and the right hippocampal head against the functional connectivity between the originally censored ROIs (R2 = 0.75).
Voxelwise regression analysis of functional connectivity
Using the left perirhinal cortex seed, the statistical map derived from linear regression against the SUVr is displayed in Figure 4A. Cortical Aβ load was negatively associated with the functional connectivity of the seed with the left hippocampal head (Fig. 4B, Table 2). We repeated the same analysis for the right perirhinal cortex seed. The statistical map derived from linear regression analysis against the SUVr is displayed in Figure 5A. Cortical Aβ load was associated with the intrinsic functional connectivity of the seed with the right hippocampal head, right perirhinal cortex, and left hippocampal head (Fig. 5B, Table 2).

Direct detection of Aβ effects on functional connectivity of the left perirhinal cortex seed. A, Sagittal and coronal views of the statistical map within the medial temporal lobe defined by the linear regression analysis of functional connectivity to the seed region against the SUVr. B, Sagittal and coronal views of the cluster region in the medial temporal lobe where the SUVr had a significant effect on the functional connectivity to the left perirhinal cortex seed (Table 2). X, Left/right Talairach coordinate; Y, anterior/posterior Talairach coordinate; L, left; R, right; A, anterior; P, posterior.
Medial temporal lobe regions exhibiting a significant relationship with SUVr in their functional connectivity to the perirhinal cortex seeds in voxelwise linear regression analyses (p < 0.05, corrected)

Direct detection of Aβ effects on functional connectivity of the right perirhinal cortex seed. A, Sagittal and coronal views of the statistical map within the medial temporal lobe defined by the linear regression analysis of functional connectivity to the seed region against the SUVr. B, Sagittal and coronal views of the cluster regions in the medial temporal lobe where the SUVr had a significant effect on the functional connectivity to the right perirhinal cortex seed (Table 2). Different colors indicate different cluster regions. X, Left/right Talairach coordinate; Y, anterior/posterior Talairach coordinate; L, left; R, right; A, anterior; P, posterior.
Discussion
The major finding in the present study was that cortical Aβ load in cognitively normal elderly subjects was associated with aberrant functional connectivity of the perirhinal cortex in the MTL. We focused on the functional connectivity of the perirhinal cortex because of its vulnerability to tauopathies in the earliest stage of AD (Braak and Braak, 1991; Braak et al., 2011). The perirhinal cortex is more functionally connected to the anterior hippocampus than to the posterior hippocampus (Kahn et al., 2008; Libby et al., 2012). This connectivity pattern reflects the long-axis specialization of structural connectivity of the hippocampus and plays an important role in the MTL memory system (Poppenk et al., 2013). In the anatomical ROI analysis, we found that cortical Aβ load was related to reduced functional connectivity between the perirhinal cortex and the hippocampal heads, particularly on the right side of the brain (Fig. 2). Independently, the voxelwise linear regression analysis with the perirhinal cortex seeds was consistent with the findings of the anatomical ROI analysis (Figs. 4, 5, Table 2).
To the best of our knowledge, this is the first study to find that, in the absence of effects on cognition and brain structures, cortical Aβ load in the cognitively normal elderly subjects is associated with the disruption of functional connectivity in the MTL. It supports the view that cortical Aβ deposition in the cognitively normal elderly may indicate regional tauopathies in the MTL (Braak and Braak, 1991; Schönheit et al., 2004; Braak et al., 2011), which is a key pathology of AD. Our finding also suggests that disrupted functional connectivity in the MTL may represent an early pathological change in the development of AD, preceding measurable changes in brain structures and cognitive performance. Given the critical role of the MTL in normal memory function, functional deficits in the MTL may predict memory loss or dementia at a later stage of pathological development.
The association of cortical Aβ load with disrupted functional connectivity in the MTL has an important implication to the pathogenesis of AD. The amyloid hypothesis (Hardy and Selkoe, 2002) proposes that the accumulation of tau tangles is a downstream event of the brain Aβ deposition. Based on this view, AD can be conceptualized as an Aβ-facilitated tauopathy. In particular, as cortical Aβ deposition increases in preclinical AD, tau tangles may accumulate concurrently in the perirhinal and entorhinal cortices as in the asymptomatic Braak stages I-II (Braak and Braak, 1991; Braak et al., 2011). Although the MTL structures have low susceptibility to neuritic Aβ plaques, as identified in both pathological (Arnold et al., 1991; Braak and Braak, 1991; Price and Morris, 1999) and PET studies (Klunk et al., 2004), diffuse non-neuritic Aβ plaques, as opposed to neuritic Aβ plaques, are found extensively in the perirhinal and entorhinal cortices in the asymptomatic Braak stages I and II (Thal et al., 2000). Given their neurotoxicity (Mucke and Selkoe, 2012), soluble or diffuse forms of Aβ may play a key role in facilitating tauopathy in the MTL, which may therefore lead to disrupted functional connectivity in the local MTL circuitry. Consistently, cortical Aβ deposition in early AD has been related to reduced glucose metabolism in the MTL in FDG-PET (Frings et al., 2013). The hypothesis of Aβ-facilitated tauopathy in the MTL can be further tested using newly developed tau tracers in PET imaging. Preliminary tau-PET studies have demonstrated increased uptake of tau tracers in the MTL in cognitively normal elderly subjects who were Aβ positive (Keith Johnson, personal communication). We predict that the degree of tau tangle aggregation should correlate with disrupted functional connectivity between the vulnerable MTL structures.
It is also possible that tauopathies may induce neuronal dysfunction directly in the absence of Aβ. Although the accumulation of tau tangles in the MTL may temporally overlap with the accumulation of Aβ plaque deposition in neocortical regions (Jack and Holtzman, 2013), the pathological pathways of tau and Aβ may be independent. A recent study found that hippocampal neurodegeneration occurs before incidental Aβ positivity (Jack et al., 2013). This finding indicates that tau-mediated neurodegeneration in the MTL may precede cortical Aβ deposition. In addition, pathological studies have also found that the accumulation of tau tangles in the MTL may precede cortical Aβ deposition (Schönheit et al., 2004). The spatiotemporal distribution of tau accumulation in relation to Aβ deposition and their downstream effects can be further investigated with the future availability of tau-PET.
Conversely, disrupted intrinsic connectivity in the MTL may reflect a downstream effect of epileptiform activity in the same region. Epileptiform activity has been associated with AD pathology in both animal models and human patients (Palop and Mucke, 2009). Aberrant hippocampal hyperactivity was observed in asymptomatic familial AD patients (Quiroz et al., 2010), cognitively normal young carriers of ApoE4 (Filippini et al., 2009), and early mild cognitive impairment patients (Putcha et al., 2011; Bakker et al., 2012), as well as a transgenic mouse model of AD (Busche et al., 2012). The role of epileptiform activity in the disrupted perirhinal-hippocampal functional connectivity could be investigated by performing simultaneous EEG/fMRI recordings in Aβ-positive individuals (Mishra et al., 2013; Kay et al., 2014).
Limitations
The first major limitation of our study is our use of Aβ PET to assess the pathology in the MTL at the preclinical stage. Aβ PET can detect neuritic Aβ plaques but not soluble forms of Aβ (Klunk et al., 2004). Those undetected soluble Aβ forms may be more neurotoxic and relevant in early pathological development of AD (Mucke and Selkoe, 2012). In addition, although the development of Aβ pathology and tauopathy are highly correlated (Braak et al., 2011), it is uncertain how these two pathological pathways are related to each other at the individual level. This issue will be better addressed with tau-PET in future investigation.
The second major limitation is our use of fMRI to measure functional connectivity in the brain. First, based on the blood oxygen level, fMRI measures cerebral metabolic rate of oxygen consumption, which measures local neuronal activity indirectly. Therefore, the relationship between fMRI signal and neural activity may be confounded by hemodynamics and neurovascular coupling in pathological conditions (D'Esposito et al., 2003). Indeed, there is evidence that the Aβ pathology may impair neurovascular coupling (Popa-Wagner et al., 2013). Our finding of reduced functional connectivity may partly reflect vascular impairments. Second, the functional relevance of the low temporal frequency functional connectivity (<0.1 Hz) measured in task-free fMRI is not completely understood, and neither is its relationship to neural oscillation and synchronization at higher frequencies in the MTL memory system (Buzsáki and Moser, 2013). Third, fMRI in the MTL region suffers from susceptibility-induced signal loss and geometric distortion (Olman et al., 2009). The severity of such imaging artifacts depended on individual anatomy (e.g., air-tissue interface) in addition to the fMRI protocol and the physical conditions of the scanner. In addition to global shimming and prescan normalization, we optimized imaging parameters to reduce signal loss and distortion with small voxel size and a number of fast acquisition techniques including parallel imaging, partial phase Fourier, short echo time, large receiver bandwidth, and reduced field of view in the phase encoding direction. In postscan processing, we censored signal loss voxels with a threshold of the mean fMRI signals before assessing functional connectivity in native fMRI. Importantly, we demonstrated that our findings were robust against the fMRI signal loss that was presented in our data (Fig. 3).
Furthermore, it is understood that head motion during fMRI acquisition may confound the measurement of functional connectivity (Power et al., 2012; Van Dijk et al., 2012). Conversely, head motion may partly reflect neurobiological traits in individuals (Zeng et al., 2014). As we estimated quantitatively, head motion was relatively mild in the present study sample. To minimize the residual effects of head motion in fMRI data after coregistering all fMRI frames for each individual, we regressed out in the time series data the six motion parameters of each frame relative to the previous frame that were estimated by rigid registration in addition to the mean signal of white matter and CSF.
Conclusion
The present study finds that cortical Aβ load in the cognitively normal elderly is associated with disrupted functional connectivity of the perirhinal cortex, which is typically the first brain region affected by tau tangle aggregation in AD. This finding holds despite the absence of Aβ effects on cognition and brain structures. We suggest that the disrupted connectivity in the MTL is one of the earliest changes in preclinical AD and thus may serve as a relevant predictor of future memory decline. To the best of our knowledge, this is the first fMRI study that links cortical Aβ deposition with functional connectivity measures confined to the MTL in the cognitively normal elderly subjects. It has implications for our understanding of the pathogenesis of AD and the predominant memory loss as the disease progresses.
Footnotes
This work was supported by the National Institutes of Health (Grants 5R01AG010897-27, P50AG023501, and 8P41EB015904-05). We thank Avid radiopharmaceuticals for providing Florbetapir PET tracers, Craig Stark and Michael Yassa for sharing the Behavioral Pattern Separation-Objects task, and Laura Aronow for piloting the task.
M.W.W. is on the scientific advisory boards of Neurotrope Bioscience, has served as consultant for GroupH, has received commercial research support from Merck and Avid, and has stock options in Alzheon. The remaining authors declare no competing financial interests.
- Correspondence should be addressed to Michael W. Weiner, MD, Veterans Affairs Medical Center, 4150 Clement Street (114M), San Francisco, CA 94121. Michael.Weiner{at}ucsf.edu


