

Article Figures & Data
Figures
- Figure 1.
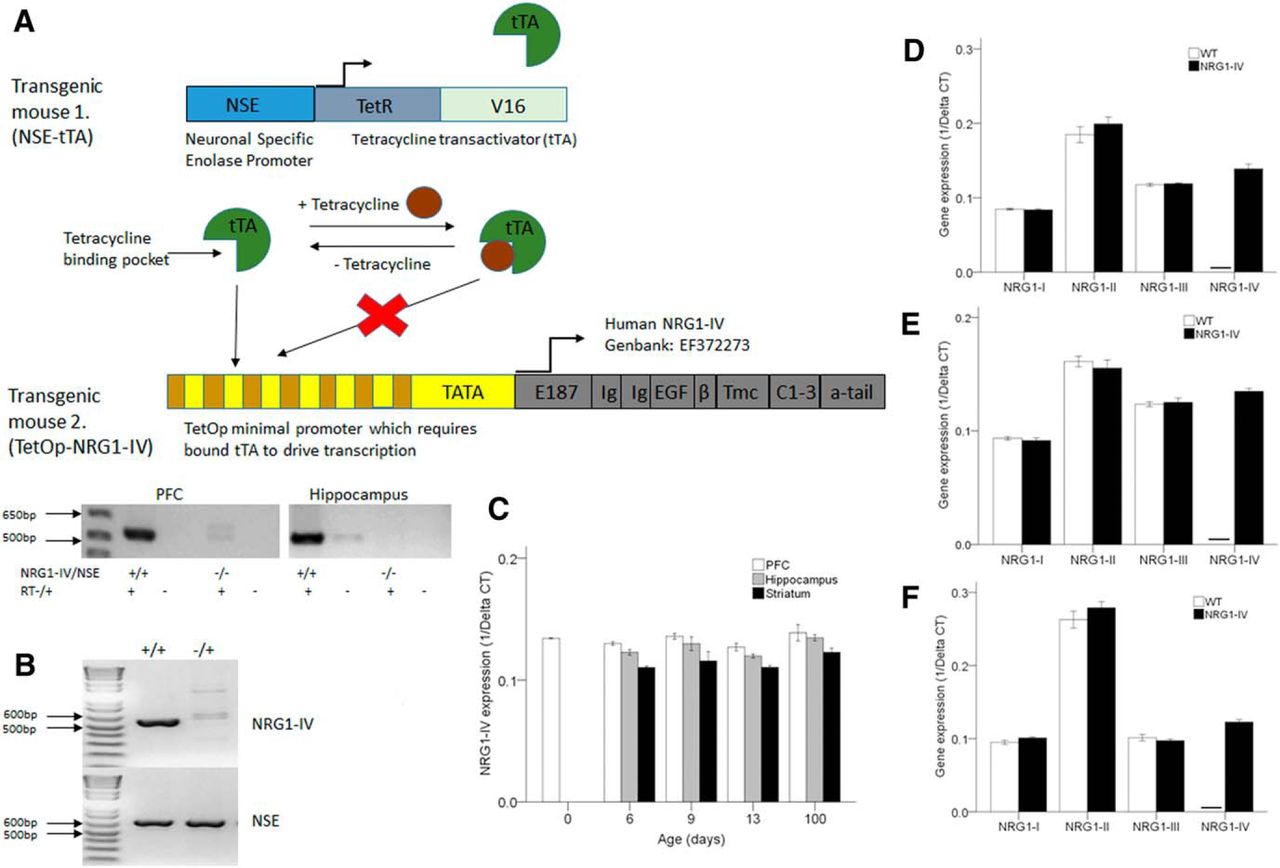
Transgenic construct design and tissue-specific expression profiling of the NRG1-IV transgene and endogenous NRG1 splice isoforms types I–III in mouse brain across development. A, Schematic of the TET-OFF transgenic technology used in the generation of NRG1-IV/NSE-tTA mice. Transgenic mice 1, which encode tTA under the control of the NSE promoter, are cross-bred with transgenic mice 2, which encode human NRG1-IV under the control of the tetracycline-responsive promoter TetOP. In bigenic mice (+/+), tTA drives NRG1-IV expression to create NRG1-IV/NSE-tTA transgenics. For original and complete structure of NRG1-IV-EF372273, see (Tan et al., 2007). Bottom, RT-PCR expression of human NRG1-IV in hippocampus and PFC of NRG1-IV/NSE-tTA mice (+/+). B, Bigenic genotyping for human NRG1-IV and NSE. +/+ denotes NRG1-IV/NSE-tTA mice that express the transgene; −/+ denotes NSE control littermates who do not express NRG1-IV. C, Quantitative RT-PCR expression analysis of NRG1-IV transgene expression in the mPFC, hippocampus, and striatum of NRG1-IV/NSE-tTA mice. C, Day 0, n = 5 (PFC only; hippocampus and striatum not available for dissection); day 6, n = 7; day 9, n = 5; day 13, n = 8; day 100, n = 8. D–F, NRG1-IV, n = 8; WT, n = 6 at PND 100. D is the PFC; E, hippocampus; F, striatum. Horizontal bar denotes absence of detectable expression.
- Figure 2.
Impaired prepulse inhibition of startle response (PPI), temporal order discrimination, and object location memory in NRG1-IV/NSE tTA mice. A, C, Startle amplitude displayed by WT and NRG1-IV/NSE-tTA mice (#6 and #13, respectively) after the presentation of a 120 dB stimulus. B, D, Percentage prepulse inhibition of the acoustic startle response displayed by the same mice after the presentation of prepulse (n = 12 WT and n = 19 NRG1-IV; founder line #6 and n = 10 WT and n = 18 NRG1-IV; founder line #13). GLM MANOVA. Variances were statistically significant between genotype groups (*p < 0.05) and between prepulse level (db; p < 0.0001, both lines). E, G, Discrimination ratio displayed by NRG1-IV/NSE-tTA mice during the 5 min test phase (sample 3) of the temporal order object recognition task (**p < 0.001 by Student's t test; n = 15 WT and n = 12 NRG1-IV; founder line #6 and *p = 0.003, n = 7 WT and n = 14 NRG1-IV; founder line #13). F, H, Total time spent exploring the objects presented during the 5 min sample phases 1, 2, and 3. I, Discrimination ratio during the 5 min test trial of the novel object recognition task (n = 6 WT and n = 6 NRG1-IV; founder line #6). J, Time spent exploring the 2 objects during the 10 min acquisition session and the 5 min test session of the novel object recognition test. K, Discrimination ratio during the 5 min test trial of the object location task (**p < 0.01; n = 9 WT and n = 8 NRG1-IV; founder line #6). L, Time spent exploring the 2 objects during the 10 min acquisition and the 5 min test session of the same object location test. M, N, Normal cued and contextual fear conditioning in NRG1-IV/NSE-tTA (founder line #6 mice). M, Freezing behavior prior to (baseline), subsequent to (posttraining), and 24 h after (context 24 h) the cue–hock pairings. Both genotypes increased freezing subsequent to the CS–US pairings and the genotypes did not differ during the testing of contextual conditioning. N, Freezing behavior during testing for cued conditioning in the altered context without (CS off) and plus the auditory cue (CS on) displayed by WT and NRG1-IV littermates. GLM ANOVA showed that both genotypes increased their freezing behavior during the cue presentation. There was no effect of genotype on freezing either during the cue off or cue on phases of the experiment and there was no significant interaction between genotype and state of the cue (n = 13 WT and n = 13 NRG1-IV; ***p < 0.0001 CS off vs CS on for both genotypes). Data are shown as means ± SEM.
- Figure 3.
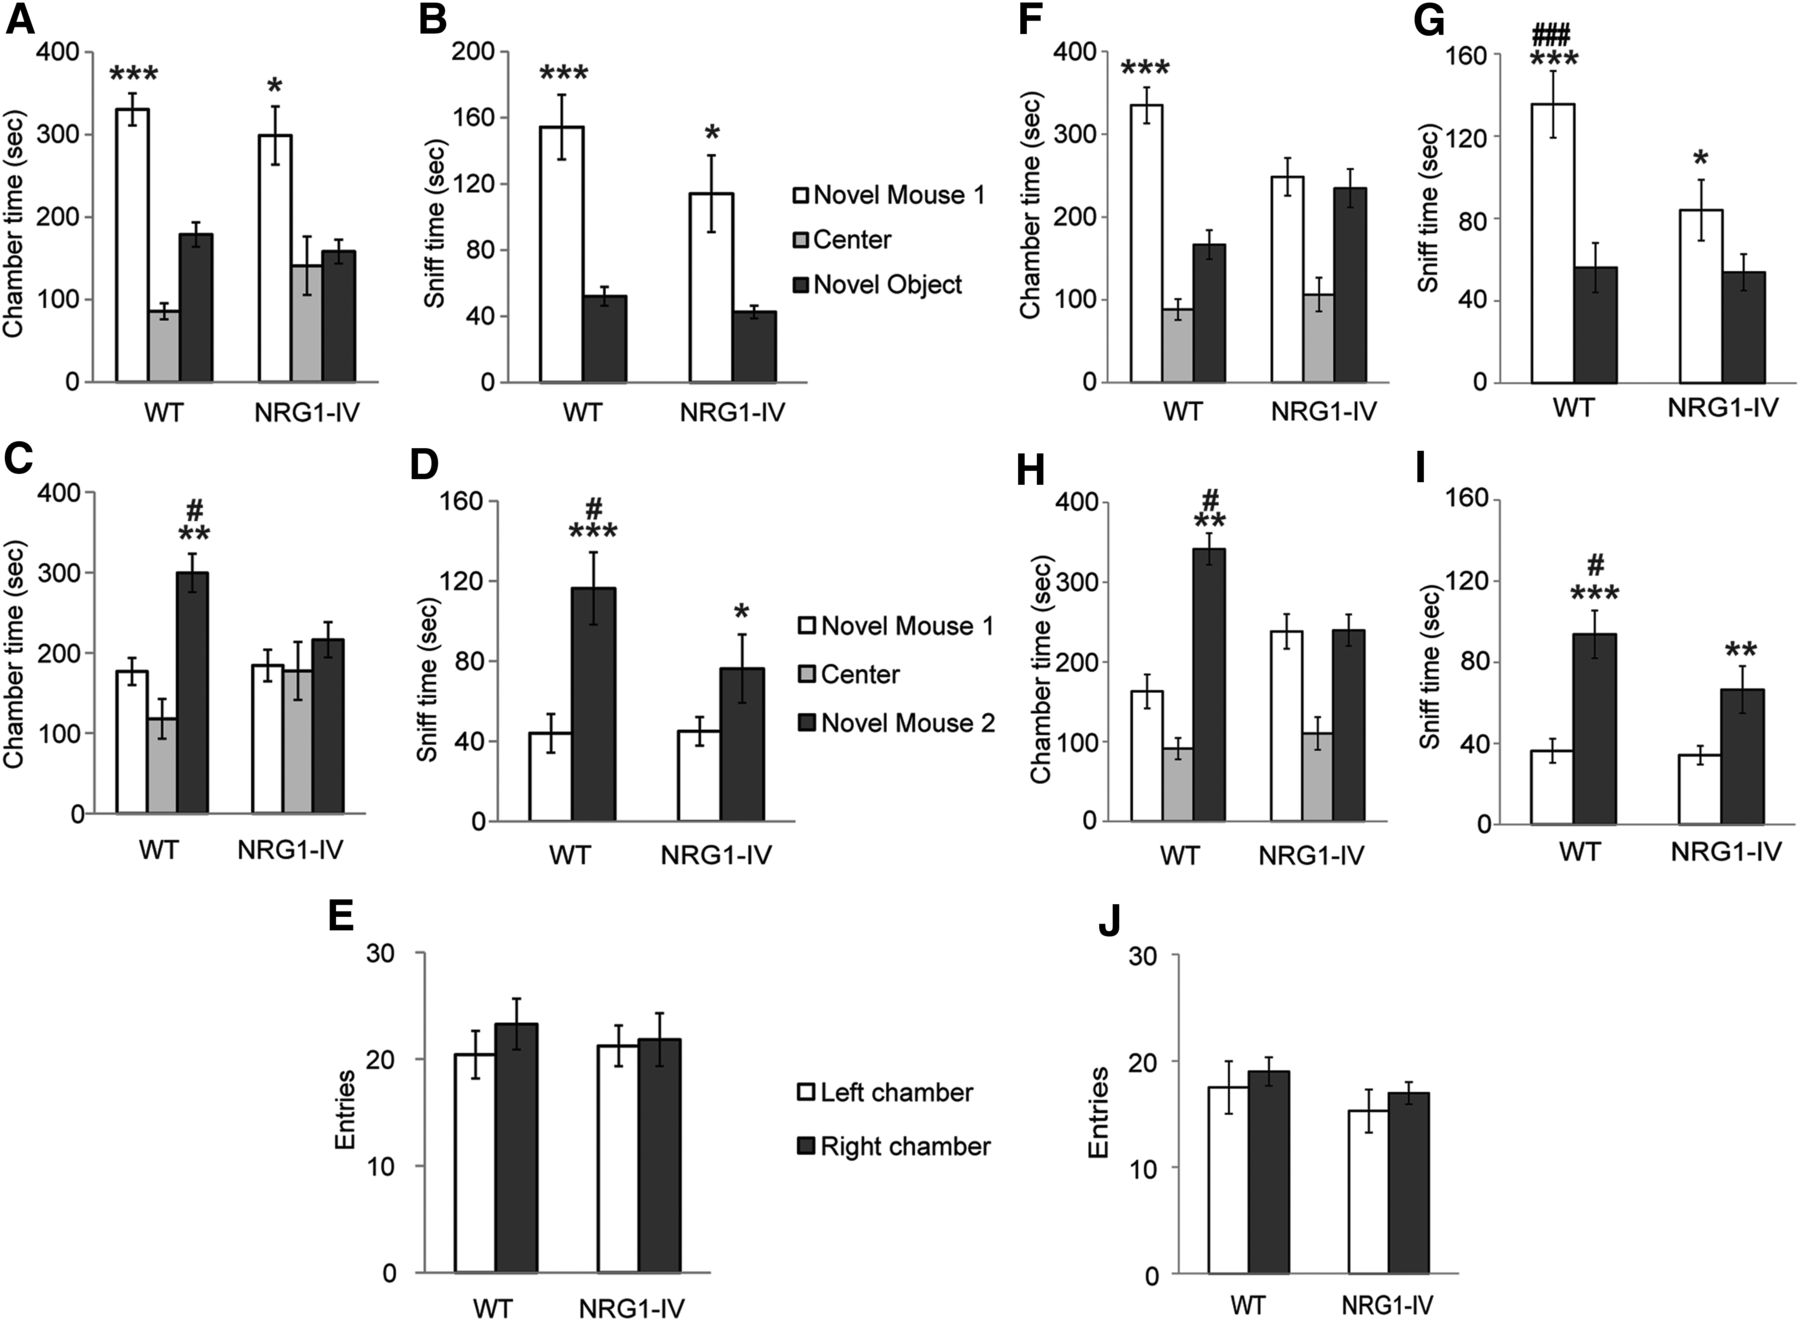
Impaired social interaction in NRG1-IV/NSE tTA mice. A, Time spent in the chamber with the novel mouse, in the chamber with the novel object, and in the empty center during the sociability test (founder line #6). Variances were significantly different between chambers (p < 0.05). Effect significant in both WT (***p < 0.0005) and NRG1-IV/NSE-tTA (*p < 0.01) mice. B, Time spent sniffing the novel mouse during the 10 min test for sociability was greater than time spent sniffing the novel object for both WT (***p < 0.0001) and NRG1-IV/NSE-tTA (*p < 0.01) mice. C, Time spent in the chamber with novel mouse 1, in the side chamber with the novel mouse 2, and in the center during the social novelty test. A significant genotype × chamber interaction was observed (p < 0.05). WT mice demonstrated a preference for the chamber containing the novel rather than the familiar mouse (**p < 0.005); absence of preference was observed in NRG1-IV/NSE-tTA mice. D, Similarly, a significant genotype × sniffing time interaction was observed (p < 0.05) in which WT mice spent more time sniffing the novel mouse 2 (***p < 0.0005), which was impaired in NRG1-IV/NSE-tTA mice (*p < 0.05). GLM RM-ANOVA and post hoc LSD #p < 0.05 versus the same measure in NRG1-IV/NSE tTA mice. E, Entries into the left and right side chambers (n = 14 WT and n = 12 NRG1-IV). F, Time spent in the chamber during the sociability test (founder line #13). A genotype × time spent in the chambers interaction was observed (p < 0.01). WT mice spent more time in the chamber with the novel mouse than in the chamber with the novel object (***p < 0.0008), whereas NRG1-IV/NSE-tTA mice showed no preference (p = 0.74). G, Time spent sniffing each wire cage during the 10 min test for sociability. A genotype × sniff time interaction was observed (p < 0.05). Time spent sniffing the novel mouse was greater than time spent sniffing the novel object for WT (***p < 0.0001) and marginally for NRG1-IV/NSE-tTA mice (*p < 0.05). However, WT mice spent more time sniffing the novel mouse compared with NRG1-IV/NSE-tTA mice (###p < 0.0005). H, Time spent in the chambers during the social novelty test (founder line #13). A genotype × chamber time interaction was observed (**p < 0.005). WT mice spent more time in the chamber with the newly introduced novel mouse 2 than in the chamber containing the novel mouse 1 (**p < 0.005). NRG1-IV/NSE-tTA mice failed to discriminate (p = 0.96). I, Time spent sniffing each wire cage during the 10 min test for preference for social novelty. Variances were significantly different between chambers (p < 0.05). More time sniffing the newly introduced novel mouse 2 than the novel mouse 1 was seen in WT (***p < 0.0005) and in NRG1-IV/NSE-tTA littermates (**p < 0.005). WT mice spent more time sniffing the newly introduced novel mouse 2 compared with NRG1-IV/NSE-tTA littermates (#p < 0.05). J, Number of entries into the side chambers displayed during the acclimatization phase did not differ between genotype. For F–J, n = 12 WT and n = 21 NRG1-IV. All analyses were by GLM RM-ANOVA. Data are shown as means ± SEM.
- Figure 4.
Decreased glutamatergic transmission and increased LTS interneuron excitability in layer V mPFC in NRG1-IV/NSE tTA mice. A, Sample traces and quantification of mEPSCs recorded from layer V pyramidal neurons from WT and NRG1-IV/NSE tTA mice. (n = 4 WT mice, 12 slices, 20 cells and n = 4 NRG1-IV mice, 12 slices, 19 cells). Means were significantly different between genotypes (**p = 0.0029) by unpaired Student's t test. B, Sample traces and quantification of mIPSCs recorded from layer V pyramidal neurons of mPFC in NRG1-IV/NSE tTA mice (n = 3 WT mice, 10 slices, 16 cells and n = 4 NRG1-IV mice, 11 slices, 18 cells). C–F, Repetitive firings were evoked by various depolarizing steps and action potential numbers were plotted against the depolarizing currents injected into neurons in layer V of mPFC. Representative traces are shown on the left and quantifications on the right. C, Pyramidal neuron excitability (n = 4 WT mice, 11 slices, 11 cells and n = 4 NRG1-IV mice, 12 slices, 12 cells). D, LTS neuron excitability. LTS interneurons were characterized by a short burst in the first 2–3 spikes, wider half-width, and smaller fAHP of action potentials with very high input resistances. (n = 4 WT mice, 11 slices, 11 cells and n = 4 NRG1-IV mice, 11 slices, 12 cells). Means were significantly different between genotypes (*p = 0.04), by unpaired Student's t test. E, RS interneuron excitability (n = 3 WT mice, 5 slices, 5 cells and n = 3 NRG1-IV mice, 9 slices, 9 cells). F, FS interneuron excitability (n = 3 WT mice, 8 slices, 8 cells and n = 4 NRG1-IV mice, 12 slices, 12 cells). Normal basal transmission and LTP of the hippocampus in adult NRG1-IV/NSE-tTA mice. G, H, NRG1-IV/NSE-tTA mice display normal LTP. Example fEPSP recordings before (black lines) and 60 min after LTP induction (red lines) are shown in G and the complete time courses are shown in I. Normal paired pulse facilitation (PPF). The ratios of the second and first EPSP slopes were calculated and mean values are plotted against different interpulse intervals (IPIs, 12.5–1600 ms). J, Normal basal synaptic transmission in NRG1-IV/NSE-tTA mice. Input–output curves were generated by plotting the postsynaptic response (amplitude of fEPSP) as a function of the stimulation intensity. Data are shown as means ± SEM.
- Figure 5.
Spontaneous excitatory input to pyramidal neurons and interneurons in layer V of mPFC. Whole-cell, voltage-clamp recordings were performed to record sEPSCs at −70 mV of holding potential in pyramidal neurons (A, B; n = 4 WT, 11 slices, 11 cells; NRG1-IV; n = 4, 12 slices, 12 cells); LTS interneurons (C; n = 4 WT, 10 slices, 10 cells; NRG1-IV, n = 4, 11 slices, 11 cells; RS interneurons (D; n = 3 WT, 9 slices, 9 cells; NRG1-IV, n = 3, 9 slices, 9 cells; and FS interneurons (E; n = 3 WT, 8 slices, 8 cells; NRG1-IV, n = 4, 10 slices, 10 cells). *p < 0.05; #p = 0.06 by unpaired Student's t test. Data are shown as means ± SEM.
- Figure 6.
NRG1-IV affects neuronal morphology and dendritic spine development ex vivo. A, Representative images of GFP-stained hippocampal neurons of E18, WT and NRG1-IV/NSE tTA mice at DIV 10. Scale bar, 50 μm. B, Representative images of 63× magnification confocal images of dendritic segments from GFP-stained hippocampal neurons. Scale bar, 5 μm. C, Primary dendrite number in hippocampal neurons cultured from NRG1-IV/NSE tTA embryos (***p < 0.001 by unpaired Student's t test; n = 33 neurons/genotype). D, Primary and secondary dendrite length (n = 33 neurons/genotype). Variances were significantly different between genotypes, with NRG1-IV increasing primary dendrite length and decreasing secondary dendrite length (*p < 0.05 by unpaired Student's t test). E, Sholl analysis of the number of intersections at radii of 5 μm intervals from the cell soma. NRG1-IV/NSE tTA neurons show an increased number of intersections at ranges close to the cell soma (*p < 0.05, 20–30 μm), but a reduced number of intersections at ranges distal to the soma (*p < 0.05, 135–140 μm; n = 33 neurons/genotype). F, Spine density on secondary dendrites from DIV 20 hippocampal neurons is decreased in NRG1-IV/NSE tTA mice (*p < 0.05, unpaired Student's t test; n = 33 dendritic segments per genotype). G, Filipodia, mushroom, and stubby spine subtype densities (n = 33 dendritic segments per genotype). Variances were significantly different between genotypes (*p < 0.05). Analysis by GLM ANOVA with post hoc LSD. H–J, Axonal length and soma size were not affected by genotype. Data are shown as means ± SEM.
- Figure 7.
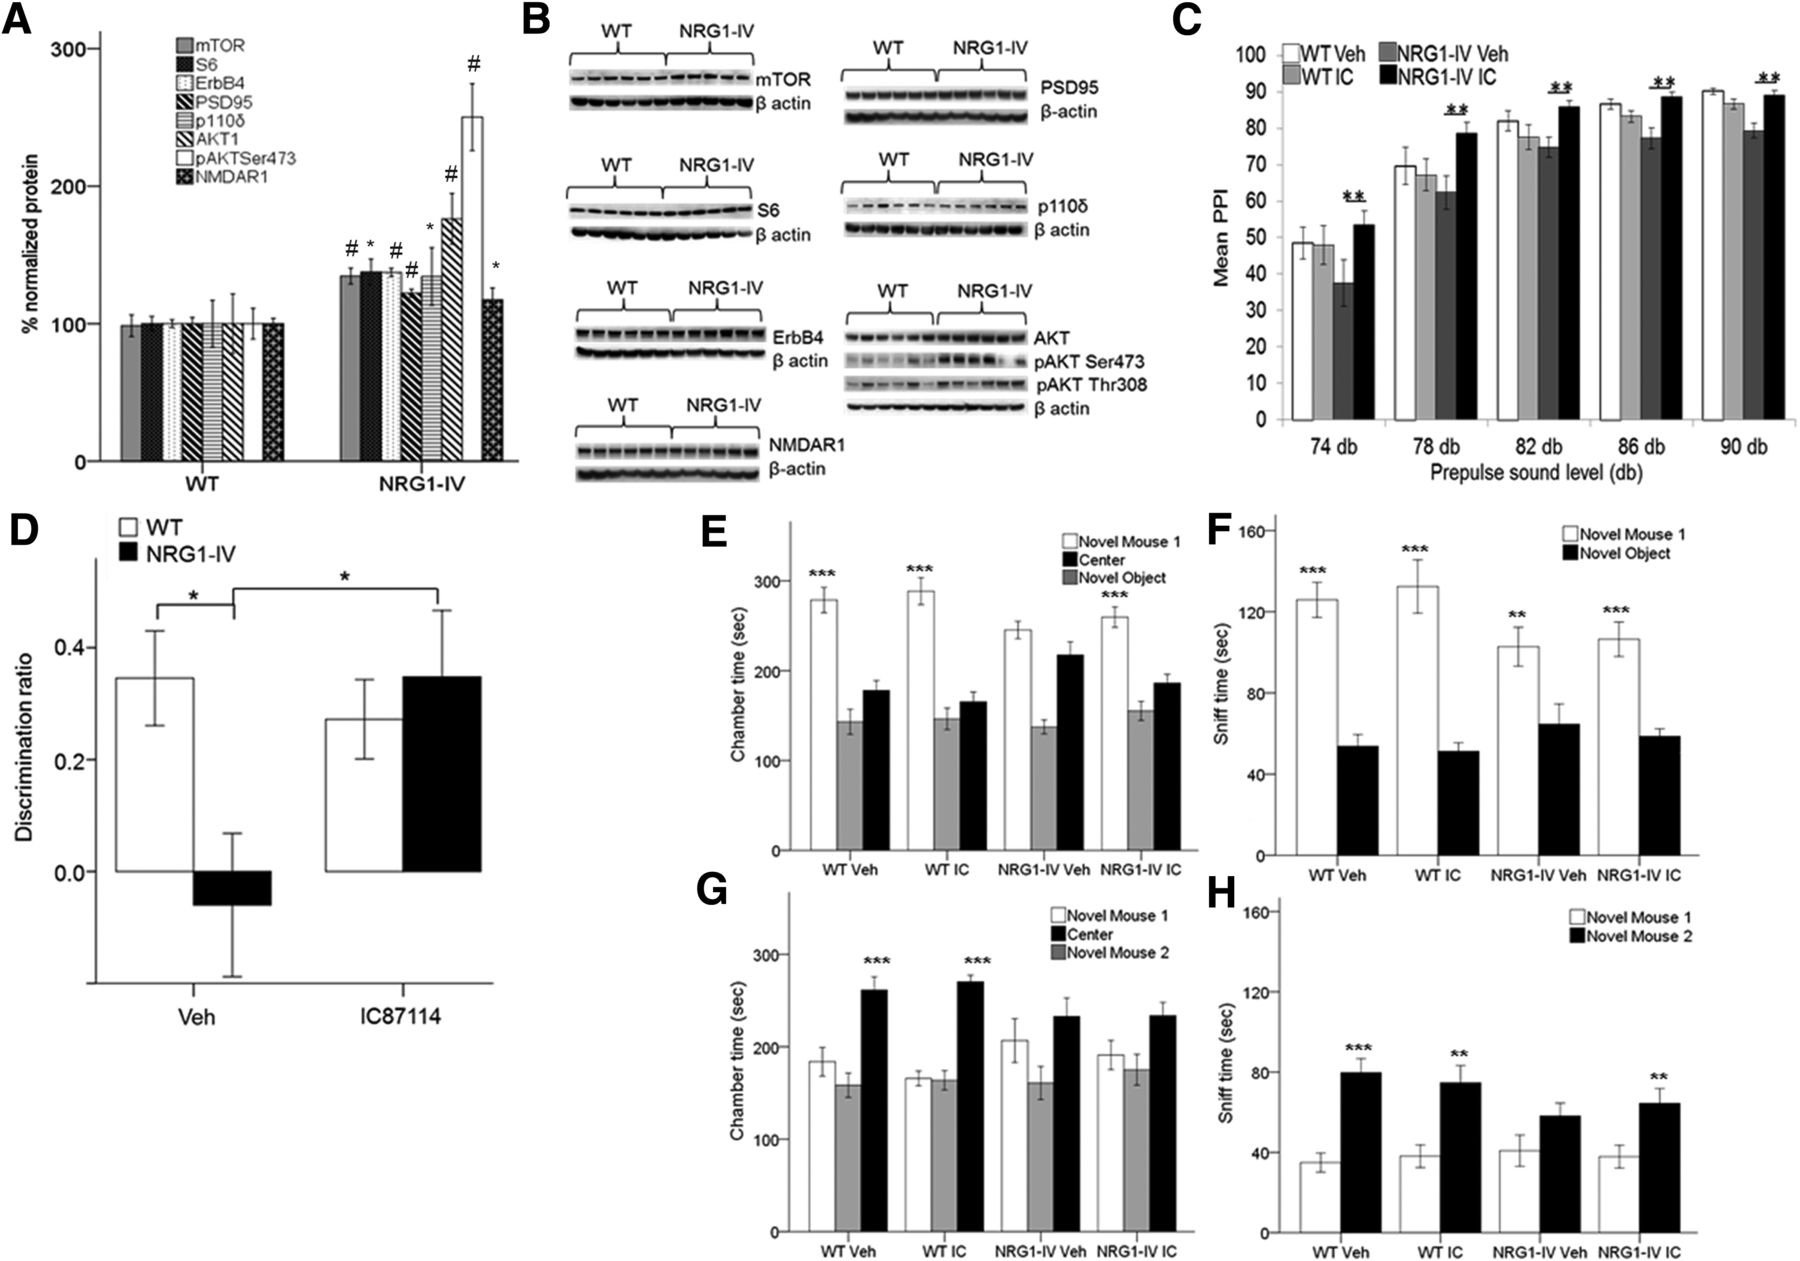
Preclinical relevance of PIK3CD signaling and pharmacological inhibition in NRG1-IV/NSE tTA mice. A, ErbB4, p110δ, and related NRG1 signaling proteins are increased in the mPFC of NRG1-IV/NSE tTA mice (*p < 0.05; #p < 0.01, unpaired Student's t test; n = 6 WT and n = 5–6 NRG1-IV). B, Western blots. C, Reversal of PPI deficits in NRG1-IV/NSE tTA mice with the PIK3CD inhibitor, IC87114 (n = 13 WT veh, n = 11 WT IC, n = 11 NRG1-IV veh, and n = 11 NRG1-IV IC). There was a significant interaction between genotype and drug treatment: (p = 0.002) and a main effect of genotype (p = 0.027, GLM MANOVA). IC87114 treatment rescued NRG1-IV-dependent PPI deficits, significantly improving PPI in drug-treated NRG1-IV/NSE-tTA mice compared with vehicle-treated transgenic mice (db74-db90; **p < 0.005; by post hoc LSD). No significant effect of drug on PPI was observed in WT mice. D, Intraperitoneal administration of IC87114 (0.1 mg/kg) 30 min before the test phase of the temporal order object recognition task (n = 13 WT veh, n = 10 WT IC, n = 6 NRG1-IV veh, and n = 9 NRG1-IV IC). There was a significant interaction between genotype and drug treatment (p = 0.02). IC87114 treatment rescued temporal order discrimination deficits found in NRG1-IV/NSE-tTA mice (*p < 0.05). No effect of drug was evident in WT mice (p > 0.5). Again, a significant effect of genotype was confirmed on recency discrimination memory in vehicle-treated mice (*p < 0.05). E–H, No significant effect of IC87114 treatment in NRG1-IV/NSE-tTA mice was observed in tests of sociability or social novelty. For each measure, a significant main effect of chamber was confirmed by GLM RM-ANOVA: E, F(1,54) = 55.861, p < 0.001; F, F(1,54) = 111.992, p < 0.001; G, F(1,54) = 20.179, p < 0.001; H, F(1,54) = 79.834, p < 0.001. No main effect of treatment or treatment × genotype interactions was observed (WT Veh, n = 16; WT IC n = 14; NRG1-IV Veh, n = 14; NRG1-IV IC, n = 14). Post hoc LSD comparisons revealed that variances were significantly different between chambers (novel mouse vs novel object; E, F) and (novel mouse 1 vs novel mouse 2; G, H). **p < 0.01; ***p < 0.001. Data are shown as means ± SEM.


Tables
- Table 1.
Physical characteristics, motoric abilities, sensory reflexes, and empty cage behavior displayed by founder line #6 mice
General health WT NRG1-IV/NSE-tTA Body weight (g) 31.7 ± 1.1 30.9 ± 0.5 Poor coat condition (%) 0 0 Bald patches (%) 8 0 Missing whiskers (%) 0 7 Piloerection (%) 0 0 Body tone (% of good) 100 100 Limb tone (% of good) 100 100 Physical abnormalities (%) 0 0 Motoric abilities Trunk curl (%) 100 100 Forepaw reaching (%) 100 100 Wire hang (s) 56.4 ± 2.5 55.4 ± 2.8 Positional passivity (%) 0 14 Reflexes (% of mice normal) Righting reflex (%) 100 100 Corneal (%) 100 100 Ear twitch (%) 100 100 Whisker twitch (%) 100 100 Reactivity to handling (3-point scale) 2.0 ± 0.0 2.0 ± 0.0 Petting escape (%) 42 29 Empty cage behavior Transfer freezing (%) 0 0 Wild running (%) 0 0 Exploration (3-point scale) 2.0 ± 0.0 2.0 ± 0.0 Grooming (s) 1.5 ± 0.5 2.5 ± 0.7 Grooming (no. of events) 0.7 ± 0.2 0.9 ± 0.3 Rearing (no. of events) 20.4 ± 1.6 20.1 ± 1.7 Digging (no. of events) 12.9 ± 1.8 11.7 ± 2.3 NRG1-IV/NSE-tTA mice were indistinguishable from their control littermates on all general health parameters measured. All p-values >0.27. Data are shown as means ± SEM or as percentages. n = 14 WT and n = 12 NRG1-IV. Similar findings were observed for founder line #13 mice (data not shown).


