

Article Figures & Data
Figures
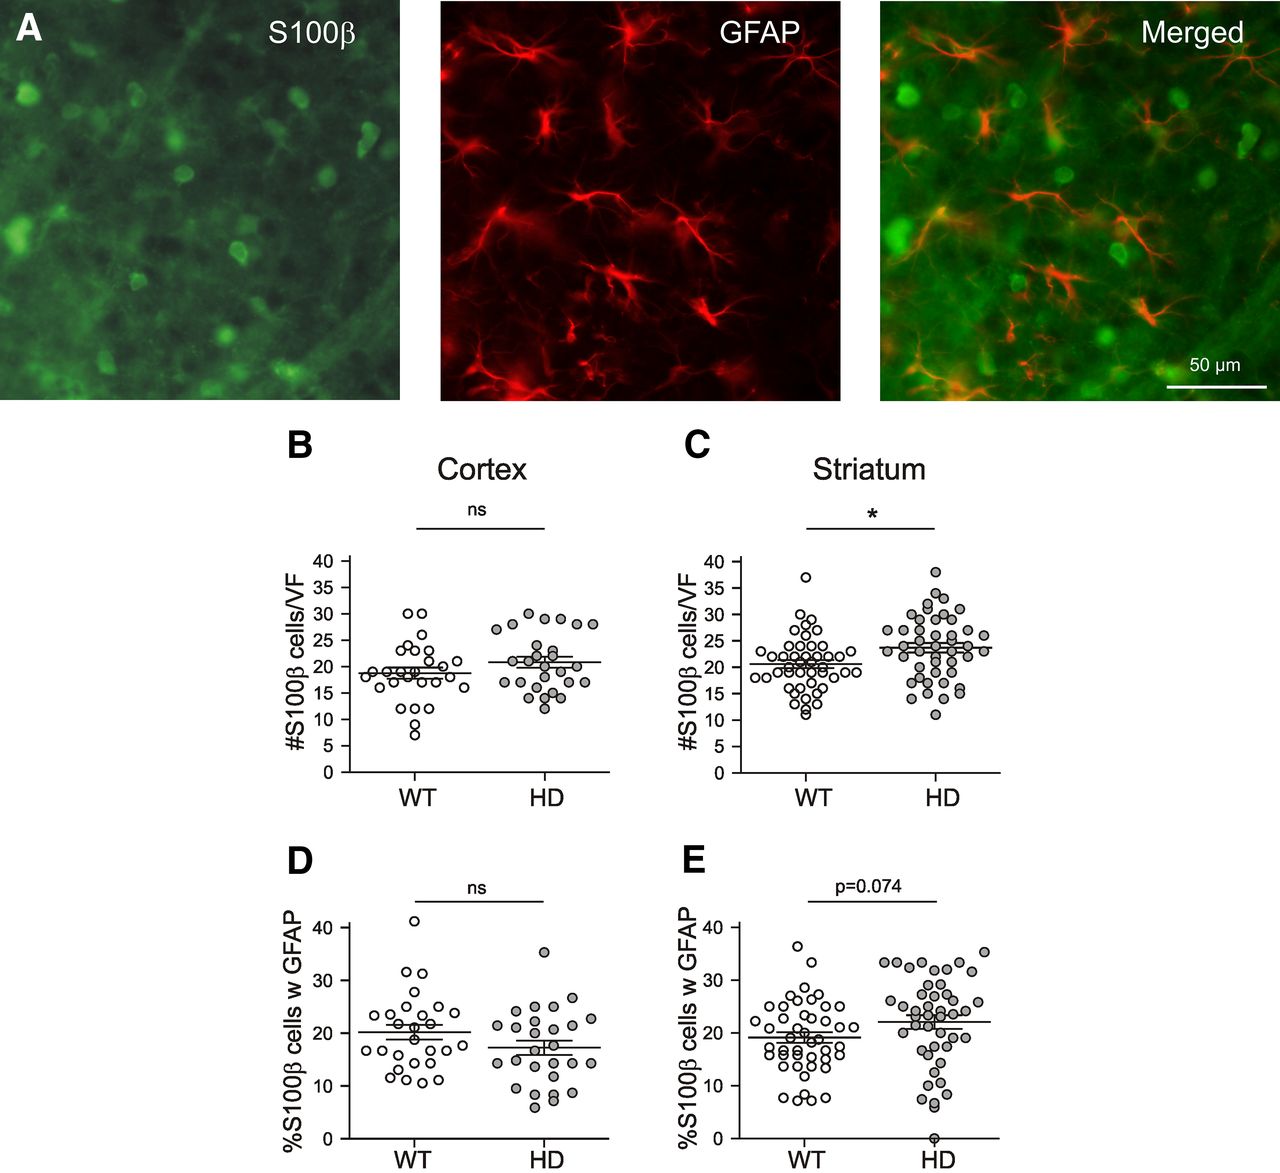
- Figure 1.
Mild astrogliosis in the HD striatum of Q175 homozygotes. A, Fluorescent images of a VF in the dorsal striatum of an HD mouse after double immunostaining for S100β and GFAP. B, C, Counts of S100β-positive cells. D, E, Percentage fraction of S100β-positive cell staining with GFAP immunoreactivity in the cortex (D) and striatum (E). Unpaired t tests.
- Figure 2.
Basic properties of SR101+ astrocytes in the striatum and effect of Ba2+. A, SR101+ astrocytes (bright spots) in 400-μm-thick slices at 20× magnification and conventional fluorescent optics. B, C, Results of astrocyte counts in vital slices and comparison of soma size. Evaluation at 40×; VF size, 200 × 200 μm. D, Resting membrane potential at break in. No added drugs. E, Same as in D but in the presence of Glu receptor blockers (CTRL) and after addition of Ba2+ 200 μm. F, Membrane resistance of SR101+ astrocytes in the absence of drugs. G, Same as in F but in the presence of Glu receptor blockers (CTRL) and after addition of Ba2+ 200 μm. Statistics: B, C, unpaired t test; D, F, MWT; E, two-way RM-stacked ANOVA. Genotype: F(1,74) = 7.761, p = 0.007. With or without Ba2+: F(1,74) = 430.4, p < 0.0001. Group comparison: Wilcoxon's matched-pairs signed-rank test. G, Two-way RM-stacked ANOVA. Genotype: F(1,23) = 0.18, p = 0.67. With or without Ba2+: F(1,23) = 45.17, p < 0.0001. Group comparison: Wilcoxon's test. Open circles, WT; gray circles, HD.
- Figure 3.
The intracellular sodium transient as an indicator of glutamate transport in SR101+ astrocyte from the WT and HD striatum. A, Fluorescent images from acute slices of WT to illustrate colocalization of SR101 and SBFI. B, In the experiments with l-Asp, the substrate for the glutamate transporter was delivered by bath application in the presence of DNQX (10 μm), APV (50 μm), LY341495 (40 μm), BMI (20 μm), and TTX (0.5 μm). dl-TBOA (100 μm) was added at the end of recordings to block the Asp- or glutamate-induced [Na+]i elevation. SBFI fluorescence was recorded from ROIs placed on the somata of individual cells, as marked by an arrowhead in A. The traces in B and the results in C were derived from symptomatic R6/2 WT and HETs. In these experiments, the Na response was defined on the basis of ΔR/r = 100% × (RAsp − RTBOA)/RTBOA), where r = F335/F385. The experiments with Q175 WT and HOMs were performed in similar ways, but for the construction of the graph, we determined r = F340/F380 and used the baseline before the Asp application. In E–G, the substrate for the glutamate transporter was delivered by photolytic uncaging of Rubi-glutamate (3 mm) with a laser intensity of 10 mW. The illuminated region comprised the soma and at least part of the dendritic field. Again, astrocytes were loaded with SBFI-AM. The SBFI fluorescence was acquired immediately after the 473 nm laser flash. F, The black traces (CTRL) were obtained in the presence of glutamate receptor blockers (DNQX at 10 μm and MK801 at 1 μm) and the gap junction blocker CBX (100 μm). Red trace, The same but in the presence of 200 μm Ba2+. For definition of ΔR/R, see Materials and Methods. The shaded interval comprises the first five data points after the flash from ROIs of 5 × 5 μm, as illustrated in E (yellow square). G, Quantification of results from photolytically applied glutamate shows significant differences between WT and HD mice. H, The experiments with Ba2+ revealed a significant Ba2+-mediated reduction of the glutamate-induced elevation of [Na+]i in WT but not HD mice. Statistics: paired t tests.
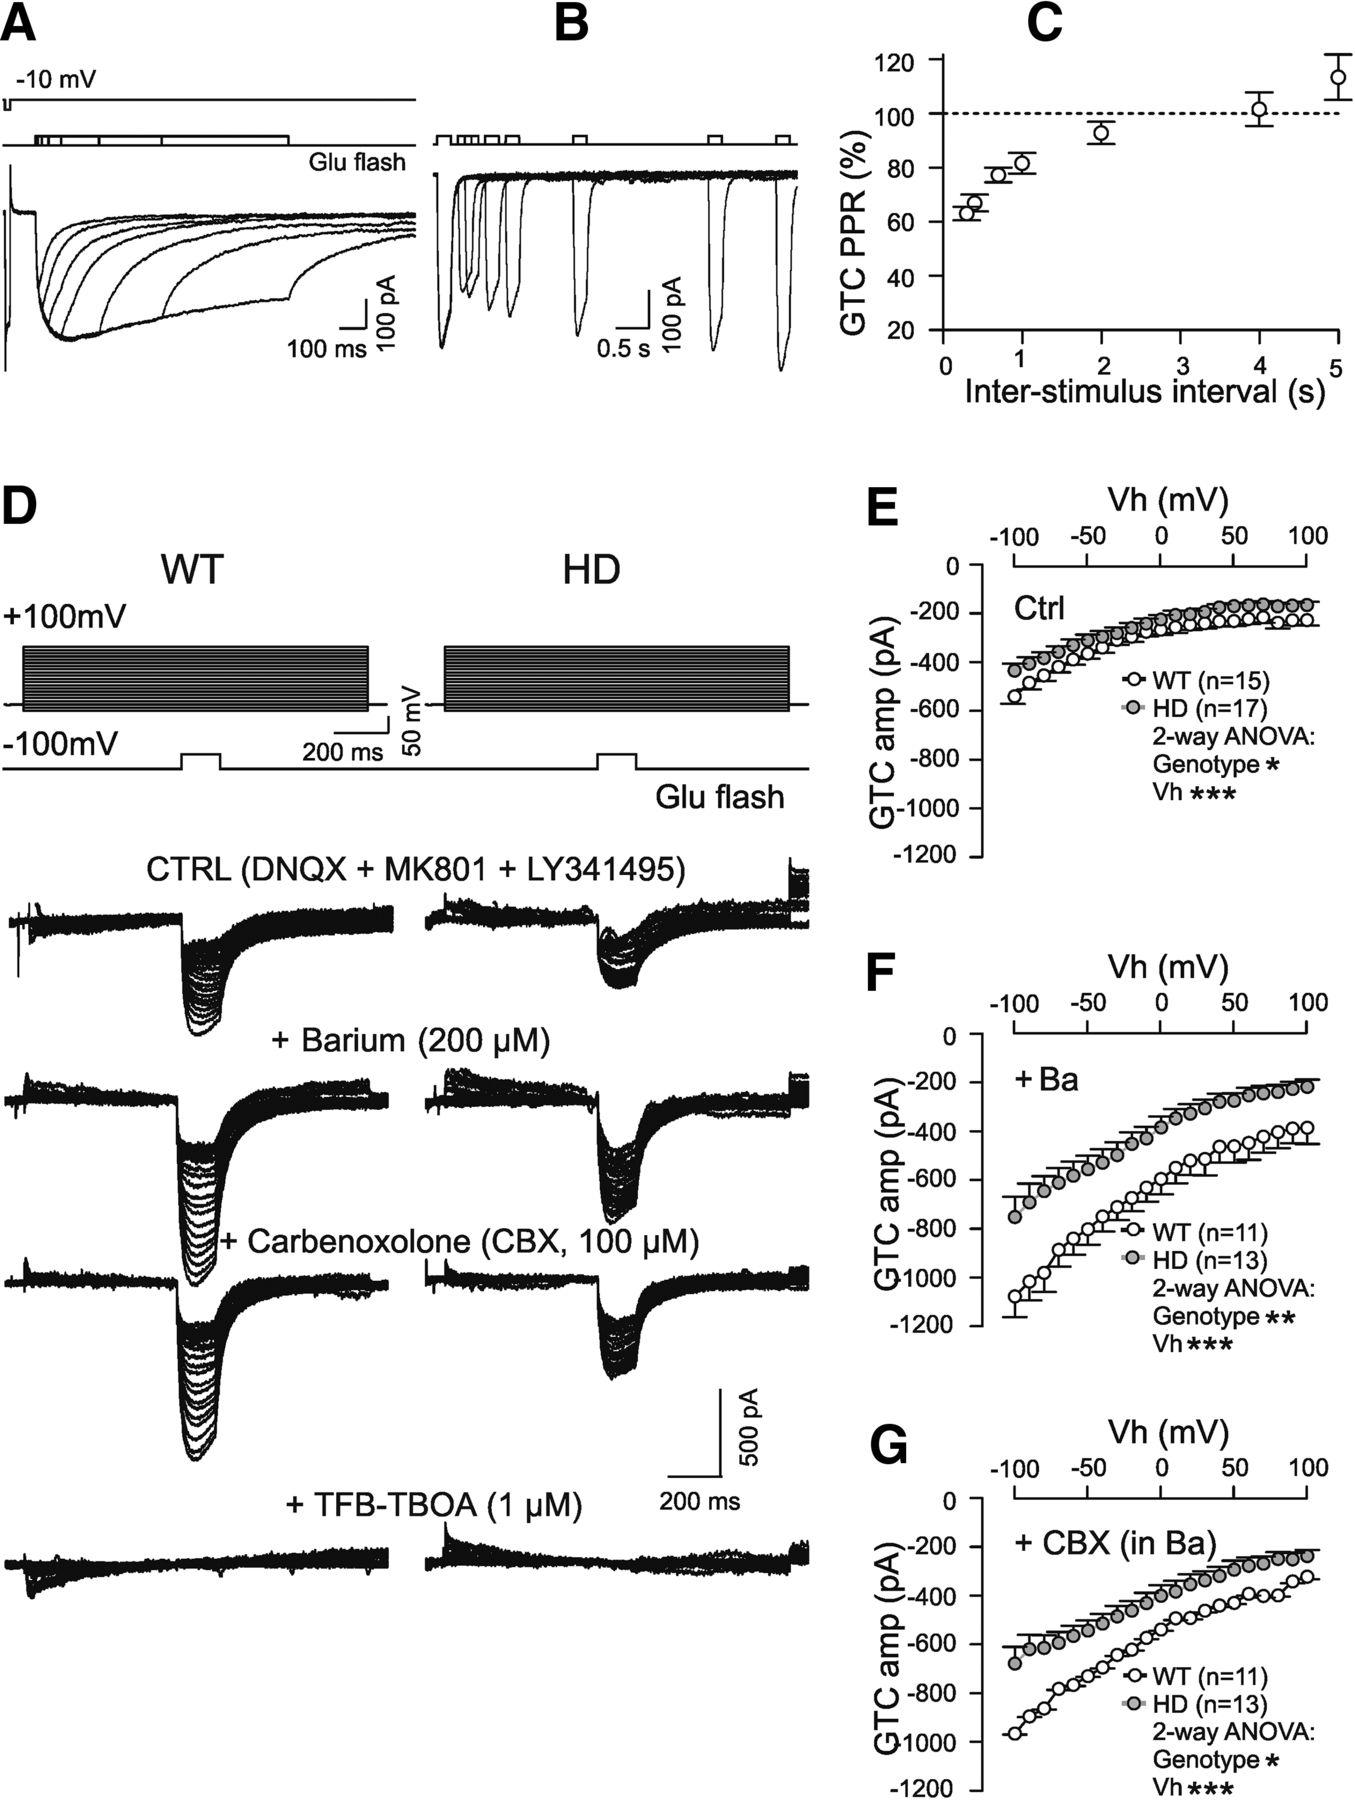
- Figure 4.
Astrocytic GTCs after photolytic uncaging of glutamate from Rubi-glutamate applied by local superfusion. A, Specimen traces of GTCs at Vh of −80 mV after photolytic uncaging of 1 mm Rubi-glutamate by 473 nm laser pulses of different duration. To reach their maximum, the GTCs required pulse durations between 100 and 250 ms. However, to obtain reasonable current amplitudes without toxic side effects of glutamate, impulse durations were limited to 100–200 ms. B, Interval-dependent paired pulse ratio (PPR) of GTCs in response to 200 ms pulses. C, Quantification of results from paired-pulse uncaging as shown in A and B. Stimulation with frequencies higher then 0.5/s induced depression. Therefore, in most of the following experiments, GTC activation frequency was set to 0.17/s (intervals of 6 s). D–G, I–V relationships of GTCs and effects of the Kir4.1 channel blocker Ba2+, the gap junction blocker CBX, and the blocking substrate TFB-TBOA. [Rubi-glutamate] of 1 mm, pulse duration of 100 ms, laser intensity of 10 mW. In view of the limited voltage control in astrocytes, the depolarization actually achieved by variation of Vh is likely to be underestimated. Note the strong potentiation of GTCs by Ba2+ and decrease by CBX in the presence of Ba2+. TFB-TBOA completely blocked the photolytically induced GTCs .The trace obtained in TFB-TBOA was used for subtraction. Statistics: two-way RM-stacked ANOVA. E, Genotype, F(1,30) = 4.79, p = 0.037; Vh, F(20,600) = 150.7, p < 0.0001. F, Genotype, F(1,22) = 9.64, p = 0.005; Vh, F(20,440) = 108.0, p < 0.0001. G, Genotype, F(1,14) = 4.72, p = 0.048; Vh, F(20,280) = 70.75, p < 0.0001.
- Figure 5.
HD-related deficiency of the Ba2+-sensitive voltage-activated conductance (presumably Kir4.1) and the Ba2+-induced enhancement of GTCs. Evidence for an effect of Ba2+ on the GTC charge transfer. Experiments with [Rubi-glutamate] 3 mm. A, B, Differential traces obtained by subtraction of control currents (in DNQX at 10 mm, MK801 at 1 mm, and LY341495 at 40 mm) and in the presence of additional Ba2+ (200 μm). Vh of −140 to +100 mV. A presents Ba2+-sensitive voltage-activated currents, and B shows the GTC gain in Ba2+. C, I–V plot of the Ba2+-sensitive VAC, presumably generated by Kir4.1 channels. Statistics: two-way RM-stacked ANOVA. Genotype, F(1,24) = 6.08, p = 0.02; Vh, F(12,288) = 52.3, p < 0.0001. Group differences (WT vs HD), unpaired t test. D, The effect of Ba2+-sensitive VACs at different holding voltages. Statistics: two-way RM-stacked ANOVA. Genotype, F(1,24) = 7.65, p = 0.011; Vh, F(12,288) = 98.9, p < 0.0001. Group differences, unpaired t test. E, Sample traces of somatic currents and potentials evoked by photolytic uncaging of 3 mm Rubi-glutamate in CTRL (black) and in 200 μm Ba2+ (red) at Vh of −60 mV. Records were obtained sequentially from the same WT astrocyte. F, Ba2+-induced increment of GTCs in dependence on the position of the photolytic spot. [Rubi-glutamate] at 1 mm, laser intensity of 3 mW. 0 μm refers to the center of the soma. In WT but not in HD, the Ba2+-mediated potentiation of somatically recorded GTCs increased with the distance of the photolytic glutamate spot.
- Figure 6.
Contrasting site dependency of exogenous glutamate effects on GLT1-related [Na+]i transients and somatic GTCs. Simultaneously recorded traces of [Na+]i transients and somatic GTCs of SBFI-loaded astrocytes. [Rubi-glutamate] at 3 mm, laser intensity of 10 mW, pulse duration of 100 ms, nominal Vh of 160 mV. Experiment in CBX at 100 μm, DNQX at 10 μm, MK801 at 1 μm. A, B, Data from 10 cells was pooled together and averaged for illustration purposes. C, Aligned traces of the Rubi-glutamate-induced somatic [Na+]i transients in response to glutamate application centered to the soma. D, E, Graphs showing the responses to increasingly excentric positions of the laser spot. Note that [Na+]i had its maximum at the proximal dendrites. The amplitudes of GTCs significantly decreased with increasing excentricity of the glutamate application. Statistics: two-way RM ANOVA for 10 matched pairs in CTRL and in Ba2+. D, With or without Ba2+, F(1,9) = 28.01, p < 0.0005; distance, F(3,27) = 18.45, p < 0.0001. E, With or without Ba2+, F(1,9) = 96.01, p < 0.0001; distance, F(3,27) = 30.24, p < 0.0001. F, Increase of the relative Ba2+ effect on GTCs elicited with glutamate spots at increasing excentricity. Mean values from 10 matched pairs. One-way RM ANOVA. Difference between distance groups: F(3,36) = 4.876, p < 0.01.
- Figure 7.
Dose–response curves for whole-cell GTCs. A, B, Sample traces of GTCs evoked by photolytic uncaging in control solution (CTRL, A) and Ba2+ (100 μm, B). Traces from HD mice are drawn with thinner lines. The current maxima obtained in WT versus HD with 3 mm Rubi-glutamate are indicated by horizontal lines. Experiments at Vh of −80 mV in MK801 (1 μm), DNQX (10 μm), LY341495 (20 μm), and CBX (100 μm). C, D, Dose–response curves for GTCs at Vh of −100 mV. The lines represent exponential fitting curves. The stars in B and C refer to the comparison of the mean values obtained in WT and HD at the given concentration. A significant difference between WT and HD is only seen at higher Rubi-glutamate concentration. The EC50 (calculated from the fitting curves in CTRL and Fig. 7). Dose–response curves for whole-cell GTCs. A, B, Sample traces of GTCs evoked by photolytic uncaging in control solution (CTRL, A) and Ba2+ (100 μm, B). Traces from HD mice are drawn with thinner lines. The current maxima obtained in WT versus HD with 3 mm Rubi-glutamate are indicated by horizontal lines. Experiments at Vh of −80 mV in MK801 (1 μm), DNQX (10 μm), LY341495 (20 μm), and CBX (100 μm). C, D, Dose–response curves for GTCs at Vh of −100 mV. The lines represent exponential fitting curves. The stars in B and C refer to the comparison of the mean values obtained in WT and HD at the given concentration. A significant difference between WT and HD is only seen at higher Rubi-glutamate concentration. The EC50 (calculated from the fitting curves in CTRL and Ba2+) did not differ, but there was a significant HD-related deficit in the calculated response maximum. Statistics: two-way ordinary ANOVA. C, Genotype, F(1,93) = 6, p = 0.02; [Rubi-glutamate], F(3,93) = 147.9, p < 0.0001; interaction, p = 0.019. The genotype-related difference within groups (same [Rubi-glutamate]) was tested with unpaired t tests. Comparison of fit parameters with extra sum-of-squares F test: maximum, F(1,97) = 6.37, p = 0.013; EC50, F(1,97) = 0.59, p = 0.45. D, Genotype, F(1,69) = 19.65, p < 0.001; [Rubi-glutamate], F(3,69) = 194.4, p < 0.0001; interaction, p < 0.001. The genotype-related difference within groups (same [Rubi-glutamate]) was tested with unpaired t tests. Comparison of fit parameters with extra sum-of-squares F test: maximum, F(1,73) = 6.1, p = 0.016; EC50, F(1,73) = 0.12, p = 0.73. The total number of tested astrocytes is given in parentheses above and below the fitting curves. Note different scaling of y-axes in C and D. E, F, Maximal GTC values calculated for different levels of Vh. The mean values of GTC (maximum) in WT and HD are different in CTRL (D) and Ba2+ (E). Statistics: two-way ordinary ANOVA. (E, genotype) - F (1, 2079) = 63.9, p < 0.001. (E, Vh) - F (20, 2079) = 56.4, p < 0.001. F, Genotype, F(1,1575) = 84.2, p < 0.001; Vh, F(20,1575) = 63.8, p < 0.001; interaction, NS. Differences between groups, F test. The difference between WT and HD does not depend on Vh (no interaction).
- Figure 8.
HD-related slowing of glutamate uptake activity in astrocytes. A, Traces of GTCs elicited by whole-cell uncaging of Rubi-glutamate. Records under control conditions and in the presence of 200 μm Ba2+. Vh range: 0–160 mV. [Rubi-glutamate] at 3 mm. B, Amplitude-scaled traces for comparison of GTC decay in HD and WT mice under control conditions (black, gray) and in the presence of 200 μm Ba2+ (red, orange). C, Time constants of GTC decay in 200 μm Ba2+ at different Vh. Note genotype-related difference in the GTC decay kinetics under condition of Kir4.1 block. Statistics: two-way RM-stacked ANOVA. Genotype, F(1,24) = 12.53, p = 0.0017; Vh, F(8,192) = 0.53, p = 0.83; comparison within groups, unpaired t test. D, GTC centroid values in 200 μm Ba2+ at different Vh. Statistics: two-way RM-stacked ANOVA. Genotype, F(1,24) = 6.06, p = 0.02; Vh, F(8,192) = 0.89, p = 0.53; comparison within groups, unpaired t test. E, Mean GTC centroid values for WT and HD at lower and higher concentrations of Rubi-glutamate. The slowing of glutamate uptake activity is significant at [Rubi-glutamate] at 3 mm. Data shown for Vh of −80 mV. Statistics: ordinary two-way ANOVA. Genotype, F(1,64) = 3.16, p = 0.08; [Rubi-glutamate], F(1,64) = 13.63, p = 0.0005; comparison within groups, unpaired t test.
- Figure 9.
Parallel recording of astrocytic and neuronal responses to electrical stimulation of the cerebral cortex. A, Experimental scheme and overlay image comprising an SR101+ astrocyte after injection of SBFI and an SPN filled with Alexa Fluor 488. Both cells were located at close distance (typically <50 μm between the soma centers) and characterized by parallel recording of whole-cell currents and, in some cases, [Na+]i transients (data not illustrated). Synaptic glutamate release was activated by stimulation of the motor cortex via a bipolar platinum–iridium electrode, tip distance of 250 μm, pulse duration of 20 μs. B, The sample records were performed at Vh of −80 mV (astrocyte) and −70 mV (neuron). The traces illustrate the effect of Ba2+ (200 μm) and TFB-TBOA (1 μm). The TFB-TBOA traces were used to calculate the GLT1-related GTCs in response to cortical stimulation at variable intensity. The EPSCs recorded from SPNs were used to normalize the corresponding astrocytic GTCs, because there was considerable site-dependent variability of synaptically evoked responses. The inset in B, shows the full trace of a synaptically induced GTC and illustrates the depressant effect of Ba2+ on the slow component of the complex astroglial current response observed after cortical stimulation. C, GTC traces of an SR101+ astrocyte (top) and an SPN (bottom). Responses to cortical stimulation at increasing current intensities. EPSCs were recorded in the presence of gabazine (20 μm) and LY341495 (40 μm). GTCs were acquired afterward, in the presence of MK801 (1 μm), DNQX (10 μm), and LY341495 (40 μm). The recording pipettes contained QX314 (500 μm). D–F, Quantification of results. Note significant HD-related differences in the GTCs normalized to the EPSC amplitudes. Statistics: two-way RM-stacked ANOVA. D, Genotype, F(1,19) = 2.98, p = 0.10; stimulation intensity, F(6,114) = 19.59, p < 0.0001. E, Genotype, F(1,32) = 0.099, p = 0.76; stimulation intensity, F(6,192) = 44.22, p < 0.0001. F, Genotype, F(1,17) = 12.62, p = 0.0025; stimulation intensity, F(6,102) = 0.48, p = 0.82.
- Figure 10.
HD-related differences in the EPSC kinetics and effects of Ba2+ on GISCs in WT SPNs. A, Scaled traces of EPSCs (average from 10) in response to electrical stimulation of the motor cortex. Conditions as in Figure 9. Records in the absence of NMDA receptor block. Note slower EPSC decay in HD mice. B, Quantification of half decay time of corticostriatal EPSCs. C, Single spines were visualized by filling SPNs with Alexa Fluor 568 hydrazide. For these experiments, we chose dendrites running in parallel with the slice surface. Appropriate spine images were obtained by deconvolution of z-stacks comprising 100 wide-field 63× images. D, Series of GISCs elicited by stimulating different spines, as indicated in C. The flash duration was adjusted to produce a response mimicking the amplitude of unitary EPSC in SPNs (Rothe et al., 2015). [Rubi-Glu] at 1 mm, pulse duration of 1 ms, laser intensity of 3 mW; presumed spot size, ∼1 μm. E, Specimen traces of a WT GISC in CTRL (black) and Ba (red). Right, Same but scaled to the current maximum. Experiment in the presence of CTZ (50 μm), after NMDA receptor block with MK101 (1 μm). F, G, Significant effects of Ba (200 μm) on the GISC time constants of decay (GISC Tau) and amplitudes in WT SPNs. Statistics: B, two-way RM-stacked ANOVA. Genotype, F(1,30) = 5.73, p = 0.023; stimulation intensity, F(6,180) = 3.75, p = 0.0015. F, G, Paired t tests.
- Figure 11.
Transduction of Kir4.1 in symptomatic Q175 homozygotes after intravenous injection of AAV9–Kir4.1–EGFP. A, Colocalization of the astrocyte marker S100β with Kir4.1–EGFP. Wide-field acquisition of fluorescent images at 40×. B, Percentage fraction of S100β+ cells expressing Kir4.1–EGFP in relation to the number of S100β+ cells expressing GFAP. In parentheses are shown the number of view fields. Data from three injected mice per condition. C, D, Traces of the Ba2+-sensitive component of voltage-activated currents, i.e., presumed Kir4.1 currents in astrocytes from nontreated (CTRL) and treated (AAV9–Kir4.1–EGFP) HD mice. Single sweeps. E, Voltage dependence of VACs obtained by calculating the difference between the control currents and the currents obtained in the presence of 200 μm Ba2+. Pipette solution: 50 mm KCl, 100 mm K gluconate, and EGTA 5 mm (for the full composition, see Materials and Methods). Statistics: two-way RM-stacked ANOVA. With and without AAV9–Kir4.1, F(1,42) = 5.427, p = 0.025; Vh, F(13,546) = 229.6, p < 0.0001. F, The values of Ba2+-sensitive currents apply to Vh of +100 mV. Statistics: KW test. KW value = 8.8, p = 0.012. G, H, AAV9–Kir4.1-induced recovery of the membrane potential and the values of Ba2+-sensitive Rm, respectively. Statistics: G, KW test. KW value = 42.8, p < 0.0001. Group comparison, MWT. H, One-way ANOVA. F(2,40) = 6.073, p = 0.005. Group comparison, unpaired t test. I, Quantification of results for GTCs. Note significant differences between treated (green) and nontreated (red) mice at membrane potentials >120 mV. Statistics: two-way RM-stacked ANOVA. With and without AAV9–Kir4.1, F(1,61) = 1.95, p = 0.170; Vh, F(8,488) = 84.7, p < 0.0001; interaction, F(8,488) = 3.82, p = 0.0002. Group comparison, unpaired t tests. K, Significant negative correlation between GTC amplitudes and amplitudes of Ba2+-sensitive VACs in a set of astrocytes pooled from treated and nontreated HD mice. Vh of 120 mV. L, Significant negative correlation between GTC amplitudes and the Ba2+-induced increase in input resistance. Vh of 120 mV. Symbols: open circles with bars, WT; red circles with bars, HD; green circles with bars, HD treated with intravenous injection of AAV9–Kir4.1.


Tables
Line Immunostained sections WT HD p Test % Difference Meaning n Mean ± SE n Mean ± SE n Motor cortex 1 #S100β/VFa 18.7 ± 1.1 27 20.8 ± 1.1 27 ns tt VFs 2 #S100β w GFAP/#S100β (%) 20.2 ± 1.4 27 17.2 ± 1.4 27 ns tt VFs Striatum 3 #S100β/VF 20.6 ± 0.8 45 23.7 ± 0.9 45 <0.05 tt +21 VFs 4 #S100β w GFAP/#S100β (%) 19.1 ± 1.0 45 22.1 ± 1.3 45 0.073 tt +16 VFs Vital sections 5 #SR101/VF 4.0 ± 0.2 136 4.8 ± 0.3 128 <0.05 MWT +20 VFs MWT, Mann–Whitney U test; tt, t test.
↵aVF size, 200 × 200 μm.
Line WT HD p Test % Difference Meaning n Mean ± SE n Mean ± SE n Astrocytes Basic properties 1 Membrane potential without drugs (mV) −80.7 ± 0.2 129 −77.5 ± 0.5 103 <0.0001 MWT −4 Cells 2 Membrane potential with GluR blockers (mV) −79.4 ± 0.5 140 −75.8 ± 0.6 122 <0.0001 MWT −5 Cells 3 Membrane potential with GluR blockers + Ba 200 μm (mV) −62.3 ± 1.5 30 −57.5 ± 1.4 46 <0.05 tt −8 Cells 4 Membrane resistance (Rm = RIn − Rs) without drugs (MΩ) 6.1 ± 0.4 55 7.2 ± 0.6 37 NS MWT Cells 5 Membrane resistance with GluR blockers + Ba 200 μm (MΩ) 9.1 ± 1.2 14 10.0 ± 2.4 17 NS MWT Cells 6 Ba-induced change of membrane resistance (% CTRL) 97.4 ± 13.3 14 43.6 ± 9.2 17 <0.01 tt −55 Cells [Na+]i transients MP free (SBFI-AM, Rubi-Glu 3 mm) 7 Asp-induced Na transient (% baseline) 1.92 ± 0.12 73 0.84 ± 0.05 34 <0.0001 MWT −56 Cells 8 Rubi-Glu-induced Na transient (% baseline) 1.39 ± 0.06 21 0.82 ± 0.07 28 <0.0001 tt −41 Cells 9 Ba-induced change of Rubi-Glu-induced Na transient (% CTRL) −14.9 ± 4.7 21 1.3 ± 9.4 28 NS tt Cells MP controlled (SBFI ic, Rubi-Glu 3 mm, focal stimulation of soma, Vh = −160 mV) 10 Rubi-Glu-induced Na transient (% baseline) 4.42 ± 0.32 16 3.32 ± 0.27 11 <0.05 tt −25 Cells 11 Ba-induced change of Rubi-Glu-induced Na transient (% CTRL) −35.3 ± 5.7 10 −30.7 ± 9.8 10 NS tt Cells Kir4.1-related VAC and GTCs at [Rubi-Glu] 3 mm and Vh of −100 12 Amplitude of Ba-sensitive VAC at 100 mV (pA) 1595 ± 189 21 793 ± 92 26 <0.001 MWT −50 Cells 13 Ba-induced GTC increment at Vh of −100 mV (pA) 675 ± 45 21 404 ± 38 26 <0.0001 tt −40 Cells 14 Calculated GTC maximum in Ba Vh of −100 mV (pA) 1959 ± 165 38 1432 ± 111 39 <0.05 F −27 Cells (pooled) 15 GTC centroid in Ba at Vh of −100 mV (ms) 299 ± 12 11 341 ± 12 25 <0.05 tt 12 Cells Neurons Synaptically induced GTC (cortical stimulation 1 mA) 16 Mean GTC amplitude (pA) 220 ± 42 18 217 ± 60 16 NS MWT Cells 17 GTC/EPSC ratio 0.13 ± 0.02 10 0.04 ± 0.01 10 <0.05 tt −69 Cells Corticostriatal EPSCs 18 Half decay time (ms) 3.58 ± 0.44 17 5.12 ± 0.33 14 <0.05 tt +43 Cells Glu-induced spine currents (GISCs, Rubi-Glu 1 mm) 19 Ba-induced change of GISC decay time constant (% CTRL) 52.5 ± 5.9 9 Cells Action potential-dependent sPSC frequency 20 Frequency TTX-sensitive sIPSCs (s) 0.39 ± 0.22 6 1.95 ± 0.41 3 <0.05 MWT Cells MWT, Mann–Whitney U test; tt, t test.
Line HD noninjected HD injected p Test % Change Meaning n Mean ± SE n Mean ± SE n Animals 1 Age at death (d) 362.9 ± 5.5 9 349.6 ± 2.9 10 NS tt Animals 2 Final body weight (g) 19.64 ± 0.33 9 20.22 ± 0.39 10 NS tt Animals 3 Number of CAG repeats 188.1 ± 1.8 9 186.6 ± 1.6 10 NS tt Animals Transduction yield (3 weeks) Motor cortex 4 #S100β with Kir4.1-EGFP/#S100β with GFAP (%) 87.7 ± 13.6 27 VFs Striatum 5 #S100β with Kir4.1-EGFP/#S100β with GFAP (%) 35.5 ± 4.7 45 VFs Astrocyte physiology Basic properties 6 Membrane potential at break in with GluR blockers (mV) −75.8 ± 0.6 122 −79.3 ± 0.4 38 <0.01 MWT +5 Cells 7 Ba-induced changed of Rm (% CTRL) 43.6 ± 9.2 17 76.4 ± 12.6 13 <0.05 tt +75 Cells Kir4.1-related VAC and GTCs in response to [Rubi-Glu] 3 mm 8 Ba-sensitive VAC at Vh of 100 mV (pA) 793 ± 92 26 1388 ± 130 15 <0.001 tt +75 Cells 9 GTC amplitude at Vh of −120 mV in CTRL (pA) 543 ± 20 30 447 ± 22 33 <0.05 tt −18 Cells 10 GTC amplitude at Vh of −120 mV in Ba (pA) 960 ± 61 19 732 ± 46 19 <0.01 tt −24 Cells Neuron physiology Basic properties of SPNs 11 Membrane potential at break in (mV) −73.1 ± 0.5 17 −74.2 ± 1.2 21 NS Cells 12 Input resistance (MΩ) 232.6 ± 13.2 17 269.5 ± 21.8 21 NS Cells 13 Rheobase (pA) 8.8 ± 0.5 11 7.25 ± 0.4 12 NS Cells 14 Maximal firing frequency (action potentials/s) 34.8 ± 1.6 11 36.5 ± 3.1 12 NS Cells Corticostriatal input to SPNs 15 Decay time constant of EPSCs 6.43 ± 0.31 4 4.63 ± 0.48 4 <0.05 MWT −28 Cells Spontaneous activity 16 Average frequency of action potential-dependent (TTX-sensitive) events (s) 1.85 ± 0.47 15 0.63 ± 0.10 21 <0.05 MWT −66 Cells MWT, Mann–Whitney U test; tt, t test.


