

Article Figures & Data
Figures
- Figure 1.
Age modulates the expression and phosphorylation profile of retinal tau. A, Representative Western blots of soluble retinal extracts from 2- and 8-month-old Brown Norway rats probed with an antibody against total tau (K9JA) demonstrated the presence of three predominant tau isoforms of 50, 55, and 100 kDa. B, Densitometric analysis showed a 1.7-fold and 2.8-fold increase in the 50 and 100 kDa tau variants, respectively, in samples from 8-month-old animals (N = 6) compared with younger animals (N = 3; Student's t test, *p < 0.05). C, D, All tau isoforms were observed in Tau+/+ mouse retinas (N = 3), whereas no signal was detected in Tau −/− murine retinal samples (N = 3), validating the specificity of the antibody. E–J, Analysis of phospho-specific tau epitopes demonstrated age-dependent changes in phosphorylation with PHF1 (Ser396, Ser404) and PS199 (Ser199), while no change was detected with AT8 (Ser202, Thr205; 8 month-old, N = 6; 2 month-old, N = 3; Student's t test, *p < 0.05). Vertical lines represent nonconsecutive samples from the same gel.
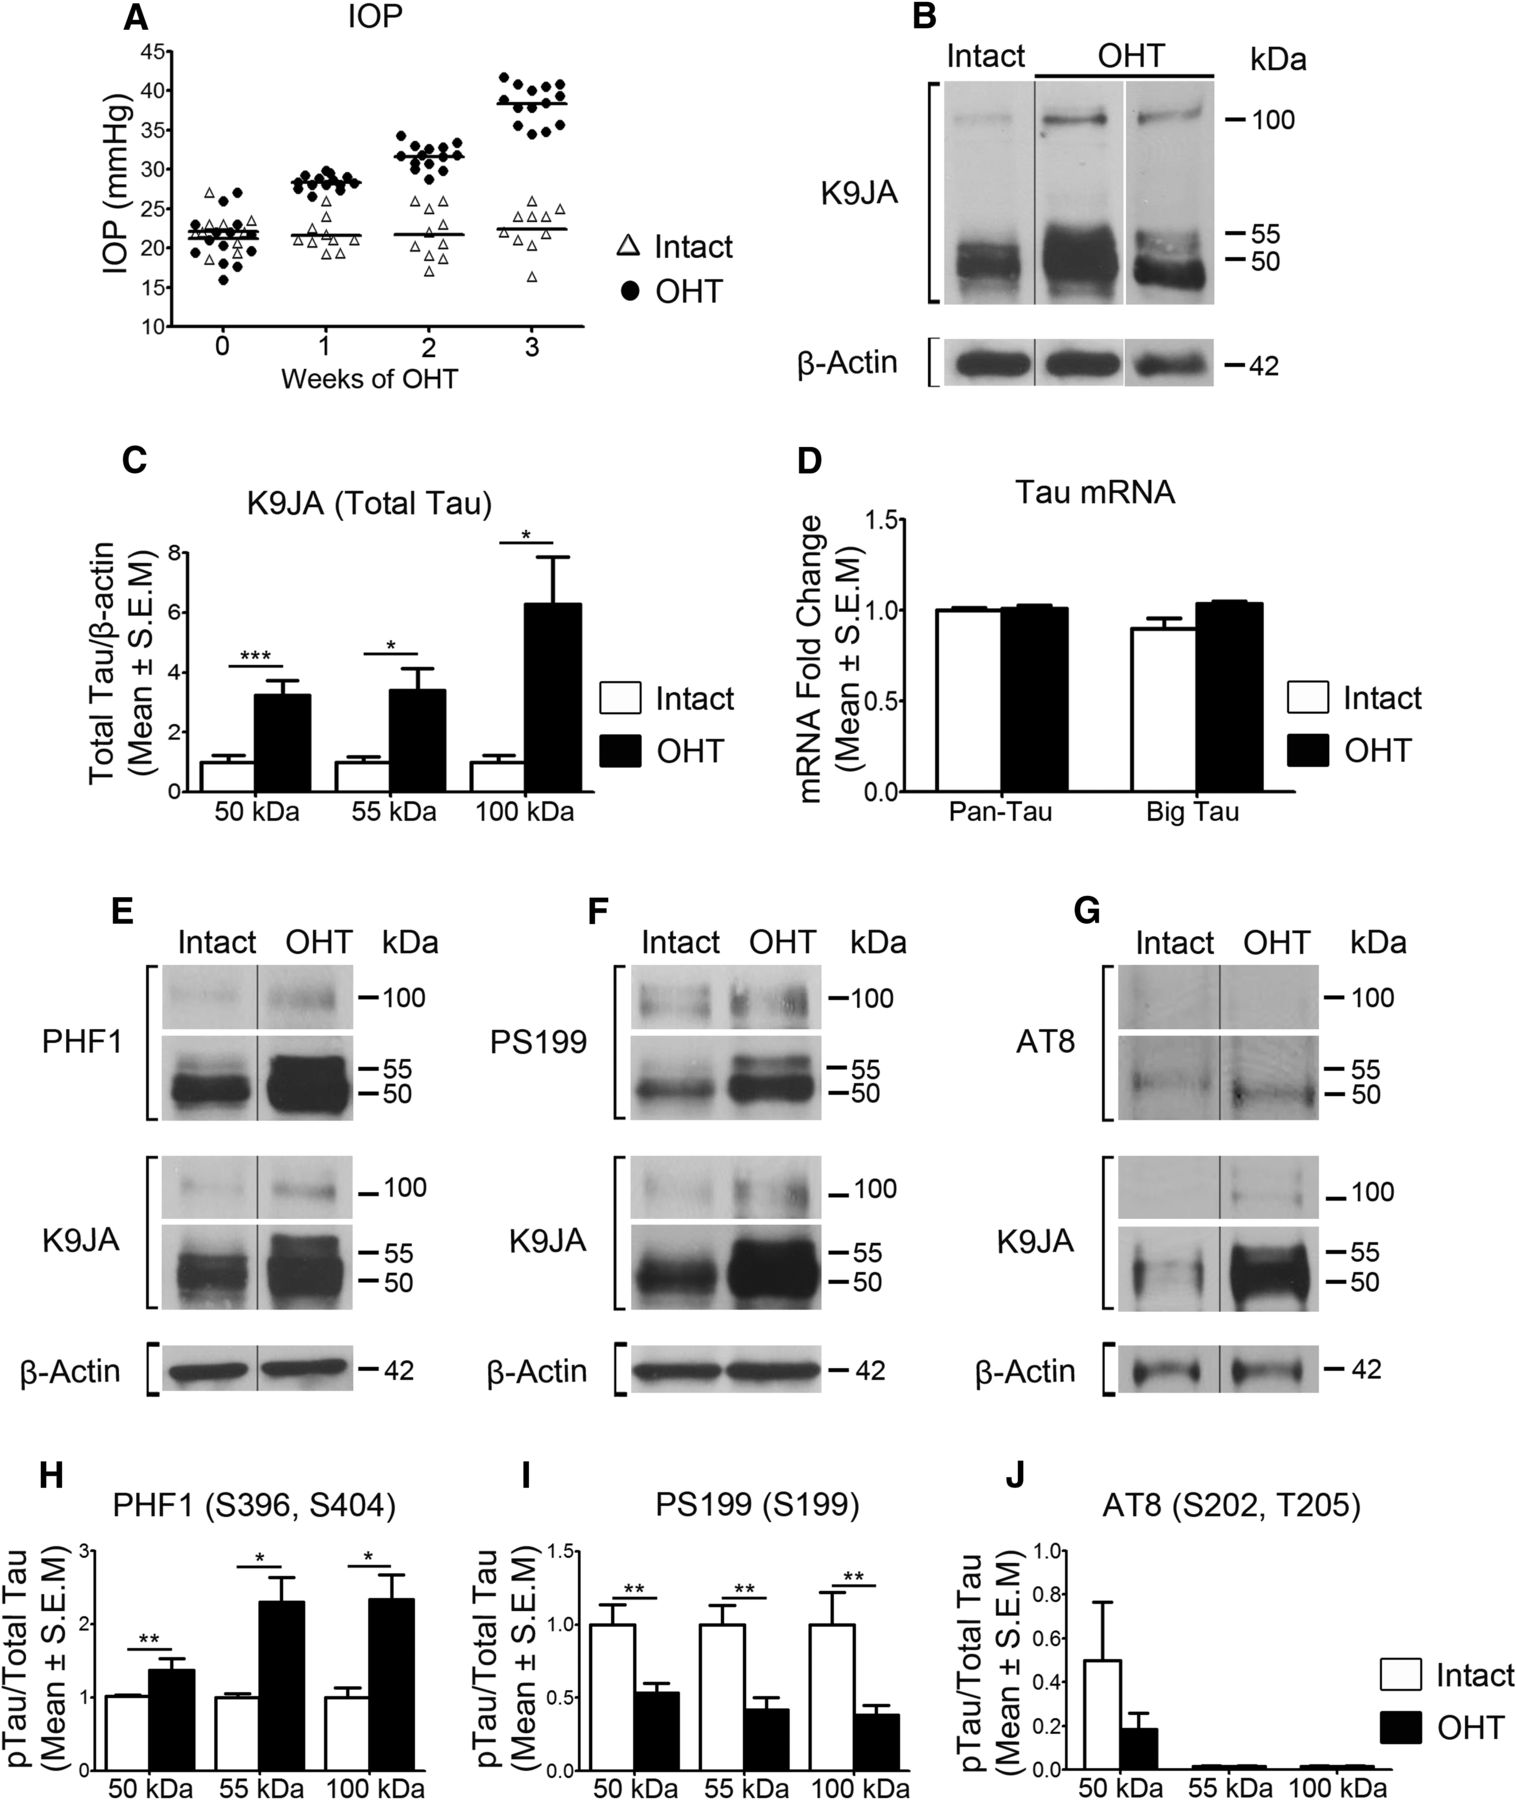
- Figure 2.
Ocular hypertension (OHT) promotes retinal tau upregulation and epitope-dependent changes in phosphorylation. A, Intraocular pressure (IOP) measurements for individual rats during a 3 week period following injection of hypertonic saline solution into an episcleral vein (Intact, N = 10; OHT, N = 14). B, Western blot analysis showed a substantial increase in all tau isoforms in retinas with OHT compared with Intact controls. Two examples of retinas with OHT are shown, using different samples and exposure times, to better demonstrate the independent increase of the 50 and 55 kDa bands. C, Densitometry demonstrated a 3.2-fold, 3.4-fold, and 4.9-fold increase in the 50, 55, and 100 kDa bands, respectively, in glaucomatous retinas compared with Intact controls (OHT, N = 10; Intact, N = 6; Student's t test, *p < 0.05, ***p < 0.001). D, Real-time qPCR analysis demonstrated no significant change in retinal tau gene expression (OHT, N = 6; Intact, N = 6). E–G, Western blot analysis of phospho-specific epitopes revealed alterations in tau phosphorylation at PHF1 and PS199, while no change was detected at AT8. H–J, Densitometric analysis demonstrated a significant increase in phosphorylation on S396 and S404 (PHF1), accompanied by reduced phosphorylation on S199 (PS199) relative to total tau, while no change was detected on AT8 (OHT, N = 9–10/group; Intact, N = 6; Student's t test, *p < 0.05, **p < 0.01). Vertical lines represent nonconsecutive samples from the same gel.
- Figure 3.
Altered phosphorylation drives tau accumulation and oligomerization in glaucomatous retinas. A, Pearson correlation analysis of 100 kDa/total tau vs total tau demonstrated a positive association between the levels of the 50 kDa species and the 100 kDa/50 kDa ratio. B, No significant correlation was observed between the levels of the 55 kDa species and the 100 kDa/55 kDa ratio. C, D, Analysis of phosphorylated tau/total tau vs total tau showed that phosphorylation of the PHF1 epitope (S396, S404) correlated positively with 50 kDa tau accumulation, while no significant correlation was found for 55 kDa tau. E, F, A negative correlation was found between S199 phosphorylation on 50 and 55 kDa tau and their levels. R, correlation coefficient. N = 9/group. G, H, Western blot analysis of retinal extracts in nondenaturing conditions using T22, an antibody that recognizes tau oligomers, confirmed the appearance of tau oligomeric complexes in glaucomatous retinas (OHT, N = 5; Intact, N = 3; Student's t test, *p < 0.05, ***p < 0.001). Vertical lines represent nonconsecutive samples from the same gel.
- Figure 4.
Tau accumulates in the RGC somatodendritic compartment in glaucoma. A, B, Retinal immunohistochemistry using antibodies against total tau (K9JA) revealed marked tau upregulation in glaucomatous eyes compared with Intact controls. C–E, Colabeling of hypertensive retinas with total tau and TUJ1, an RGC-specific marker, demonstrated tau upregulation in RGC soma in the GCL and dendrites in the IPL. F–H, Confocal microscopy analysis validated tau protein expression in RGC somas and dendrites (arrowhead). I–Q, In the INL, cells expressing tau were identified as calbindin-positive horizontal cells, ChAT-positive amacrine cells, and PKCα-positive bipolar cells (white arrowheads). Scale bars: A–E, 25 μm; F–H, 5 μm; I–Q, 12.5 μm. ONL, Outer nuclear layer.
- Figure 5.
Tau is downregulated in optic nerve RGC axons in glaucoma. A–F, Tau is abundantly expressed in RGC axons, visualized with the axonal-enriched marker NF-H, in control normotensive eyes. G–L, In contrast, optic nerves with OHT displayed a striking reduction in tau protein expression. Tau downregulation was not due to axonal loss because colabeling with NF-H confirmed that RGC axons were still abundant at this time point. Scale bars: A–C, G–I, 25 μm; D–F, J–L, 5 μm. M, N, Western blot analysis of optic nerve homogenates showed a substantial decrease in total tau in nerves from glaucomatous eyes compared with Intact controls. OHT, N = 3; Intact, N = 3; Student's t test, *p < 0.05. Vertical lines represent nonconsecutive samples from the same gel. O–T, Immunolabeling of whole-mounted retinas with tau and NF-H antibodies shows low levels of tau in RGC intraretinal axons of naive retinas that increased markedly with OHT. Scale bars: O–T, 25 μm.
- Figure 6.
Intravitreal delivery of siRNA against tau downregulates retinal tau protein levels. A, B, Western blot analysis of retinal homogenates from eyes that received siRNA at 1 week after the induction of OHT. Eyes injected with siTau showed a significant reduction in tau protein, while a control siGFP had no effect (siGFP, N = 4; siTau, N = 3; Student's t test, *p < 0.05). Vertical lines represent nonconsecutive samples from the same gel. C, D, Results of immunohistochemistry of glaucomatous retinas confirmed that tau downregulation occurred primarily in the IPL and GCL following siTau administration. No change was observed with control siGFP. Scale bars, 25 μm. ONL, Outer nuclear layer.
- Figure 7.
Selective tau knockdown promotes RGC survival. A–C, Flat-mounted retinas from eyes treated with siTau displayed higher RGC densities, visualized with the RGC-specific marker Brn3a, compared with control retinas treated with vehicle at 3 weeks after OHT. Scale bars, 25 μm. D–F, Optic nerves from siTau-treated eyes contained more RGC axon fibers with normal morphology, visualized in Toluidine Blue-stained cross sections, compared with control eyes. Scale bars, 5 μm. G, H, Quantitative analysis confirmed that siTau (black bars) promoted significant survival of RGC somas (N = 10) and axons (N = 6) compared with control eyes treated with siGFP (gray bars; somas, N = 9; axons, N = 6). The densities of RGC somas and axons in Intact, nonglaucomatous Brown Norway rat retinas are shown as reference (white bars; 100% survival, N = 6). Intraocular injection of siTau did not significantly alter the density of RGC somas or axons in naive animals (light gray bars, N = 4). Values are expressed as the mean ± SEM. Overall ANOVA for RGC somas, p < 0.001; Bonferroni post hoc test, nontreated Intact vs Intact + siTau, p > 0.05; nontreated Intact vs OHT + siGFP, ***p < 0.001; OHT + siGFP vs OHT + siTau, ***p < 0.001. Overall ANOVA for RGC axons, p < 0.001; Bonferroni post hoc test, nontreated Intact vs Intact + siTau, p > 0.05; nontreated Intact vs OHT + siGFP, ***p < 0.001; OHT + siGFP vs OHT + siTau, *p < 0.05. n.s., Not significant.


Tables
Treatment RGC soma/mm2 RGC axons/optic nerve N Mean ± SEM % N Mean ± SEM % Intact 6 2127 ± 81 100 6 102,783 ± 3623 100 Anti-GFP siRNA 9 1599 ± 40 75 6 58,083 ± 6246 57 Anti-Tau siRNA 10 1966 ± 39 92 6 79,701 ± 4606 78 Tau knockdown promotes RGC soma and axon survival. Intact control retinas or optic nerves are used as a reference (100%).


