

Article Figures & Data
Figures
- Figure 1.
In vivo biophotonic/bioluminescence imaging of TLR2-SOD1 mice. A, B, Representative real-time imaging of the TLR2 induction in TLR2-WT controls (A) and TLR2-SOD1G93A double-transgenic mice (B) at 20 weeks of age (color scales represent photons/second). C, The longitudinal quantitative analysis of the total photon emissions from olfactory bulb and brain ROIs at various time points shows a reduced TLR2 activation in presymptomatic SOD1G93A mice (n between 10 and 20 mice per group per time point; p < 0.05 for all time points). D–G, Real-time imaging of the TLR2 response following LPS stimulation in presymptomatic (60 d) SOD1G93A mice shows a significant reduction in TLR2 activation in the SOD1G93A mice compared to WT littermates. H–J, Photonic quantification from the olfactory bulb ROI 24 h after LPS stimulation (WT, n = 4; SOD1G93A, n = 8; p = 0.0006) and 48 h after LPS (WT, n = 5; SOD1G93A, n = 4; p = 0.0269; H), from the brain ROI 24 h after LPS (WT, n = 4; SOD1G93A, n = 8; p = 0.0065) and 48 h after LPS (WT, n = 4; SOD1G93A, n = 5; I), and from lumbar spinal cord ROI 24 h after LPS (WT, n = 5; SOD1G93A, n = 5; p = 0.0181) and 48 h after LPS (WT, n = 4; SOD1G93A, n = 5; J). K–N, Real-time imaging of the TLR2 response following LPS stimulation in presymptomatic (4 month) SOD1G37R mice show a similarly significant reduction of TLR2 activation. O–Q, Photonic quantification from the olfactory bulb ROI 24 h after LPS stimulation (WT, n = 4; SOD1G37R, n = 2; p = 0.0114; O), from the brain ROI 24 h after LPS (WT, n = 4; SOD1G37R, n = 4; p = 0.0347; P), and from the lumbar spinal cord ROI 24 h after LPS (WT; n = 4, SOD1G37R; n = 4; p = 0.0217; Q). Error bars indicate SEM.
- Figure 2.
Immunofluorescence and in situ hybridization analysis. A, B, Immunofluorescence of Iba1 staining in the olfactory bulb of WT littermates controls (A) and presymptomatic 60-d-old SOD1G93A mice (B) 24 h after an LPS stimulation. C–H, Higher magnification of Iba1 staining in the olfactory bulb of WT controls (C) and SOD1G93A mice (F), TLR2 staining (D, G), and a merge showing the colocalization of both stainings (E, H). K–N, Representative photomicrographs of the in situ hybridization of the TLR2 expression 24 h after LPS stimulation in the olfactory bulb of WT controls (I) and presymptomatic 60-d-old SOD1G93A mice (J), of TNFα expression in the olfactory bulb (K, L), and TLR2 expression in the lumbar spinal cord (M, N). O–R, Quantification of in situ labeled cells per tissue section of 60-d-old mice, from baseline and 24 h following LPS stimulation: TLR2-labeled cells in the olfactory bulb (WT, n = 5; SOD1G93A, n = 5; WT + LPS, n = 5; SOD1G93A + LPS, n = 5; p = 0.0052; O), TNFα-labeled cells in the olfactory bulb (WT, n = 5; SOD1G93A, n = 5; p = 0.0221, WT + LPS, n = 5; SOD1G93A + LPS, n = 5; p < 0.0001; P), TLR2-labeled cells in the lumbar spinal cord (WT, n = 5; SOD1G93A, n = 5; p = 0.0067, WT + LPS, n = 5; SOD1G93A + LPS, n = 5; p = 0.0043; Q), and TNFα-labeled cells in the lumbar spinal cord (WT, n = 5; SOD1G93A, n = 5; WT + LPS, n = 5; SOD1G93A + LPS, n = 5; p = 0.0376; R). Scale bars: A, B, 500 μm; C–H, 50 μm; K–N, 250 μm. Error bars indicate SEM.
- Figure 3.
IL-10 overexpression in in vitro adult microglia primary cultures. A–D, Baseline expression of TLR2 detected by immunofluorescent staining in adult primary cultures derived from the olfactory bulb of 60-d-old WT controls (A) and SOD1G93A mice (B) and TLR2 upregulation following in vitro LPS stimulation (C, D), Scale bar, 50 μm. E, Optical density quantification of TLR2 immunofluorescent stained cultures (WT, n = 6; SOD1G93A, n = 6; p < 0.0001; WT + LPS, n = 6; SOD1G93A + LPS, n = 6; p < 0.0001). F–J, RT-PCR analysis of the adult microglia primary cultures from olfactory bulb and spinal cord of WT and SOD1G93A mice, before and after LPS stimulation, looking at relative mRNA concentrations of IL-1β (spinal cord, WT vs SOD1G93A, p = 0.0319; WT + LPS vs SOD1G93A + LPS, p < 0.0001; F), IL-6 (olfactory bulb, WT + LPS vs SOD1G93A + LPS, p = 0.0388; spinal cord, WT vs SOD1G93A, p = 0.0346; G), TNFα (olfactory bulb, WT + LPS vs SOD1G93A + LPS, p = 0.0170; spinal cord, WT vs SOD1G93A, p = 0.0105; H), TGF-β1 (spinal cord, WT + LPS vs SOD1G93A + LPS, p = 0.0103; I), and IL-10 (olfactory bulb, WT + LPS vs SOD1G93A + LPS, p = 0.0002; spinal cord, WT vs SOD1G93A, p = 0.0479; WT + LPS vs SOD1G93A + LPS, p = 0.0206; J). All mRNA relative concentrations were normalized on the control gene HPRT1, and n = 2 for all RT-PRC analyses. K, Quantification of the IL-10 cytokine array from in vivo olfactory bulb 24 h after LPS stimulation (WT + LPS, n = 6; SOD1G93A + LPS, n = 6; p = 0.0054) and from in vivo lumbar spinal cord after LPS stimulation (WT + LPS, n = 6; SOD1G93A + LPS, n = 6; p = 0.0014). Error bars indicate SEM.
- Figure 4.
Presymptomatic microglial phenotype is not mediated by peripheral immune cells. Blood samples from presymptomatic (60 d) and 24 h LPS stimulated WT and SOD1G93A mice were collected to assess the potential of immune cells in the periphery to modulate the repressed microglial response observed in the CNS of presymptomatic SOD1G93A mice. The blood samples were stained for CD45, CD4, CD8, and CD11b or for CD45, CD4, CD25, FoxP3, IL-4, and IL-10 and analyzed in flow cytometry. A–D, In 60-d-old mice, the CD4+ and CD8+ lymphocyte proportions were unchanged between WT and SOD1G93A (A, B), as were the monocyte/macrophage CD11b+ populations (C, D). CD4+, CD8+ lymphocytes and CD11b+ monocytes/macrophages of WT and SOD1G93A mice all showed equivalent response to LPS stimulation. E–G, Overall FACS counts suggest no deregulation in the CD4+, CD8+, or CD11b+ population in presymptomatic 60-d-old SOD1G93A mice. CD25+/FoxP3+ Tregs were also assessed for their production of IL-4 and IL-10. H, I, Both at baseline (H) and after LPS stimulation (I), WT and SOD1G93A mice had similar Tregs population ratios. J, Tregs counts suggest no deregulation between presymptomatic WT and SOD1G93A mice at 60 d. K, L, Levels of IL-10 (K) and IL-4 (L) were estimated as mean levels of fluorescence intensity among the Tregs cells. Again, no differences were observed between WT and SOD1G93A presymptomatic 60 d Tregs (n = 4–6 in each groups). Error bars indicate SEM.
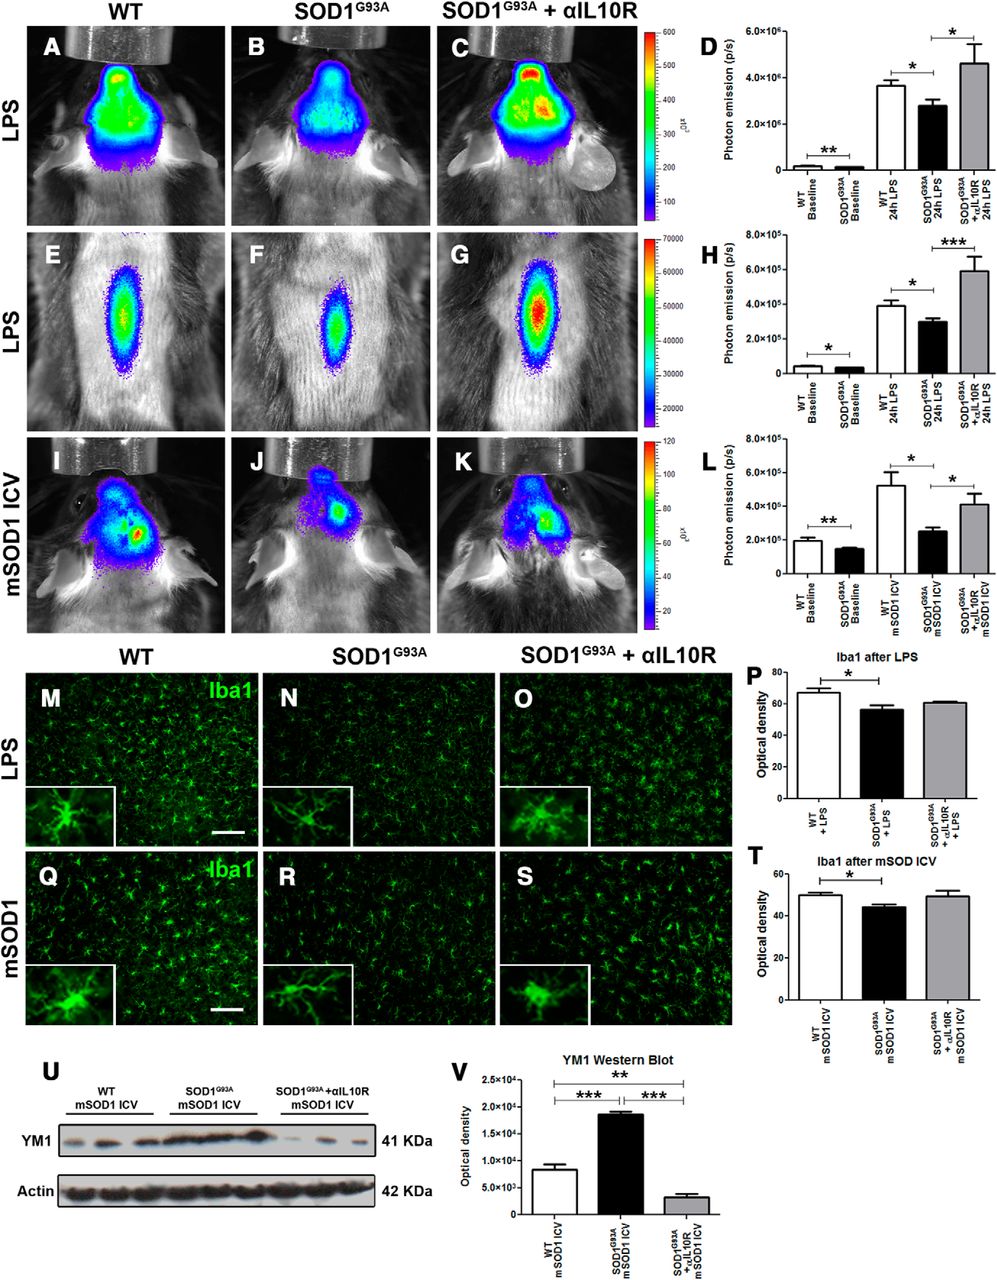
- Figure 5.
Modulating the microglial response by blocking the IL-10 pathway. A–C, E–G, Real-time imaging of TLR2 induction in the olfactory bulb and brain, 24 h after LPS stimulation, in WT controls (A), SOD1G93A mice (B), and SOD1G93A mice treated with αIL-10R antibodies (C) and the respective real-time imaging of the spinal cord (E–G) show a significant LPS-induced microglial activation increase in αIL-10R-treated SOD1G93A compared to untreated SOD1G93A mice. D, Quantitative analysis of the photonic emissions in the head (WT, n = 19; SOD1G93A, n = 24; p = 0.0047; WT + LPS, n = 24; SOD1G93A + LPS, n = 20; p = 0.0273; SOD1G93A + αIL-10R + LPS, n = 9; p = 0.0126). H, Quantitative analysis of the photonic emissions in the spinal cord (WT, n = 19; SOD1G93A, n = 22; p = 0.0119; WT + LPS, n = 16; SOD1G93A + LPS, n = 13; p = 0.0351; SOD1G93A + αIL-10R + LPS, n = 8; p = 0.0005). I–K, Real-time imaging of TLR2 induction in the olfactory bulb and brain, 48 h following intracerebroventricular injection of mSOD1, in WT controls (I), SOD1G93A mice (J), and SOD1G93A mice treated with αIL-10R antibodies (K) shows a significant mSOD1-induced microglial activation increase in the SOD1G93A αIL-10R-treated mice. L, Quantitative analysis of the photonic emissions in the head (WT, n = 19; SOD1G93A, n = 24; p = 0.0047; WT + LPS, n = 10; SOD1G93A + LPS, n = 6; p = 0.0221; SOD1G93A + αIL-10R + LPS, n = 7; p = 0.0490). M–P, Immunostaining of Iba1 after LPS stimulation in WT, SOD1G93A, and SODG93A +αIL-10R mice (M–O) and associated optical density quantification (P; WT + LPS, n = 5; SOD1G93A + LPS, n = 5; p = 0.0258; SOD1G93A + αIL-10R + LPS, n = 5). Q–T, Immunostaining of Iba1 after mSOD1 intracerebroventricular stimulation in WT, SOD1G93A, and SODG93A + αIL-10R mice (Q–S) and associated optical density quantification (T; WT + mSOD1, n = 5; SOD1G93A + mSOD1, n = 5; p = 0.0161; SOD1G93A + αIL-10R + mSOD1, n = 5). Scale bars: 100 μm. U, V, Western blots of Ym1 in WT, SOD1G93A, and SOD1G93A + αIL-10R brain extracts following mSOD1 intracerebroventricular stimulation (U) and optical density quantification (V) show a significant increase of Ym1 in the SOD1G93A + mSOD1 samples, but also a significant decrease of Ym1 levels in the SOD1G93A + αIL-10R + mSOD1 samples (WT + mSOD1, n = 3; SOD1G93A + mSOD1, n = 3; p = 0.0009; SOD1G93A + αIL-10R + mSOD1, n = 3; p < 0.0126). Error bars indicate SEM.
- Figure 6.
Treatment with blocking IL-10R antibodies accelerates disease onset in SOD1G93A mice, whereas AAV-CD11b-cMyc-IL10 virus intrathecal injection delays onset and extends survival. Longitudinal analysis of SOD1G93A mice subjected to a 42 d intracerebroventricular infusion of saline (black curves) or αIL-10R antibodies (red curves) started at presymptomatic 60 d of age. A, Kaplan–Meier analysis of the extension reflex revealed a significant median onset 7 d earlier in the αIL-10R infused group (saline treated mean onset, 81 d; n = 9; αIL-10R treated mean onset, 74 d; n = 10; p = 0.0101). B, Animals receiving the αIL-10R antibodies failed to gain weight like the saline-treated controls and maintained an overall significant lower weight through their lifespan (linear regression analysis shows that the elevation between the two curves is significant; p < 0.0001). C, The presymptomatic αIL-10R treatment did not however affect the survival rate between the two groups. D, Diagram of the viral AAV construct expressing cMyc-IL-10 under the control of the human CD11b gene promoter. Longitudinal analysis of SOD1G93A mice subjected to an intrathecal AAV virus injection, with an empty plasmid control virus (black curves) or AAA-CD11b-cMyc-IL10 virus (blue curves) injected at presymptomatic 30–35 d of age. E, Kaplan–Meier analysis of the extension reflex revealed a significant 9 d delayed median onset in the AAV-CD11b-cMyc-IL10-infected group (control AAV mean onset, 90 d; n = 8; AAV-Cd11b-cMyc-IL10 mean onset, 99 d; n = 14; p = 0.0157). F, Animals receiving the AAV-CD11b-cMyc-IL10 virus maintained an overall significantly higher weight through their lifespan (linear regression analysis shows that the elevation between the two curves is significant; p = 0.0039). G, The presymptomatic AAV-CD11b-cMYC-IL10 intrathecal injection also significantly increased survival by 13 d (control AAV mean survival, 153 d; n = 7; AAV-Cd11b-cMyc-IL10 mean survival, 166 d; n = 14; p = 0.0166). H, I, Immunostaining of cMyc in the spinal cord of AAV-CD11b-cMyc-IL10-injected mice shows colocalization with Iba1, confirming a microglial expression of the viral construct. Scale bars: 100 μm; insets, 50 μm. Error bars indicate SEM.
- Figure 7.
Intracerebroventricular infusion of blocking IL-10R antibodies increases inflammation in the lumbar spinal cord, whereas IL-10 increases anti-inflammatory markers. A–C, Immunostaining of Iba1 in the lumbar spinal cord ventral horn of mice following 42 d of saline (A) or αIL-10R (B) intracerebroventricular infusion in SOD1G93A mice reveals, by optical density quantification of the fluorescent signal, an increased Iba1 immunoreactivity in the αIL-10R-treated mice (C; saline, n = 5; αIL-10R, n = 8; p = 0.0298). D–F, Immunostaining for Cd68, a marker of microglial activation (D, E), similarly shows, by optical density quantification, an increased CD68 expression in αIL-10R-infused SOD1G93A mice (F; saline, n = 6; αIl-10R, n = 6; p = 0.0128). G–M, TNFα immunostaining following in vitro mSOD1 stimulation on SOD1G93A, SOD1G93A + αIL10R + IL10, and SOD1G93A + IL10 primary cultures and relative numbers of TNFα/CD11b colocalization (M) show a significant decrease of TNFα cells in the IL10-treated group (SOD1G93A + mSOD1, n = 16; SOD1G93A + αIL-10R + IL10 + mSOD1, n = 16; SOD1G93A + IL10 + mSOD1, n = 16; p = 0.0041). N–T, Ym1 immunostaining following in vitro mSOD1 stimulation on SOD1G93A, SOD1G93A + αIL-10R + IL10, and SOD1G93A + IL10 cultures and relative numbers of YM1/CD11b colocalization (T) show a significant increase of YM1 positive cells following IL10 treatment (SOD1G93A +mSOD1, n = 16; SOD1G93A +αIL-10R +Il10 +mSOD1, n = 16; SOD1G93A + IL10 +mSOD1, n = 16, p = 0.0002). Scale bars: 50 μm. Error bars indicate SEM.


