

Abstract
Addicted individuals continue substance use despite the knowledge of harmful consequences and often report having no choice but to consume. Computational psychiatry accounts have linked this clinical observation to difficulties in making flexible and goal-directed decisions in dynamic environments via consideration of potential alternative choices. To probe this in alcohol-dependent patients (n = 43) versus healthy volunteers (n = 35), human participants performed an anticorrelated decision-making task during functional neuroimaging. Via computational modeling, we investigated behavioral and neural signatures of inference regarding the alternative option. While healthy control subjects exploited the anticorrelated structure of the task to guide decision-making, alcohol-dependent patients were relatively better explained by a model-free strategy due to reduced inference on the alternative option after punishment. Whereas model-free prediction error signals were preserved, alcohol-dependent patients exhibited blunted medial prefrontal signatures of inference on the alternative option. This reduction was associated with patients' behavioral deficit in updating the alternative choice option and their obsessive-compulsive drinking habits. All results remained significant when adjusting for potential confounders (e.g., neuropsychological measures and gray matter density). A disturbed integration of alternative choice options implemented by the medial prefrontal cortex appears to be one important explanation for the puzzling question of why addicted individuals continue drug consumption despite negative consequences.
SIGNIFICANCE STATEMENT In addiction, patients maintain substance use despite devastating consequences and often report having no choice but to consume. These clinical observations have been theoretically linked to disturbed mechanisms of inference, for example, to difficulties when learning statistical regularities of the environmental structure to guide decisions. Using computational modeling, we demonstrate disturbed inference on alternative choice options in alcohol addiction. Patients neglecting “what might have happened” was accompanied by blunted coding of inference regarding alternative choice options in the medial prefrontal cortex. An impaired integration of alternative choice options implemented by the medial prefrontal cortex might contribute to ongoing drug consumption in the face of evident negative consequences.
Introduction
A key characteristic of addictive disorders is that addicted individuals continue substance use despite evident harmful consequences. Addicted individuals regularly report having no choice but to consume. This suggests an impairment of integrating different choice options and their potential consequences. Thus, neglecting “what might have happened” may rigidly bias decision-making toward choice options that have been proven to be rewarding in the past (Chiu et al., 2008; Redish et al., 2008; Dayan, 2009).
Computational psychiatry accounts (Montague et al., 2012) have theoretically linked these maladaptive decision-making processes to disturbed mechanisms of inference (Huys et al., 2015), for example, difficulties learning the statistical regularities of the environmental structure to guide decisions. Deficits in cognitive flexibility are well known in patients experiencing addiction (Bechara and Damasio, 2002; Garavan and Stout, 2005; Ersche et al., 2011; Goldstein and Volkow, 2011). Thus, addiction has been theorized as one prime example of a breakdown of behavioral control in favor of simple and inflexible learning processes (Everitt and Robbins, 2005; Dayan, 2009; Lucantonio et al., 2012) with support from first behavioral studies (Sebold et al., 2014; Voon et al., 2015). One such example is model-free reinforcement learning (RL), where choice values are adjusted via learning from past rewards only. However, model-free RL neglects the environmental structure, for example the relation between chosen and unchosen options. Reversal learning is a well known paradigm challenging the individual to flexibly adapt behavior, and addicted individuals are impaired in such tasks (Izquierdo and Jentsch, 2012). However, in alcohol-dependent patients, parameters of model-free RL did not account for the observed deficit in flexible behavioral adaptation, and neural signatures of model-free RL did not differ between groups (Park et al., 2010; Deserno et al., 2015c). One potential explanation is that alcohol-dependent patients are specifically impaired in inference regarding the interdependencies of choice values (e.g., if one option is bad, the other one might be good), which might hamper alcohol-dependent individuals in flexibly adapting their behavior.
In the same vein, concurrent tracking of how different decision options relate to each other, thus, generalization about what might have happened, promotes flexible behavioral adaptation in healthy individuals (Hampton et al., 2006; Gläscher et al., 2009; Li and Daw, 2011; Schlagenhauf et al., 2014). In such reversal learning tasks, this depends on inference regarding the anticorrelated task structure, for example, when a drop in one decision value implicates a rise of the other value (Fig. 1A). Neural signatures of flexible behavioral adaptation and also model-free RL were previously found in a network consisting of ventral striatum as well as the medial and lateral prefrontal cortices (O'Doherty et al., 2004; Hampton et al., 2006; Daw et al., 2011; Deserno et al., 2015b). There is evidence that the medial prefrontal cortex (mPFC) is a key region in the concurrent tracking of choice values and thus enables flexible behavioral adaptation (Hampton et al., 2006). Here, we probe whether the modification of basic model-free RL with respect to the interdependencies of choice values, reflecting the anticorrelated environmental structure, is disturbed in alcohol addiction and whether this relates to the clinical feature of obsessive drinking.

Schematic: parallel double-updating of chosen and unchosen choice values. A, At time t, an agent in state St passes to a new state St+1 by the action a, observing the outcome R, which leads to the reward prediction error δ as the difference between an expected and an actually gained reward. Accordingly, the agent updates the chosen value for the next trial, Qt+1. Although not explicitly observed, the agent can conclude from the anticorrelated task structure what might have happened (R′) if he had chosen an alternative action a′, resulting in a fictive prediction error δ′. Thus, by inference on the anticorrelated task structure and parallel to updating chosen values, the agent additionally double-updates unchosen values Q′t+1. Individuals might differ in their degree of inference on the environmental structure. The individual degree of double updating is therefore weighted by the parameter κ. B, Trajectories of values of both stimuli as a function of κ (top: κ = 0, single-update model; middle: κ = 1, double-update model; bottom: κ = free parameter, individually weighted double-update model) for one exemplary participant. Small colored dots in the upper edge of the figure indicate the chosen stimulus per trial, black circles indicate outcome per trial (1, reward; −1, punishment). The figure was generated by adapting plotting functions included in the HGF toolbox as part of the TNU Algorithms for Psychiatry Advancing Science (TAPAS Mathys et al., 2014). C, Effect of inference, double-updating, on chosen values. For one exemplary participant, values of the respective chosen option are plotted per trial, as a function of the two alternative control strategies: pure single updating (κ = 0, neglecting what might have happened, red) vs pure-double-updating (κ = 1, full inference on the task structure, blue). Hence, the difference of both (here, highlighted in gray) represents an estimate of the degree of inference on the anticorrelated task structure. In our analysis of functional imaging data, we probe how this difference in choice values modulates the coding of the core teaching signal, the reward prediction error δ for chosen values.
To address this, we used functional magnetic resonance imaging (fMRI) during decision-making in a dynamic environment to examine flexible behavioral adaptation. Importantly, reward contingencies of different options were anticorrelated: whenever one stimulus was a good choice, the other one would be the worse choice, and vice versa. When confronted with options such as those in this task, individuals make choices based on decision values computed for the options at hand (Rangel et al., 2008). These can either be deduced by action–reward pairings or by inference on the anticorrelated reward probabilities (Hampton et al., 2006; Bromberg-Martin et al., 2010). We hypothesized that alcohol-dependent patients fail to integrate this inference, “what might have happened,” into the value of the chosen options. To this end, we compared RL models that differ in updating the unchosen option. As a neural substrate, we predicted prefrontal signatures reflecting inference on alternative options to be reduced in alcohol-dependent patients.
Materials and Methods
Participants.
Forty-three alcohol-dependent patients and 35 healthy participants were included. fMRI data were available for 35 healthy participants and 34 patients. Patients were recruited from an inpatient detoxification and rehabilitation program (Soteria Klinik Leipzig) and had abstained from alcohol for at least 8 d (range, 8–56 d; mean, 28.80 d; SD, 11.85 d). All patients were free of any psychotropic medication for at least four plasma half-lives except for one patient taking doxepin due to sleeping problems. All subjects underwent the Structured Clinical Interview for Diagnostic and Statistical Manual of Mental Disorders (DSM), fourth edition, Axis I Disorders (SCID-I; First et al., 2001) and patients additionally underwent a semi-structured interview on their individual addiction history. Alcohol dependence was diagnosed in all patients according to DSM, fifth edition, and International Statistical Classification of Diseases and Related Health Problems, 10th revision. Alcohol-dependent patients did not meet the criteria of any current comorbid psychiatric disorder. Included control participants did not report any current nor past psychiatric disorder (SCID-I). See Table 1 for demographic, neuropsychological, and clinical characteristics. The local ethics committee approved the study. Participants gave written informed consent and were reimbursed for participation.
Sample characteristics
Measures of addiction severity.
Addiction severity was assessed using (1) time-line follow back score (TLFB; Sobell, 1992), to assess alcohol units consumed in the month before treatment; (2) obsessive-compulsive drinking scale (OCDS; Anton et al., 1995); (3) alcohol craving questionnaire (ACQ; Tiffany et al., 2000); and (4) alcohol use disorder identification test (AUDIT; Allen et al., 1997).
Neurocognitive measurements.
Alcohol dependence is known to be linked with a number of cognitive deficits (Bates et al., 2002; Goldstein et al., 2004), which have recently been shown to be associated with impaired model-based decision-making (Sebold et al., 2014). Therefore, participants completed a battery of neurocognitive tests on the following domains: working memory (Digit Span; Wechsler, 1955); cognitive speed (Digit-Symbol-Substitution Test; Wechsler, 1955); reasoning (Matrices Test; Amthauer et al., 1999); verbal IQ (German vocabulary test, Schmidt and Metzler, 1992); visual attention (Reitan Trail Making A; Reitan, 1955); and complex attention (Reitan Trail Making B; Reitan, 1955). Results and group comparisons are summarized in Table 1. We computed a factor analysis (principle component analysis) to extract composite measures of neurocognitive functioning. Based on an eigenvector cutoff of >1, a factor analysis with an oblique rotation (direct oblimin) yielded a single factor solution, accounting for 59.61% of variance in the six test results obtained. The composite measure of neurocognitive functioning was subsequently used as a covariate in control analyses.
Decision-making task.
Participants performed reward-based decision-making in a dynamic environment that requires flexible behavioral adaptation (Fig. 2A, illustration). In a total of 160 trials, participants decided between two cards, each showing a different geometric stimulus (maximum response time, 1.5 s). Importantly, the task incorporated a simple higher-order structure: reward probabilities associated with the two choice options were anticorrelated; whenever stimulus A was a good choice, stimulus B would be the worse choice, and vice versa. Even though the outcome for the alternative option is never shown, the agent can infer from the anticorrelation of the options what might have happened if he had taken the other stimulus (Fig. 1A–C). Reward contingencies remained stable for the first 55 trials (first, “prereversal,” phase) and also for the last 35 trials (last, “postreversal,” phase). During the second (“reversal”) phase, reward contingencies changed (four changes in total, after 15 or 20 trials; Fig. 2B). This required participants to flexibly adapt their behavior.
Right-side versus left-side location of the stimuli on the screen was randomized over trials. After the participant had chosen one stimulus by left or right button press, the selected stimulus was highlighted and depicted for 1.5 s minus the reaction time. Feedback was shown for 0.5 s (monetary win vs monetary loss, indicated by a 10 Eurocent coin or a crossed 10 Eurocent coin, respectively). During the intertrial interval, a fixation cross was presented for a variable duration (jittered and exponentially distributed; range, 1–12.5 s). If no response occurred during the decision window, the message “too slow” was presented, and no outcome was delivered.
In a prior instruction and training session outside the MRI scanner, participants were informed that one of the two cards had a superior chance of winning money (probabilistic nature of the task). They were told that, depending on their choice, they could either win 10 cents or lose 10 cents per trial, that the aim was to win as much as possible, and that the total amount of money gained would be paid out at the end of the experiment. Participants performed 20 training trials with a different set of cards and without any reversal of reward contingencies. Subsequently, participants were instructed that reward probabilities could change over the course of the main experiment and that they should track such changes to win as much money as possible. Importantly, no other information or details on reversals or the correlation of outcomes was provided, such that patients had no explicitly instructed knowledge about the anticorrelated task structure before the experiment.
Analysis of choice behavior.
Behavioral performance was quantified as the percentage of correct choices (choices of the stimulus with 80% reward probability) and was analyzed using repeated-measures ANOVA including the between-subject factor “group” (patients vs control subjects) and the within-subject factor “phase” (prereversal: first 35 trials; reversal: intermediate 90 trials; postreversal: last 35 trials).
We additionally investigated the effect of previous feedback on subsequent decisions, namely repeating choices after reward (“win–stay”) and shifting responses after losses (“lose–shift”). Furthermore, we quantified how often participants repeated a choice despite two consecutive losses for the same choice in the preceding two trials, relative to all loss trials (den Ouden et al., 2013).
Computational modeling.
Different RL models were fitted to the data. All models learn the values of choice options via reward prediction errors (RPEs), a teaching signal that compares received rewards and expected values. In essence, the first three RL models differ in the degree of updating both the chosen and alternative decision options, as follows: (1) a model-free learner updating values for the chosen stimulus only, which neglects the anticorrelated task structure, which we refer to as the single-update (SU) model; (2) a learner updating values of chosen and unchosen stimuli equally using inference on the anticorrelated task structure, which we refer to as the double-update (DU) model; and (3) a model connecting SU and DU models by individually weighting the degree of double-update learning, thus accounting for individual variability. This is given by the weighting parameter κ. In the following, we refer to this model as the iDU model.
First, the model-free SU-algorithm updates a decision value Qa,t for the chosen stimulus via the RPE δQa,t, which is defined as the difference between the received reward Rt and the anticipated reward for the chosen stimulus Qa,t:
 The RPE δQa,t is used to iteratively update decision values of the chosen decision value trial-by-trial:
 Here, α depicts the learning rate, which weights the influence of RPEs δQa,t on the updated values. α has natural boundaries between 0 and 1. Importantly, this model neglects the anticorrelated task structure by updating only decision values for the chosen stimulus, while the value of the alternative, unchosen stimulus Qua,t remains unchanged, as follows:
 Second, the DU algorithm updates chosen and unchosen decision values in each trial. This takes into account the anticorrelated structure of the task. In our modeling approach, this is captured by additionally updating the unchosen decision values based on a different error signal, which compares the fictive outcome that might have happened with the value of the unchosen option. The RPE for the DU model is as follows:
 The same learning rate α is used for updating unchosen values, as follows:
 Equation 5 gives the same weight to the update of unchosen decision values as to the chosen decision values. Third, and in contrast, we assume that the degree of updating the alternative choice option differs across individuals. To account for interindividual variability regarding this process, we additionally constructed an iDU model to quantify each individual's degree of DU learning. This is provided by the parameter κ, which weights the learning rate α for the unchosen RPE δQua,t:
 In the iDU model, the RPE δQa,t is weighted by the product of the learning rate for the chosen value and the weighting parameter κ, where κ = 0 reduces to the SU model, and κ = 1 to the DU model. Note that this results in lower learning rates for DU learning, which is in line with the key assumption that double-update learning is computationally more costly.
Figure 1 provides a schematic of inference on the anticorrelated task structure with respect to unchosen choice values (double-updating). In the task at hand, as double-updating depends on inference derived from actually experienced feedback, updating of the unchosen stimulus always relies on learning from feedback for the chosen stimulus (i.e., is rather unlikely to be a process independent from updating the chosen stimulus; for comparison with an identical implementation, see Li et al., 2011). We ran 1000 simulations of choices on the reward sequences of the empirical data via the used RL models by setting κ = 0, κ = 0.5, and κ = 1, and confirmed clear superiority of double updating in terms of correct choices in the middle reversal phase (68.60% correct choices for κ = 0; 75.50% for κ = 0.50; and 75.66% for κ = 1).
For tasks such as the one used here, some previous work indicated that models with a dynamically changing learning rate might fit behavior better than models with a static learning rate (Krugel et al., 2009). The so-called Sutton-K1 model updates the learning rate dynamically as a function of the change in prediction errors encountered (Sutton, 1992). It was previously discussed and used as a non-hierarchical approximation of a dynamic learning rate (Chumbley et al., 2012; Kepecs and Mainen, 2012; Landy et al., 2012; Iglesias et al., 2013). By including this model, we tested whether a model with a dynamic learning rate captures the observed behavior better than algorithms with a fixed learning rate. In this model, values are also updated via prediction errors as in Equations 1 and 2. The dynamic learning rate is transformed with a logistic function to remain in boundaries between 0 and 1, as follows:
 This is initialized with ι = 0 corresponding to an initial learning rate of 0.5. Note that this parameter is called β in the original publication, which we here change to ι because β is used throughout the article to refer to the temperature in the decision model. The update of ι for the next trial depends on the change in reward prediction errors where:
 and
and
 The value of μ given in Equation 8 is a free parameter, which controls the individual degree of dynamic update of the learning rate. ι is a sensitivity parameter of the learning rate, controlling the influence of the RPE of the last trial on a trial-by-trial basis as a function of μ.
In sum, we had a total of four learning algorithms, namely SU, DU, iDU, and Sutton-K1. In all algorithms, we include the initial value of one option as a free parameter (Huys et al., 2011, 2012; Schlagenhauf et al., 2014).
Decision model.
For all models, decisions are transformed into action probabilities by applying a softmax equation. The softmax equation includes the temperature β, which reflects the stochasticity of the choices; and a′ indicates all available choice options:

Learning from rewards versus punishments.
We also aimed to test the hypothesis of whether a potential deficit of alcohol-dependent patients in DU learning differs specifically as a function of learning from rewards versus learning from punishments in our task. In our models, we account for this by estimating separate learning rates and temperatures for reward (rew) and punishment (pun) trials corresponding to αrew, αpun, and βrew, βpun, respectively. We did so by assuming that these trial types refer to rather categorical differences in how tightly learned values influence choices.
Model fitting.
Fitting was performed in the same Bayesian framework as introduced in the studies by Huys et al. (2011, 2012) and as used in several studies, including between-group designs (Chowdhury et al., 2013; Deserno et al., 2015a) and patient studies (Schlagenhauf et al., 2014; Deserno et al., 2015c). To infer the maximum a posteriori estimate of parameters θ for each individual i, we use a Gaussian prior with mean and variance μ and σ, as follows:
 where Y represents the data in terms of actions Ai per subject i. We set priors empirically to the maximum-likelihood estimates of μ and σ given the data by all subjects included, as follows:
 and achieve this by using expectation maximization. Constrained parameters were transformed to a logistic (α, κ) or exponential (β) distribution to enforce constraints and to render normally distributed parameter estimates. All modeling analyses were performed using Matlab 2010b. It should be noted that the empirical prior mainly serves to mildly regularize parameters at the population level. As this was performed based on the data of participants, this renders between-group parameters valid.
Model comparison.
For all models, we approximate the model evidence by integrating out free parameters. This integral was approximated by sampling from the empirical prior distribution (Huys et al., 2011, 2012). Due to the hierarchical fitting procedure, which also fits prior means and variances (see Model fitting), such marginalized likelihoods can lead to overly optimistic results by biasing model selection toward more complex models. To obviate this problem, we used leave-one-out cross-validation by fitting the data without subject k and then marginalizing for subject k via sampling from the empirical prior distribution of sample n − k. Then, the marginal or integrated likelihood (the model evidence) based on leave-one-out cross-validation was subjected to a random-effects Bayesian model selection procedure (spm_BMS function contained in SPM8; Stephan et al., 2009) to compute expected posterior probabilities (PPs) and exceedance probabilities (XPs) for each model. XPs give the probability that PPs of a model differ from that of another model in the comparison set. Importantly, after running BMS initially across all participants, this was then performed separately for control subjects and patients.
Adequacy of the best-fitting model.
In addition to relative model comparison, we assessed the quality of the best-fitting model as follows: (1) determining identifiability via the rank of the Jacobian matrix (Bamber and van Santen, 1985, 2000) and via assessing correlations between the inferred parameters; (2) measures of absolute model fit via calculating McFadden's pseudo-R2 and assessing how many of each participant's choices can be explained by the model (corresponds to each individual's negative log-likelihood relative to the number of trials (Daw, 2009; Huys et al., 2011, 2012), which was tested for significance against chance level using a binomial test); (3) simulating choice data (100 simulations/participant) of the task based on the inferred parameters and running the same behavioral analysis on simulated choice data (using the median of the 100 simulations/subject), as for the empirical data; and (4) refitting the simulated choice data as a recovery analysis and determining the correlation between parameters inferred from empirical data with parameters inferred from simulated data.
MRI data acquisition.
Functional imaging was performed using a 3 tesla Siemens Trio scanner to acquire gradient echo T2*-weighted echoplanar images with blood oxygenation level-dependent contrast. Covering the whole brain, 40 slices were acquired in oblique orientation at 20° to the anterior commissure–posterior commissure line and in ascending order, with 2.5 mm thickness, 3 × 3 mm2 in-plane voxel resolution, 0.5 mm gap between slices, TR = 2.09 s, TE = 22 ms, and flip angle α = 90°. Before functional scanning, a field distortion map was collected to account for individual homogeneity differences of the magnetic field. Additionally, T1-weighted anatomical images were acquired.
Preprocessing of fMRI data.
For fMRI data analysis, we used SPM8 (http://www.fil.ion.ucl.ac.uk/spm/software/spm8/). Images were corrected for delay of slice time acquisition. Voxel-displacement maps were estimated based on acquired field maps. To correct for motion, all images were realigned, and additionally corrected for distortion and the interaction of distortion and motion. The images were spatially normalized to Montreal Neurological Institute (MNI) space using normalization parameters generated during the segmentation of the individual T1-weighted structural image (Ashburner and Friston, 2005); thereafter, all images were spatially smoothed with an isotropic Gaussian kernel (6 mm full-width at half-maximum).
Statistical analysis of functional MRI.
The aim of the statistical analysis was to elucidate neural signatures of RPEs for chosen values as a function of SU versus DU learning and potential group differences. Based on each individual's set of parameters identified during model fitting (random-effects parameters), we computed regressors for the statistical analysis of fMRI data. Using the general linear model approach as implemented in SPM8, smoothed images were analyzed in an event-related manner. At the first level, onsets of feedback were entered into the model and convolved with the canonical hemodynamic response function and modulated parametrically by two trial-by-trial regressors from our modeling analysis, as follows: first, individual RPEs for chosen values were computed based on of the SU model with κ = 0 (RPESU). Second, a difference regressor was entered reflecting the difference of RPEDU − RPESU. To build this regressor, individual RPEs for chosen values were computed based on the DU model with κ = 1 (RPEDU) and subtracted from the RPESU described above. This procedure accounts for collinearity between the regressors and reflects unique variance due to double-update computations beyond the single-update RPE (for the same analytic approach, please compare with Daw et al., 2011). The difference between RPEDU and RPESU reflects the difference in chosen values from the DU and SU algorithms. In the iDU model, this difference is reflected in the estimate of κ (illustrated in Fig. 1C). Throughout the article, the second parametric modulator (the difference regressor) is referred to as RPEDU. Missing trials were modeled separately. To account for possible confounds due to movement, we included the six realignment parameters, the first temporal derivative of the translational realignment parameters and a further regressor censoring scan-to-scan movement of >1 mm. At the second level, contrast images for RPESU and RPEDU were taken to a random-effects analysis. A full-factorial ANOVA contained the type of RPEs (RPESU/RPEDU) as the within-subject factor, and group as the between-subject factor.
Voxel-based morphometry.
Each subject's anatomical T1-weighted image was segmented into different tissue classes using the unified segmentation approach implemented in SPM8 (Ashburner and Friston, 2005). Modulated images of gray matter density were smoothed using an isotropic Gaussian kernel (6 mm full-width at half-maximum) and subjected to a random-effects model. The volume of gray matter, white matter, and CSF tissue classes were summed to gain an individual estimate of total intracranial volume, which was entered as a covariate in between-group comparisons. As there is strong evidence for pronounced cortical gray matter density loss in alcohol-dependent individuals (Beck et al., 2012), we first tested for differences in gray matter density between the patient group and the control group. The patient group was characterized by significantly reduced gray matter density (FWE corrected for the whole brain, p < 0.05) predominantly in a large cluster covering the cingulate cortex (see Table 7). Second, to control for differences in gray matter density as a potential confound of our fMRI results, we extracted gray matter density from the following two regions of interest: (1) based on the fMRI analysis, the conjunction of both RPEs across the entire sample (thresholded at FWE corrected, p < 0.05); and (2) an anatomically predefined mask of combining frontal lobe and cingulate cortex (obtained from AAL templates, WFUPickAtlas Toolbox).
Results
Behavioral raw data analyses
Correct choices
An ANOVA revealed a significant effect of phase (F = 21.76, p < 0.001) and group (F = 19.97, p < 0.001), and a significant group × phase interaction (F = 3.27, p = 0.04, Fig. 2C).

Decision-making task. A, Exemplary trial sequence. B, One of the stimuli was assigned with a reward probability of 80% and a punishment probability of 20% (vice versa for the other stimulus). Reward contingencies remained stable for the first 55 trials (prereversal block) and also for the last 35 trials (postreversal block). In between, reward contingencies changed four times (reversal block). C, Raw data results. Correct choices differed significantly as a function of phase (prereversal, reversal, postreversal, F = 21.78, p < 0.001). We observed a main effect group and a significant interaction of phase × group (F = 3.27, p = 0.04). Between-group post hoc t tests revealed that group differences were present in the reversal phase (t = 3.48, p = 0.001) and in the postreversal phase (t = 3.36, p = 0.001), but not in the initial stable prereversal phase (t = 1.69, p = 0.10). Error bars indicate Standard Errors of the Mean.
Win–stay and lose–shift
We further explored patients' deficit in correct choices by analyzing how often participants repeated choices after reward, “win–stay,” and shifted after losses, “lose–shift.” A between-group difference was observed on win–stay (t = 2.23, p = 0.03) with patients showing less stay behavior after wins (control subjects: mean, 0.93; SD, 0.06; patients: mean, 0.87; SD, 0.14). There was no difference in lose–shift (t = 0.25, p = 0.80).
Repeating choices despite recurrent negative consequences
We found a significant between-group difference (t = 2.63, p = 0.01) in repetition behavior after two successive losses (control subjects: mean, 0.11; SD, 0.08; patients: mean, 0.18; SD, 0.14); patients reiterated disadvantageous choices more often, despite negative consequences in preceding trials.
Computational modeling of behavior
Computational modeling: model comparison
Using random-effects Bayesian model selection (BMS) (Stephan et al., 2009) across control subjects and patients, the iDU model with κ as a free parameter, and with separate learning rates and temperatures for reward and punishment trials (αrew, αpun, βrew, βpun) peaked out of 14 models (XPiDU = 0.71, PPiDU = 0.27). The overall superiority of separate learning rates and temperatures for reward and punishment trials was also confirmed when grouping the 14 models in four families (1β1α, 2β1α, 2α1β, and 2α2β), with the first two families containing four models each (SU, DU, iDU, and Sutton-K1) and the latter two each consisting of three models (SU, DU, and iDU) because it is not straightforward to define the dynamic learning rate separately for reward and punishments (XP1α1β = 0, PP1α1β = 0.07; XP2β1α = 0.01, PP2β1α = 0.24; XP2α1β = 0, PP2α1β = 0.04; XP2α2β = 0.99, XP2α2β = 0.66).
Importantly, when running BMS for both groups separately across all 14 models, control subjects and patients differed regarding the model that explained their behavior relatively better (Fig. 3A, Table 2); control subjects were best explained by the iDU model that includes inference on the task structure given by the parameter κ, an individual weight of the degree of DU learning (XPiDU = 0.92, PPiDU = 0.27). Patients were relatively better explained by the model-free SU algorithm, which neglects an update of the alternative choice option (XPSU = 0.83, PPSU = 0.27). We verified that these group differences were not driven by a small subgroup of patients. Looking at individual relative model fit, 23 of 35 healthy control subjects were better explained by the iDU model than by the SU model, 25 of 43 patients were relatively better explained by the SU model than by the iDU model. Details regarding BMS can be found in Table 2, including log-likelihoods, log model evidence, and PPs and XPs for all 14 models separately for control subjects and patients. As requested by one of our reviewers, we fitted both groups separately, and this confirmed the model selection results as described above (control subjects: XPiDU2α2β = 0.56; PPiDU2α2β = 0.20; alcohol-dependent patients: XPSU2α2β = 0.76; PPSU2α2β = 0.27).

Computational modeling results. A, Bayesian model selection revealed that healthy control subjects were best explained by the iDU model, including a factor which weights the individual degree of inference (double-updating), whereas for alcohol-dependent patients, model evidence was maximal in favor of the model-free single-update model. Models with separate learning rates and temperatures for reward and punishment trials outperformed models without this distinction. B, Between-group comparisons on the inferred parameters derived from the best-fitting model (MANOVA) revealed a significant group difference on the parameters (F = 2.83, p = 0.03). Post hoc tests showed that the iDU punishment parameter was significantly lower in alcohol-dependent subjects compared with healthy control subjects (F = 7.89, p = 0.006). There were no significant group differences in any of the other inferred parameters of the model. Error bars indicate Standard Errors of the Mean.
Model selection results
Computational modeling: identifiability, absolute model fit, and simulated choice data
All reported quality checks refer to the iDU model, which was best fitting across all participants. First, the rank of the Jacobian matrix equaled the number of free parameters in the model, indicating the identifiability of the model (Bamber and van Santen, 1985, 2000). Correlations between all parameters were acceptable (r ≤ 0.36); only temperatures showed relatively strong correlations at r = 0.67 but were, however, consistently different for win and loss trials, in terms of being higher for wins than losses in all but two individuals. Second, adjusted McFadden's pseudo-R2 (R2 = 0.60) indicated reasonable absolute model fit. Only one healthy participant and six alcohol-dependent patients were not fit better than chance by any of the tested models. Notably, all relative model comparison results reported above were robust against excluding these participants who were not fitted better than chance (control subjects: XPiDU2α2β = 0.92, PPiDU2α2β = 0.27; patients: XPSU2α2β = 0.79, PPSU2α2β = 0.28). Third, choice data were simulated based on the inferred parameters of the best-fitting iDU model and tested in the same manner as the original empirical data to establish whether the model replicates group differences on choice behavior (correct choices, win–stay, repetition of punished actions). As we were interested in the replication of the empirically found effect, hypotheses were directed, and one-tailed tests were used. The model replicated the main effect of group on correct choices (t = 3.52, p < 0.001), as well as the group effect on win–stay rates (t = 3.20, p < 0.001) and on repetition behavior after punishment (t = 1.86, p = 0.03). Inferred model parameters did not recover the group × phase interaction observed in the raw data. Fourth, when refitting the simulated choice data, we observed strong correlations of modeling parameters derived from the empirical data and modeling parameters derived from the simulated data (correlation coefficients: αrew = 0.55, αpun = 0.87, βrew = 0.65, βpun = 0.79, κ = 0.80, Qi = 0.74).
Computational modeling: group differences on model parameters
We tested for between-group differences in individuals fit better than chance by subjecting the inferred parameters of the iDU model, the best-fitting model across both groups (Table 3), to a multivariate ANOVA (MANOVA) with group as the between-subject factor (patients vs control subjects). This MANOVA contained the following parameters, each separately for reward and punishment: learning rates for the update of chosen (αrew_c, αpun_c) and unchosen values (αrew_uc, αpun_uc, products of the weighting factor κ with αrew_c, and αpun_c), each multiplied by the temperature for reward or punishment trials, respectively. This revealed a significant effect of the between-subject factor group (F = 2.83, p = 0.03). We explored this group difference using post hoc t tests to compare each of the parameters between groups. In line with the raw data results, we found a significantly lower DU-weighted punishment parameter (αpun_uc × βpun, F = 7.89, p = 0.006; Fig. 3B), whereas none of the other parameters differed significantly between groups (group differences regarding learning rates of the simpler model-free SU algorithm, all p > 0.66). Note that the group difference on the DU-weighted punishment parameter was also present when comparing parameters derived from the less well fitting model, with only one temperature parameter for both reward and punishment trials (t = 2.35, p = 0.02).
iDU model: best fitting parameters
Association of modeling parameters with repetition of choices despite recurrent punishment
A multiple regression model with the perseveration score (repeating choices despite recurrent punishment) as the dependent variable, and the DU and SU parameters for reward and punishment, respectively, as predictors (R2 = 0.27; adjusted R2 = 0.24) revealed a significant negative association specifically of the DU punishment parameter with the perseveration score (β = −0.41, t = 2.79, p = 0.002). All other parameters did not significantly predict the perseveration score (all t values <|1.69|, all p values >0.10). This suggests that a deficit in double-update punishment learning, possibly conflated with decision noise in these very trials, as indicated by selective between-group differences in modeling parameters (κ by αpun_c by βpun) explains perseveration after recurrent punishment.
Functional imaging results
Neural signatures of single- and double-update learning
To explore neural signatures of this behavioral deficit, we analyzed the encoding of two types of RPEs for the chosen option, namely RPESU versus RPEDU. Effects for both types of learning signatures and their conjunction across both groups are illustrated in Figure 4, and in Tables 4, 5, and 6. For between-group differences, we tested for a type of RPE (RPESU/RPEDU) × group (patients/control subjects) interaction. The conjunction of both RPEs across the entire sample (thresholded at FWE-corrected p < 0.05 for the whole brain; Fig. 4, Table 6) was used to correct for multiple comparisons (at FWE-corrected p < 0.05 based on this search volume). The RPE type × group interaction reached significance in the mPFC (X = −10, Y = 62, Z = 12; t = 3.98; FWE-corrected for the conjunction, p = 0.01) and posterior cingulate cortex (X = 0, Y = −40, Z = 32; t = 3.72; FWE-corrected for the conjunction, p = 0.03). As post hoc contrast, we compared RPESU and RPEDU between groups. This confirmed significantly reduced coding of RPEDU signatures in patients in the mPFC (X = −8, Y = 62, Z = 12; t = 4.36; FWE-corrected for the conjunction, p = 0.003; X = −6, Y = 56, Z = 12; t = 3.68; FWE-corrected for the conjunction, p = 0.02; Fig. 5) and posterior cingulate cortex (X = −2, Y = −42, Z = 32, t = 3.72; FWE-corrected for the conjunction, p = 0.03) but no significant between-group differences in activation elicited by model-free RPESU. We verified that the result of significantly reduced coding of RPEDU signatures in patients in the mPFC was robust against excluding participants that were not fitted better than chance by any of the models. Indeed, when excluding these n = 7 participants, the group difference remained significant (X = −8, Y = 62, Z = 12; t = 4.24; FWE-corrected for the conjunction, ppeak = 0.001; and X = −6, Y = 56, Z = 12; t = 3.78; FWE-corrected for the conjunction, ppeak = 0.011).

Neural coding of single-update vs double-update signals across the entire sample. Across all participants (patients and control subjects), we observed model-free RPESU in bilateral ventral striatum, and medial and lateral prefrontal cortex (FWE-corrected for the whole brain, p < 0.05; Table 4). For the difference regressor RPEDU, we found effects in overlapping regions (bilateral ventral striatum, medial and lateral prefrontal cortex) and additionally in hippocampus and insula (FWE corrected for the whole brain, p < 0.05; Table 5). The conjunction of both contrasts revealed overlapping effects of RPESU and RPEDU, in bilateral ventral striatum, medial and lateral prefrontal cortex, and posterior cingulate cortex (FWE corrected for the whole brain, p < 0.05; Table 6). The latter was used as a search volume for small-volume correction of group differences. Effects are reported using a significance level of p < 0.05, FWE corrected for the whole brain. Activations are shown superimposed on an averaged gray matter mask of the entire sample. For display purposes, threshold is set at t > 5.
Neural signatures of single-update learning (RPESU) for both healthy control subjects and alcohol-dependent patients taken together at p < 0.05 FWE whole brain corrected
Neural signatures of double-update learning (RPEDU) for both healthy control subjects and alcohol-dependent patients taken together at p < 0.05 FWE whole brain corrected
fMRI whole-brain results for the conjunction of single-update and double-update learning signals across both groups
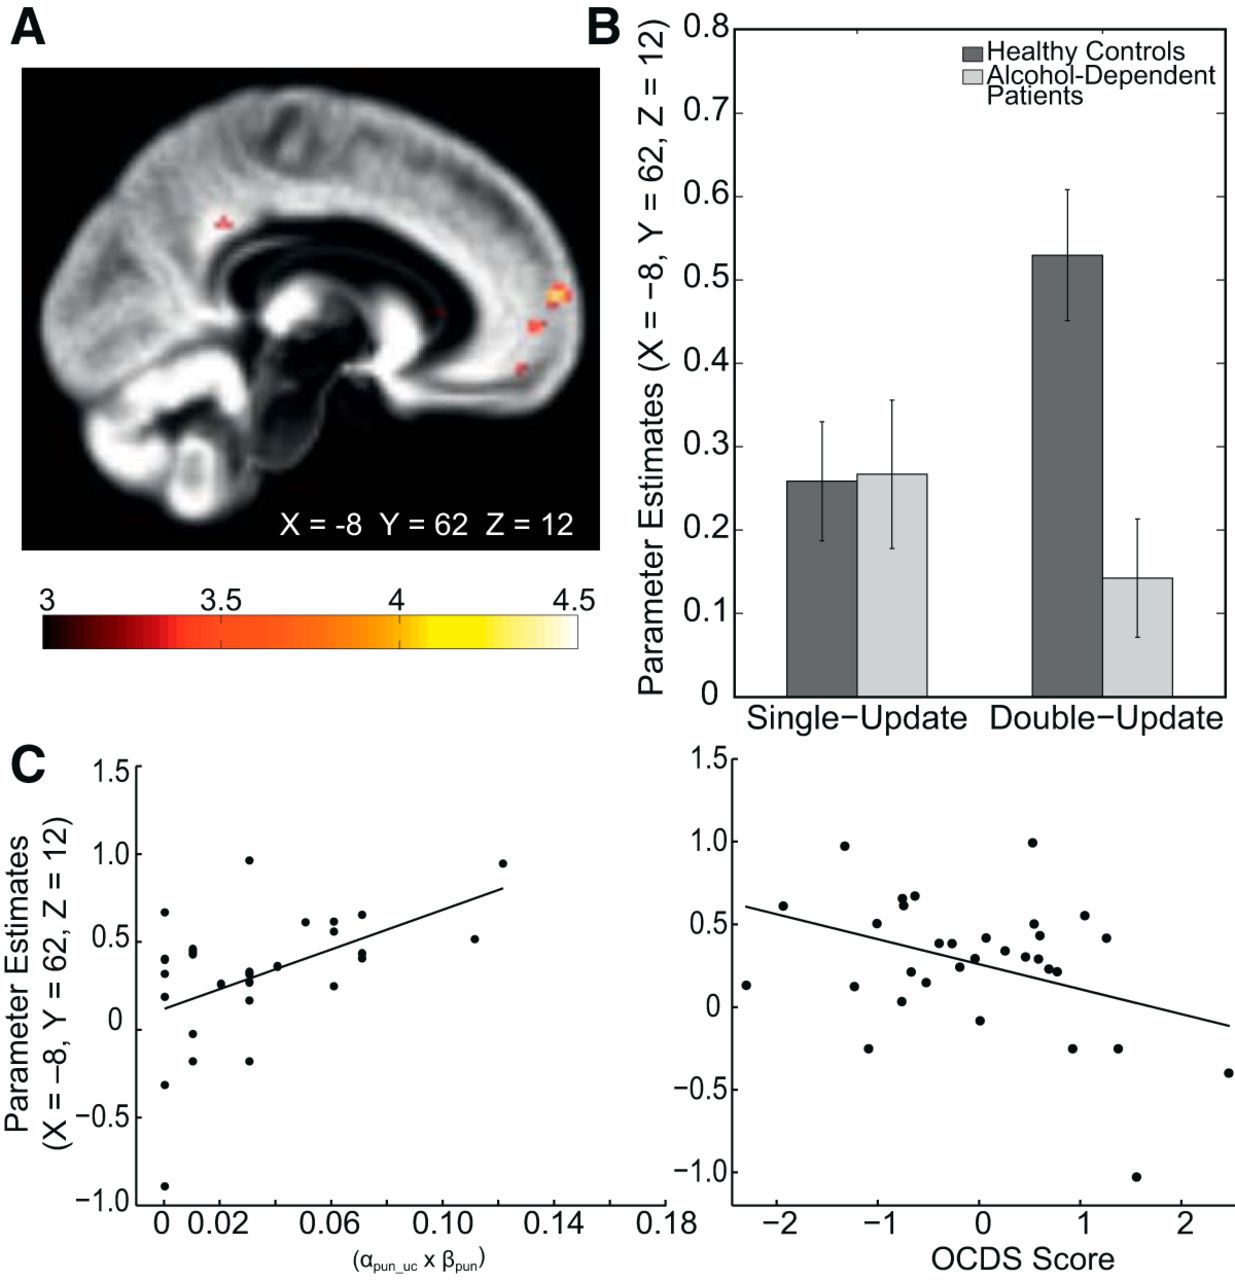
Group differences in the neural coding of single-update vs double-update signals. A, Reduced inference signatures were found in the mPFC in alcohol-dependent patients compared with healthy control subjects (X = −8, Y = 62, Z = 12; t = 4.36; FWE-corrected for the conjunction, p = 0.003; X = −6, Y = 56, Z = 12; t = 3.68; FWE corrected for the conjunction, p = 0.02) and posterior cingulate cortex (X = −2, Y = −42, Z = 32; FWE corrected for the conjunction, p = 0.03; t = 3.72). No group difference regarding model-free signatures was found. For display purposes, thresholded at t > 3. B, Plot of parameter estimates at the peaks of the group difference in the mPFC. C, In patients, parameter estimates from an 8-mm-radius sphere around the peak coordinate (X = −8, Y = 62, Z = 12) of the group difference correlated with the behavioral deficit in double-update learning after punishments (left: Spearman's r = 0.49, p = 0.006). A multiple regression model including all applied measures of disease severity as explanatory variables predicting these parameter estimates revealed the sum score of the obsessive-compulsive drinking scale as the only significant predictor (OCDS; β = −0.64, t = 2.64, p = 0.014; right). Here, we plot Studentized residuals of the OCDS with respect to other disease severity measures.
In further analyses, we were interested in exploring associations of the observed reduced neural representation of RPEDU in the mPFC with observed behavioral deficits and symptoms. Thus, mean parameter estimates at the peak of the between-group difference (X = −8, Y = 62, Z = 12, surrounded with an 8 mm sphere) were extracted to correlate them, for both groups separately, with the DU punishment parameter αpun_uc by β_pun. Note that this approach is valid as we were specifically interested in associations of the neural reduction observed in patients versus control subjects (i.e., the neural group difference) with patients' behavioral deficit and symptoms. We did, however, not use the peak coordinate of the group difference to test further between-group hypotheses on the neural level, which would lead to circular inference, or “double dipping” (Kriegeskorte et al., 2009).
In patients, this revealed a positive association indicating that the attenuated mPFC double-update learning signature was related to a lower DU punishment parameter (Spearman's r = 0.493, p = 0.006; Fig. 5C left panel). No significant correlation was found in control subjects (Spearman's r = 0.090, p = 0.61). This confirms a link between the observed behavioral deficit in updating alternative options after punishment and the reduction of DU signatures in mPFC in patients.
Relationship between mPFC double-update learning signatures and symptom severity
We tested for an association of the reported neural alterations with symptom severity in alcohol-dependent patients. We performed a linear regression analysis with mean parameter estimates of the global maximum of the observed group difference in mPFC (at the peak voxel X = −8, Y = 62, Z = 12, with an 8-mm-radius sphere) as the dependent variable and the applied self-rating measurements of addiction severity (Table 1) as predictor variables, as follows: (1) units of alcohol consumed within 4 weeks before treatment commenced (TLFB); (2) OCDS; (3) ACQ; and (4) AUDIT. This revealed the OCDS score as having a significant negative association with the neural mPFC DU learning signature (β = −0.64, t = 2.64, p = 0.01; Fig. 5C right panel). Patients reporting a higher level of obsessive-compulsive drinking habits showed, on the neural level, lower coding of inference components regarding unchosen choice options. An additional regression model with the same independent variables and the DU punishment parameter as the dependent variable did not indicate any significant results (p values >0.52).
Covariance analyses for possible confounding factors
To adjust for possible confounding influences, the following variables were included as covariates in the behavioral (correct choices and the DU punishment learning parameter) and fMRI analyses (RPE type × group interaction, group difference on RPEDU coding): smoking status; depression score (Beck's depression inventory; Beck et al, 1996); and the composite measure of neurocognitive functioning as well as gray matter density (voxel-based morphometry, based on a functional and an anatomically predefined mask of frontolimbic structures). All reported results remained significant when adjusting for these possible confounds (all p values <0.05).
Voxel-based morphometry: group differences
Discussion
We provide novel insight into mechanisms of maladaptive decision-making and behavioral adaptation in patients with alcohol dependence and its underlying neural substrates. Our results support the view of intact model-free learning and behavioral control in addiction associated with a deficit in using environmental structure to guide decision-making: choice behavior in patients was best explained by a model-free RL algorithm, which neglects the updating of alternative choice options. This was due to a specific reduction in the updating of the alternative option after punishments. On the neural level, the learning signature of such a double-updating mechanism was reduced in patients' mPFC and correlated with the observed behavioral deficit in updating alternative choices as well as obsessive-compulsive drinking habits.
Disrupted behavioral adaptation in addiction
Deficits in cognitive flexibility are known in patients experiencing addiction (Bechara and Damasio, 2002; Garavan and Stout, 2005; Ersche et al., 2011; Goldstein and Volkow, 2011). In line with this, we demonstrate that alcohol-dependent patients show diminished behavioral adaptation in a dynamic environment. Crucially, by using computational modeling, we provide a mechanistic account for this deficit: alcohol-dependent patients are specifically impaired in their capacity to integrate alternative choice options and to accurately track the value of an alternative option after having received punishment. Put differently, patients show less consideration of “what might have been good instead”: formally, after patients had received punishment for the chosen option, they did not increase the values of the alternative option as would have been appropriate according to the anticorrelated task structure, which was captured by a significantly lower double-update punishment parameter in patients. This finding derived from computational modeling can account for the overall impairment in correct decisions, reduced win-staying, and the repetition of choices despite successive punishment, as suggested by our simulation analysis. Therefore, our observation suggests that simpler, model-free, single-update learning is intact in addiction (such that the updating of chosen values after rewards and punishments remains relatively unaffected), but that updating of alternative, unchosen values is abolished after punishment. Such inference on what might have happened goes awry when values need adjustment after negative feedback, and thus potentially advantageous alternative choice options are neglected when making decisions. The finding is in line with recent animal models of addiction suggesting a specific deficit in mentally simulating outcomes not directly experienced and a disturbed integration of multiple predictions (Lucantonio et al., 2014). Intriguingly, this behavioral deficit resonates well with clinical observations and diagnostic criteria of addiction describing the maintenance of disadvantageous behaviors despite negative consequences. Importantly, our finding goes beyond previous studies on behavioral adaptation linking addiction to blunted neural responses associated with performance errors and reduced error awareness (Paulus et al., 2008; Goldstein et al., 2009): a disturbed inference process regarding the update of alternative choice options may constitute one plausible explanation for these deficits.
In studies applying tasks similar to the one used here, inference about alternative choice options has been previously linked to a goal-directed or model-based control system (Hampton et al., 2006; Bromberg-Martin et al., 2010). An alternative explanation includes that double-update inference does not arise from a full model-based system but rather reflects temporal difference learning about the relationship of choice values (Shohamy and Wagner, 2008; Wimmer et al., 2012; Doll et al., 2015). In this framework, our results could be interpreted as an impairment in generalizing from one stimulus to another. Either way, the capacity to simultaneously update multiple decision values, including those of unobserved outcomes, might be regarded as sine qua non for building and using an internal model of the environment, which is important for goal-directed or model-based control. Using sequential decision-making, reduced model-based behavioral control was observed in alcohol-dependent patients (Sebold et al., 2014), although this impairment was attenuated when adjusting for cognitive deficits. In the present study, the impairment in updating alternative choice options remained significant when adjusting for cognitive capacities, suggesting a specific characteristic for alcohol dependence rather than an epiphenomenon of a global impairment. Thus, our finding of reduced inferential capacities appends prominent theories proposing a shift from goal-directed to habitual behavioral control in addiction (Everitt and Robbins, 2005; Dayan, 2009; Lucantonio et al., 2012).
Blunted mPFC double-update learning signatures in alcohol-dependent patients
Patients were characterized by reduced coding of double-update RPE signals in mPFC. Reduced representation of these inference signatures in patients' mPFC was related to the observed behavioral deficit and to obsessive-compulsive drinking habits. In line with our findings, alcohol-dependent patients showed hypoactivation in a similar region for a contrast assessing goal-directed learning during a different instrumental learning task (Sjoerds et al., 2013). In healthy individuals, the medial prefrontal and orbitofrontal cortex is known to encode model-based values computed “on the fly,” which allows behavioral flexibility (Haber and Behrens, 2014). In consonance with this, the mPFC has been identified as a key region for flexible behavioral adaptation and model-based evaluation (Hampton et al., 2006; Daw et al., 2011). Specifically, this region has been linked to the integration of computations from habitual and goal-directed systems (Lee et al., 2014). Interestingly, Lee et al. (2014) identified computational signals for the reliability of both systems in the mPFC. Reliability signals are thought to be used by an arbitration mechanism to allocate the degree of control exerted by one of the two systems at a given point in time. Our observation of reduced double-update signatures at nearby coordinates may support a view on behavioral control in addiction that Lee et al. (2014) invite in their discussion: a failure of the arbitration process, namely the ability to appropriately parse behavioral control between different modes. Remarkably, reduced coding of double-update inference components in alcohol-dependent patients' mPFC remained significant when adjusting for reductions in gray matter density supporting the view of a specific neural signature of abolished inference. This interpretation is strengthened by correlations of mPFC signatures with reduced double-update learning rates after punishment and obsessive drinking habits in patients. Together, reduced double-update prediction error coding in alcohol-dependent patients' mPFC may indeed account for their decreased behavioral flexibility and constitute one piece in the puzzle of obsessive alcohol consumption despite negative consequences.
Neurochemical considerations
Blunted presynaptic dopamine function was found in alcohol-addicted patients (Martinez et al., 2005), and lower levels of ventral striatal presynaptic dopamine were demonstrated to be associated with a lower degree of model-based behavioral control and diminished coding of model-based prefrontal signatures during sequential decision-making (Deserno et al., 2015b). Thus, low levels of presynaptic dopamine could hypothetically explain the reported findings to some extent. Further, reduced dopamine D2 receptor availability is among the best-established findings in addiction (Volkow et al., 1990; Heinz et al., 2004). Low levels of D2 receptors were linked to an impairment of re-evaluating decisions via the prefrontal cortex after negative feedback (Frank et al., 2004; Goto and Grace, 2005). Recent evidence from an animal model indicates that chronic alcohol-induced malfunction of, specifically, mPFC D2/D4 receptors disrupts flexible behavioral adaptation (Trantham-Davidson et al., 2014), which is in consonance with the presented findings. Interestingly, a behavioral study in humans showed that genetic variability in dopaminergic neurotransmission relates to perseveration during reversal learning (den Ouden et al., 2013), also supporting the view that dopamine could at least partially account for the behavior observed in alcohol-dependent patients.
Limitations
Whether diminished inference about alternative choice options arises as a consequence of long-term alcohol consumption or reflects a predisposition factor for the development of addictive behavior cannot be elucidated by a cross-sectional design. Groups differed in terms of general cognition, smoking status, and gray matter density even though our results were robust when adjusting for these variables. Cross-sectional studies in at-risk populations (Ersche et al., 2010; Reiter et al., 2016), and longitudinal designs are warranted to track the influence of dysfunctional behavioral control systems across different stages in the development of addiction. It is to be noted that our model was not able to capture one specific aspect of the observed choice behavior, namely the group × phase interaction on correct choices due to particularly reduced performance in the middle and last phase. Additional analyses of reaction times, missed choices, and self-report data consistently showed that this was not due to a general decline in performance over the course of the experiment in patients. Apart from this aspect, all empirical choice data effects could be replicated by the model, and measures of absolute model fit and identifiability indicated that the applied models served as a good explanation for the observed behavior.
Although the best-fitting model was technically invertible, as indicated by our identifiability checks, we have to caution that there is a lack of specificity within these parameters with respect to which specific parameter determines certain aspects of the choice behavior, especially with regard to the decision noise and the learning rates. We therefore used multiplications of those parameters to ensure stable between-group comparisons (Daw, 2009)
Summary
In conclusion, after punishment, alcohol-dependent patients showed a deficit to infer and integrate alternative choice options in their decisions. Our data provide the first neuroimaging support for reduced coding of this double-update inference process in the mPFC—a key region for flexible behavioral control—underlying this deficit. The same mPFC signatures were negatively related to obsessive-compulsive drinking habits. The computational psychiatry account applied here improves our understanding of the perplexing question of why addicted individuals continue drug consumption despite negative consequences.
Footnotes
This study was supported by the Max Planck Society and by grants from the German Research Foundation awarded to F.S. (DFG SCHL1969/1-1, DFG SCHL 1969/2-2). We thank all of the patients who participated in this study. We also thank T. Dieterlen, K. Hudl, M. Kerkemeyer, R. Kratzer, L. Luettgau, C.D. Radenbach, T. Schmidt, C. Steffler, H. Teller, and T. Wilbertz for their assistance in recruitment and data acquisition. In addition, we thank H. Schmidt-Duderstedt for her help in designing the figures, E. Kelly for proofreading, and S. Valk for helpful comments on an earlier version of this manuscript.
The authors declare no competing financial interests.
- Correspondence should be addressed to Andrea M. F. Reiter, Max Planck Institute for Human Cognitive and Brain Sciences, Stephanstrasse 1a, 04103 Leipzig, Germany. reiter{at}cbs.mpg.de


