

Abstract
The olfactory system senses odors, but not exclusively, as shown over the past years. It also registers other modalities such as temperature and pressure. However, it remains unknown how widespread these sensitivities are across species and how strongly their processing is interconnected with the processing of odors. Here, we present data on the β-glomerulus in the olfactory bulb of Xenopus laevis tadpoles. We show that this glomerulus possesses an unusually broad response pattern to a large number of amino acids. The β-glomerulus uses the classical cAMP-mediated pathway, as suggested by its sensitivity to forskolin. This finding was unexpected because amino acid-sensitive olfactory sensory neurons of Xenopus commonly function in a cAMP-independent manner. Furthermore, we show that the β-glomerulus also reacts to pressure pulses delivered to the olfactory mucosa. These mechanical stimuli induce responses with profiles having typical dose–response and adaptation curves. Finally, whereas the mechanosensitivity in the glomerular layer was observed repeatedly in the β-glomerulus only, mechanosensitive modulation of mitral cells and their postsynaptic neuropils was found on a larger scale. Some mitral cells closely followed the response time course of the β-glomerulus, whereas many others were strongly inhibited by short pressure pulses. In conclusion, our data demonstrate the existence of one glomerulus sensitive to both a large number of amino acids and pressure pulses and show that the processing of pressure pulses is intertwined with odor processing.
SIGNIFICANCE STATEMENT We present a glomerulus in the olfactory bulb (OB) activated by very different stimuli, namely mechanical stimuli to the olfactory mucosa and a large number of amino acids. This unusual sensitivity is conveyed to the second-order neurons in the OB. Pressure sensitivity of olfactory sensory neurons has been shown recently in mice. Along with temperature sensitivity found in the olfactory system of mice and Xenopus laevis tadpoles, a discussion arose about the influence of these modalities on odor coding. Our results suggest that mechanosensitivity may be a general feature in olfactory systems. The pressure and broad amino acid sensitivity is not only focused to one glomerulus, but is also integrated in the odor processing of the OB's network.
- calcium imaging
- line illumination microscopy
- mechanosensitivity
- olfaction
- subtraction imaging
- Xenopus laevis
Introduction
Odors and pheromones are detected in the olfactory mucosa (OM) and the vomeronasal organ (Munger et al., 2009). In addition to these classical stimuli, the olfactory system appears to be endowed with temperature sensitivity and mechanosensitivity. In the mouse, for instance, changes in temperature are detected in the Grueneberg ganglion (Mamasuew et al., 2008; Schmid et al., 2010) and the olfactory bulb's (OB's) necklace glomeruli receive input from the Grueneberg ganglion (Haas et al., 2001; Fuss et al., 2005; Koos and Fraser, 2005; Roppolo et al., 2006; Storan and Key, 2006; Pérez-Gómez et al., 2015) and guanylyl cyclase type D cells in the main olfactory epithelium (Juilfs et al., 1997; Leinders-Zufall et al., 2007; Cockerham et al., 2009). In Xenopus laevis tadpoles, one glomerulus has been reported to be sensitive to drops in temperature (Kludt et al., 2015) and this temperature-sensitive glomerulus belongs to a distinct small cluster of glomeruli located medioventrally in the glomerular layer (Gaudin and Gascuel, 2005). Olfactory sensory cells sensitive to mechanical stimulation have been identified in the septal organ and in the main olfactory epithelium of mice (Grosmaitre et al., 2007, 2009; Connelly et al., 2015). However, whether and how this mechanosensory information is conveyed to the OB is as yet unknown.
Generally, a change in the flux of odorants in the OM could affect the probability of odorants binding to olfactory receptors and, as a consequence, most glomeruli might show activity induced by flow changes. Therefore, we set out here to investigate to what degree mechanical stimulation of the Xenopus OM is conveyed to the OB.
In a nose–brain preparation, which allows stimulation of the OM and imaging the stimulus responses in the OB, we used line illumination microscopy (Junek et al., 2009; Mei et al., 2012) and activity correlation imaging (ACI) (Junek et al., 2009) to observe mechanosensitivity in the OB. Contrary to expectation, we found that the mechanosensitivity was confined to one glomerulus per OB, the so-called β-glomerulus in the nomenclature of Gaudin and Gascuel (2005), whereas other glomeruli were insensitive to flux or pressure changes in the OM. The very same glomerulus also showed a broadly tuned sensitivity to a number of amino acids, suggesting the presence of a general amino acid sensor in the olfactory system of Xenopus. Finally, we show that the activity of the β-glomerulus affected extended parts of the OB's network.
Materials and Methods
Animals.
Xenopus tadpoles of either sex and of stage 50–56 (Nieuwkoop and Faber, 1994) were used, in agreement with the guidelines approved by the Göttingen University Committee of Ethics in Animal Experimentation.
Solutions.
In all experiments, brain preparations were placed under a flow of standard Ringer's solution containing the following (in mm): 98 NaCl, 2 KCl, 1 CaCl2, 2 MgCl2, 5 glucose, 5 Na-pyruvate, and 10 HEPES. The pH and osmolarity were adjusted to pH 7.8 and 230 mOsmol l−1, respectively. All odorant mixtures were diluted in Ringer's solution and used for up to 7 d. Forskolin was used as an activator of the cAMP cascade in olfactory sensory neurons (OSNs) at a concentration of 15–25 μm.
The individual amino acids were used at a concentration of 200 μm if not stated otherwise. The applied mixtures were based on Caprio and Byrd (1984), Manzini et al. (2007a), and Kludt et al. (2015). The chemicals were purchased from Sigma-Aldrich or Merck. The amino acid mixture contained the following at a concentration of 200 μm each: l-alanine (Ala), l-arginine (Arg), l-cysteine (Cys), l-glycine (Gly), l-histidine (His), l-isoleucine (Ile), l-leucine (Leu), l-lysine (Lys), l-methionine (Meth), l-phenylalanine (Phe), l-proline (Pro), l-serine (Ser), l-threonine (Thr), l-tryptophan (Trp), and l-valine (Val).
The amines mixture contained the following at a concentration of 200 μm each: 2-phenylethylamine, tyramine, butylamine, cyclohexylamine, hexylamine, 3-methylbutylamine, N,N-dimethylethylamine, 2-methylbutylamine, 1-formylpiperidine, 2-methylpiperidine, N-ethylcyclohexylamine, 1-ethylpiperidine, and piperidine.
The alcohol mixture (Altner, 1962) contained the following at 200 μm each: beta-ionone, citral, β-phenylethyl alcohol and gamma-phenylpropyl alcohol.
The bile acids were purchased from Sigma-Aldrich and contained taurocholic acid (200 μm) and traces of glycocholic, dexoxycholic and other bile acids.
Electroporation.
Staining of OSNs by electroporation was performed based on the procedure described by Junek et al. (2010). Briefly, the tadpoles were anesthetized using a 0.02% MS-222 (w/v) solution for 1 min and then fixed on a silicone cushion. The area surrounding the nasal cavities was dried and crystals of a 10 kDa dextran-conjugated dye (Alexa Fluor 488, Alexa Fluor 594, Alexa Fluor 647, Alexa Fluor 680, or calcium green; Invitrogen) the size of the nasal cavity were placed into the cavities, where they dissolved. Finally, a platinum electrode was entered as a cathode into the cavity and an anode was positioned nearby on the skin. A series of six 20 V pulses, each with a duration of 20 ms, was delivered at 2 Hz. Afterward, the procedure was repeated for the second nasal cavity. The tadpoles were then transferred to an aquarium and kept under low-light conditions. They were used for experiments within the 2–7 d after the electroporation.
Whole-mount preparation.
Tadpoles were anesthetized by placing them into a mixture of water and ice for ∼3 min. Afterward, the animal was decapitated and a tissue block comprising both nasal cavities, the olfactory nerves, and the forebrain containing the OB was cut out. Access to the OB for imaging and staining was achieved by turning the ventral side of the preparation upward and removing the connective tissue above the telencephalon. Subsequently, the sample was transferred to a recording chamber filled with Ringer's solution and fixed by placing it under nylon fibers spanned over a U-shaped platinum frame.
Bolus loading.
For staining mitral/tufted (M/T) cells, bolus loading was used as described by Junek et al. (2010). Ringer's solution containing Fluo8-acetoxymethyl (Fluo8-AM) at a concentration of 250 μm, as well as 5% DMSO (v/v) and 1% Pluronic F-127 (w/v), was filled into a patch pipette with a tip diameter of 1–5 μm. The pipette was then inserted into the M/T cell layer of the OB and the dye was pressure ejected for ∼10 min at 100–200 hPa, the precise value depending on the size of the pipette tip. The procedure was repeated up to three times per OB at different locations. After the last injection, the sample was left in Ringer's solution for ∼30 min before starting the measurements to allow for uptake and intracellular de-esterification of the AM-coupled dye.
Pressure and odor application.
To deliver odorants to the epithelium of the nose–brain preparation, a constant flow of Ringer's solution was maintained through the recording chamber. Ringer's solution entered the chamber by means of a custom-built funnel applicator specifically designed to avoid changes of the flow dynamics while adding odorants to the flow (Schild, 1985). The outlet of the funnel was placed close to the epithelium. For stimulus application a modified electronic pipette (HandyStep electronic; Brandtech Scientific) that received a transistor-transistor logic signal from the data acquisition system was used for triggered stimulus release. Small application volumes of 400 μl were used. The reproducibility of responses was checked regularly by repeated application of the same stimulus over the course of the measurements.
Pressure pulses were applied by a pipette connected to a reservoir of odor-free Ringer's solution. The pipette tip with a diameter of 350 μm was placed ∼900 μm in front of the epithelium. The relatively large pipette diameter ensured that the puffs affected the whole epithelium. Puffs of odor-free Ringer's solution were applied in a range of 0–300 hPa with a pressure ejection device (PDES-02L; npi Electronic). The amplitude of the applied pressure was recorded over the course of the measurement. Furthermore, the flow speed was determined by measuring the volume of the outflow and the diameter of the pipette opening. The applied pressure led to a flow speed in the range of 0–0.56 m/s recorded directly at the pipette tip and the relationship between pressure and flow rate was approximately linear in this range. The solution ejected through the pipette tip emerged under certain angles and formed cones. Their diameters at the recording site decreased when the pressure amplitude was increased. Therefore, the pressure amplitude at the recording site was smaller than the applied pressure. The diameter of the cone at the location of the epithelium was measured for different pressure amplitudes and all measured values corrected accordingly.
Line illumination microscopy and subtractive imaging.
To perform fast z-stack recordings of the OB in one measurement, a custom-built line illumination microscope (LIM) was used. In addition to the features of the LIM described by Junek et al. (2009), a pair of acousto-optic modulators (AA Opto-Electronic) was added to allow for fast switching between two excitation lasers (Coherent, Sapphire) at 488 and 561 nm, thereby enabling dual channel-recordings. Furthermore, the setup was equipped with an sCMOS camera (Hamamatsu, OrcaFlash) for fast and sensitive readout. Because we used the camera pixels as a confocal aperture, we were able to evaluate data either from one row or a number of adjacent rows of pixels, we were thus able to choose a posteriori the size of the confocal aperture. Further, subtraction imaging was performed in a similar way as described previously in Sheppard and Cogswell (1990), Bertero et al. (1991), Gauderon and Sheppard (1998), Boyer and Sarafis (2001), and Sánchez-Ortiga et al. (2012) or for a line-scanning application in Poher et al. (2008). In subtraction imaging, the image taken with an open confocal aperture is subtracted from the image obtained with closed confocal aperture, which improves the optical sectioning. Instead of subtracting a full recording with open pinhole, we only subtracted the camera lines at the edge of the aperture formed by the active pixels on the camera chip, which contain the highest ratio between out-of-focus and in-focus light, as follows:
 where Is denotes the intensities of the pixel line after subtraction, I0 the central camera line corresponding to a normal confocal recording with closed aperture, and I−1,+1 the camera lines at the border of the active pixel area on the camera chip. The scaling factor γ was adjusted in a way that the subtraction did not result in negative values in pixels containing structure. The active pixel area of the camera was chosen to reflect an open aperture state of 6.6 arbitrary units (AU) and the central camera line corresponded to a confocal aperture of 0.22 AU. Because all camera lines were recorded in one acquisition step, no additional measurements were required and no additional stress was applied to the preparation in terms of exposure time.
Image processing.
Image processing was performed with custom-written scripts in MATLAB (The MathWorks). Calcium-related increase in the fluorescence signal was displayed as ΔF/F and calculated after camera background correction as follows:
 where F0 represents the average fluorescence signal over the first 2–3 s of the measurement before stimulus application and consisted of at least 10 data points. For activity maps, the ΔF/F values were computed on a pixel-by-pixel basis and the images were low-pass filtered.
For determining peak responses, a moving average filter (5 frames wide) was applied to the ΔF/F traces before picking the maximum value within a stimulus interval of 8 s after stimulus onset.
If necessary, the data were corrected for shift and for bleaching. Shift correction was performed with a custom-written MATLAB script described previously in Kludt et al. (2015). Briefly, the non-normalized cross-correlation function was calculated between consecutive images f(x,y) and g(x,y) as follows:
 The function was multiplied with a correction factor to account for the applied zero padding. To obtain the necessary amount of shift in a subpixel resolution, the maximum of the cross-correlation function was determined by Gaussian fitting and the shifting was applied by 2D linear interpolation.
Photobleaching was corrected only if necessary and performed by applying a Legendre low-pass filter (Bao and Schild, 2014). Alternatively, for experiments containing multiple stimulations within one measurement in which peak amplitudes had to be determined, the measurement was split in short segments containing the individual stimuli and ΔF/F was calculated for these segments individually. This proved more stable than applying the bleach correction over long recordings.
Dose–response fit.
In Figure 2C, the average values were fitted in MATLAB (The MathWorks) with a sigmoidal function as follows:
 where x refers to the applied pressure strength and a and b are the offset and response maximum, respectively. The fit was used to determine the half-maximum c and the width w of the distribution.
Response criterion.
An increase in fluorescence was attributed to a preceding stimulus if the following requirement was met:
 That is, if the maximum of the intensity, I(t), in the region of interest (ROI) during the prestimulus interval t0 − ts, was smaller than the average intensity value over the interval, ts − te, where the latter was chosen to include the 4 s after the stimulus application.
Neighborhood and activity correlation.
Calculating a neighborhood correlation map generates contrast based on activity and highlights connected areas exhibiting similar activity patterns. Pixels containing only noise are most often uncorrelated and are thus assigned a low value in the neighborhood correlation map. Activity correlation does the same but is based on a reference trace instead of spatial proximity. Both methods are used for Figure 5.
The neighborhood correlation map was calculated as described previously in Manzini et al. (2007a) by cross-correlating the intensity trace at a pixel with those of its neighbors. This results in eight correlation values, which were averaged and provide the value at the position of the central pixel.
The activity correlation map was calculated as described in Junek et al. (2009). Briefly, a reference trace r(t) has to be selected containing the intensity signal over time of a ROI (e.g., the β-glomerulus). The cross-correlation between each individual pixel and the reference trace is then calculated as follows:
 where N is the number of time points of the measurement and vi(tn) is the intensity of the i-th pixel at the time tn. Neighborhood and activity correlation maps were low-pass filtered.
Results
We performed functional 2D and 3D imaging experiments in a nose–brain preparation obtained from Xenopus tadpoles (Fig. 1A,B; see Materials and Methods). After electroporation of the OM, a horizontal section through the glomerular layer revealed a lateral, medial, and intermediate layer and a small cluster of glomeruli (Fig. 1C, Gaudin and Gascuel, 2005; Manzini et al., 2007b). Applying amino acids, amines, forskolin, cold Ringer's solution, or pressure pulses as stimuli to the OM resulted in responses of the OB. These are shown as ΔF/F maps in Figure 1D. Amino acids, for instance, stimulated predominantly glomeruli in the lateral cluster (“AA-Mix” in Fig. 1D), whereas a cold Ringer's solution leading to a drop of ∼1°C at the mucosa affected only the γ-glomerulus in the small cluster (“Cold” in Fig. 1D). The β-glomerulus clearly responded to three types of stimuli: (1) a mixture of amino acids; (2) a pressure pulse applied through a pipette positioned in front of the nasal cavity (Fig. 1A), thus leading to a rapid increase of the flux onto the OM; and (3) forskolin, known to activate the cAMP pathway in OSNs (Frings and Lindemann, 1990; Kashiwayanagi and Kurihara, 1995; Manzini and Schild, 2003). Odorant-free Ringer's solution was used as a control stimulus (Fig. 1D, top right). Although amino acid-sensitive OSNs in Xenopus do not normally respond to forskolin (Manzini and Schild, 2003), the β-glomerulus was activated by both forskolin and amino acids. We therefore tested various other potential stimuli to determine whether any of the odorants that are typically registered by OSNs possessing the cAMP cascade also elicit responses. The β-glomerulus did not respond to any of the following: mixture of amines (5 preparations), cold Ringer's solution (4), mixture of alcohols (4), bile acids (4), or Ringer's solution with a decreased pH of 7.5 (5). The β-glomerular responses to the three effective stimuli mentioned above displayed different dynamics. Forskolin application triggered long-lasting responses, whereas pressure pulses brought about short Ca2+ peaks, more closely following the time course of the stimulus (Fig. 1E). Under amino acid stimulation, the duration of Ca2+ responses ranged from a few seconds to 10 s after stimulus onset.
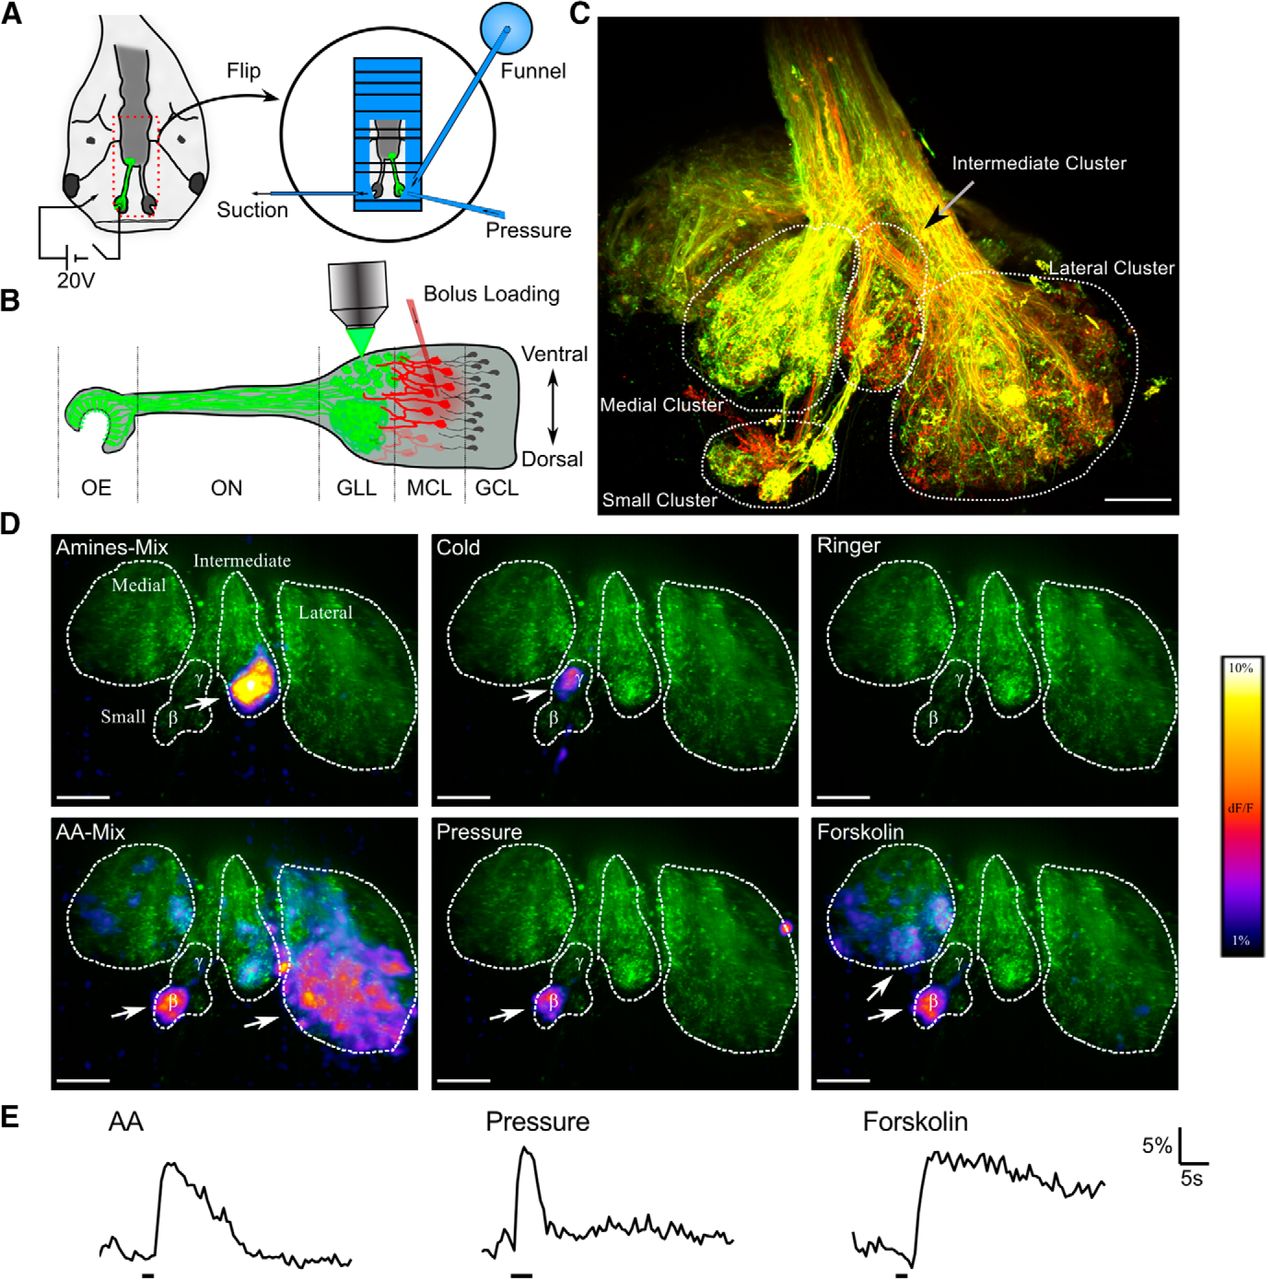
Response spectrum of the β-glomerulus. A, Schematic of preparation and electroporation. Electroporated fibers are shown in green. The dashed red line indicates the nose–brain preparation, which is flipped and then moved to a recording chamber. Odorants were added through a funnel application system. An additional pipette placed in front of the OM was used for the delivery of pressure pulses. B, Overview of the olfactory system in premetamorphic Xenopus larvae. The OSN axons (green) form glomeruli in the ventral part of the OB and an intermingled fiber network in its dorsal part. Mitral cell dendrites (red) innervate the glomeruli in the glomerular layer (GLL). GCL, Granule cell layer; MCL, mitral cell layer; OE, olfactory epithelium; ON, olfactory nerve. C, OB after electroporation with Alexa Fluor 594 and Alexa Fluor 680. The image is a maximum-intensity projection of a 145-μm-thick volume and was recorded with an LSM 780 (Zeiss). Scale bar, 50 μm. D. Typical response patterns of the OB. The basal fluorescence of calcium-green-stained axons is displayed in green. The maximal ΔF/F maps for the different stimuli are overlaid. The β- and the γ-glomerulus are indicated. White arrows indicate the strongest responding regions. Images are maximum intensity projections of a 60-μm-thick volume. Scale bar, 50 μm. E, Typical response traces of the β-glomerulus. Bars below the traces indicate stimulus delivery.
The response dynamics of the β-glomerulus to pressure pulses was consistent over trials and showed no adaptation for interstimulus intervals of 30 s (Fig. 2A). Although no glomerular responses to pressure pulses were found in the lateral cluster (e.g., Fig. 2A, last panel), we occasionally observed fibers responding to pressure puffs in the medial cluster. The β-glomerulus was, however, the only glomerulus that reacted consistently in different preparations (pressure regime, 50–150 hPa). For long-lasting pressure pulses, the responses showed a clear adaptation (Fig. 2A, middle). Increasing or decreasing the amplitudes of the pressure pulses led to similar increases or decreases in response amplitudes (Fig. 2B). Although the response amplitudes showed some fluctuations, repeated experimental trials resulted in a dose–response curve with a half-maximum pressure response at 78 ± 18 hPa (Fig. 2C, n = 8 preparations). [Ca2+] increases in response to mechanical stimulation were always observed throughout the whole neuropil and were not limited to single fibers. To further investigate whether the same OSN axons responded to stimulation with amino acids and pressure pulses, we obtained 3D recordings of the β-glomerulus. The ΔF/F peak response maps revealed [Ca2+] increases in the same regions for both stimulus qualities (Fig. 2D). Note that single fibers innervating the β-glomerulus were clearly responding to both stimuli (arrowheads in Fig. 2D).

Response of the β-glomerulus to mechanical stimulation at the OM. A, ΔF/F traces (black) together with the applied pressure changes (red). The trace on the left shows the response of the β-glomerulus to repeated pressure applications of constant amplitude. The middle plot depicts the adaptation of the β-glomerulus to a long-lasting pressure stimulus. Right plot shows the ΔF/F signal of the lateral cluster to pressure pulses in the range of 50–250 hPa. In the left panel, maximum values are connected with a dashed line to facilitate comparison. B, ΔF/F traces of two measurements with a total of nine pressure pulses applied either in increasing or decreasing order. Weak pressure pulses (<30 hPa) did not elicit any response of the β-glomerulus, whereas the responses increased with increasing pressure amplitudes until reaching a plateau. Maxima are connected with a dashed line to facilitate comparison. C, Dose–response curve for the mechanosensitvity of the β-glomerulus. Blue asterisks represent the average value of all measurements (n = 8 animals). Error bars indicate SDs. The gray diamonds represent the average values for each animal individually. Red line indicates the sigmoidal fitted to the mean values. D, Normalized ΔF/F peak response map for different layers of a β-glomerulus stimulated with a pressure pulse (150 hPa) or the amino acid mixture (200 μm). The same fibers are responding to both stimuli. Scale bar, 20 μm.
As a next step in our analysis, we stimulated the olfactory system with the individual amino acids of the mixture (as used for Fig. 1D, bottom left). Each single amino acid elicited a response in the β-glomerulus, with amplitudes varying among amino acids (Fig. 3A). Of the 134 individual amino acid applications recorded, only eight did not show an unambiguous stimulus-induced Ca2+ peak (see Materials and Methods), specifically three for l-proline, two for l-alanine, two for l-arginine, and one for l-phenylalanine. However, in most of these cases, a delayed response onset was observed. We repeated this experiment in nine animals, normalized the results per β-glomerulus to the amino acid mixture response, and found that each glomerulus recorded showed the same broad sensitivity to amino acids. Furthermore, all of them also reacted to forskolin (second to last column of matrix in Fig. 3A).

The β-glomerulus is broadly sensitive to amino acids. A, Calcium green intensity traces of the β-glomerulus from nine different animals for 15 individual amino acids (200 μm) and forskolin (25 μm). The traces are normalized to the respective maximum response elicited with the amino acid mixture. The first column is the average signal of three amino acid mixture applications. The blue bar beneath each curve indicates stimulus onset. A cross (×) points out traces without clear stimulus-induced Ca2+ peaks (see Materials and Methods). In the last column, two control measurements with odor-free Ringer's solution as stimulus for each animal are shown (see Materials and Methods for amino acid abbreviations). For, Forskolin. B, Maximal response amplitudes to the individual amino acids and forskolin averaged over all preparations. Values are given relative to the average amino acid mixture response. Color coding refers to the different amino acid subgroups as indicated in the inset. Error bars indicate SEM.
A previous study reported that most amino-acid-sensitive OSNs in Xenopus tadpoles respond individually only to a small number of odorants (Manzini and Schild, 2004; Schild and Manzini, 2004). Furthermore, 97% of 67 individually tested glomeruli in the amino acid-sensitive lateral cluster responded to <12 amino acids and not one was found that responded to all of the 15 amino acids tested (Manzini et al., 2007a). The broad sensitivity observed in the β-glomerulus could be brought about either by fibers originating from different OSNs, each being sensitive to a subset of amino acids, or by the convergence of OSNs with broadly tuned receptors. To distinguish between these cases, we examined, as a first step, the variation of the response amplitudes. Figure 3B shows the normalized response amplitudes as a bar plot. Because the number of glomeruli analyzed was relatively small (n = 9), one would expect large variations should different OSN classes project to the β-glomerulus. Instead, the SEM of the bars suggests rather constant ratios for the sensitivities to the single amino acids and thus one type of OSN fibers entering the β-glomerulus.
To confirm this hypothesis, it was necessary to identify individual axon branches within the β-glomerulus, observe their sensitivity to the set of amino acids used, and compare them (Fig. 4A). To reach this goal, we used dual channel line illumination microscopy (Fig. 4B) and a subtraction imaging method (Sheppard and Cogswell, 1990; Gauderon and Sheppard, 1998; Heintzmann et al., 2003; Poher et al., 2008; Sánchez-Ortiga et al., 2012, see Materials and Methods), along with double staining of OSN axons by double electroporation. Briefly, in the line illumination microscope, one line is illuminated in the object plane and at every point in time the descanned emission light from this line is projected to an sCMOS camera. That is, for each line in the object plane, we recorded, not only one or two pixel rows on the sCMOS camera chip, which would correspond to confocal imaging containing mainly in-focus light Iin, but also the adjacent lines, which reflect out-of-focus light Iout and contribute to the background in the image plane (Fig. 4B). The middle subpanel of Figure 4A shows the confocal image of a z-plane within the OB derived from the central pixel rows of the camera corresponding to a confocal aperture of 0.44 AU. The left subpanel of Figure 4A shows an image derived from the average of 5 lines distributed over an area corresponding to 6.6 AU. Clearly, the image contains more depth information, which also contributes to the background in the confocal image. Subtracting the background information from the confocally recorded image then gives the image in the right subpanel of Figure 4A. It is clear from the image as a whole, but in particular from the magnification shown in Figure 4C, that the contrast among the fibers can be markedly enhanced this way (see also Movie 1). Quantitatively, the improved contrast becomes clear from the normalized intensities taken along a line (horizontal white line, Fig. 4C). The corresponding intensity profiles are plotted above the respective images. The increase in contrast is reflected by the ratios of intensity maxima and adjacent minima. Line illumination microscopy outperforms most other confocal imaging techniques in terms of acquisition speed and allowed obtaining calcium signals in the β-glomerulus in 3D. The combination with subtraction imaging yielded an optical sectioning accuracy that allowed us to differentiate individual axons.

Recordings from individual axons within the β-glomerulus. A, Three images of Alexa Fluor-stained OSN axons extracted from a single acquisition. Left, Average of 5 camera lines corresponding to an open confocal aperture of ∼6.6 AU. Middle, Recording of the central lines corresponding to a confocal recording with a closed aperture of 0.44 AU. Right, Result of subtraction imaging. Scale bar, 10 μm. B, Sketch of the line illumination microscope. Two lasers (488 and 561 nm) can be rapidly switched via acousto-optical modulators (AOM) and a line is mapped onto the sample using a cylindrical lens (CL). An example of a typical emission line recorded by the sCMOS chip is shown in the bottom right corner. Reading only the central camera line indicated by a white line corresponds to a normal confocal recording. In addition, camera lines within the active area (red lines) containing mainly out-of-focus light (Iout) can be acquired. AOM, Acousto-optical modulator; GF, glass fiber; Coll, collimator lens; CL, cylindrical lens; Obj, objective; DL, detector lens; Iin, in-focus light. C, Close-up view of the glomerulus highlited in A under three different conditions: 6.6 AU, 0.44 AU, and subtraction imaging. Top, normalized intensity traces for the horizontal white line in the images. The vertical red bars indicate identical x-coordinates of the images. Scale bar, 5 μm. D, Maximum intensity projection of a 9-μm-thick volume of a β-glomerulus after subtraction imaging. Top left, Calcium green channel; bottom left, Alexa Fluor 647 channel; right, overlay of both channels. Two regions are indicated, one with strong staining in both channels and another one with a strong calcium green signal but almost no Alexa Fluor 647 staining. Scale bar, 10 μm. E, Highly correlated traces for three pairs (top, middle, and bottom) of axons. Each pair of traces shows the normalized response pattern of two different OSN axons within the same β-glomerulus. The bars below the traces represent stimulus application. F, Seven, five, and two pairs of traces taken in different animals for three groups of stimuli. Each pair shows two pixel lines corresponding to two different OSN axons within the same β-glomerulus. White blocks above the traces show type and timing of stimulus application. Total recording time, 145 s.
The movie starts with a sketch of the light pathway of the line illumination microscope. In the next shot, the screen is split into four parts, all going through a 100-μm-thick recording of OSN axons in the OB stained via Alexa Fluor 647 electroporation. Each panel corresponds to a different number of averaged lines from the camera sensor and thus to a different confocality. The last panel corresponds to subtraction imaging. The data for all displayed stacks were recorded in a single measurement. The final shot of the movie splits the screen in three horizontal parts, with different confocalities all representing sections of the same z-stack and thus showing the differences within the same image. The 16 lines cover an area corresponding to 6.6 AU, the 3 lines 0.66 AU, and the one central line covers 0.22 AU.
Using this technique after electroporation of the OM with two different dyes on consecutive days (calcium green dextran and Alexa Fluor 647 dextran) allowed the unambiguous identifications of individual intraglomerular OSN fibers and the measurement of their activities (Fig. 4D). This is because each electroporation affected only a subset of OSNs in the OM. Therefore, some OSNs and their axons were stained with one dye, others with the second dye, and some with both. Therefore, we recorded and compared Ca2+ signals in axon branches stained by calcium green only with signals in terminals double-stained by calcium green and Alexa Fluor 647 within the β-glomerulus as these two categories of fibers originated without doubt from different OSNs.
Figure 4E compares the responses to amino acids in pairs of different axons (axon 1 is shown in red, axon 2 in black) within the same β-glomerulus, in which the 3 sets of traces were taken in three different preparations. Clearly, the responses of these pairs of axons were highly correlated. The last trace corresponds to a β-glomerulus with overall reduced amplitudes to the stimuli. Here, the differences between the two pairs were slightly more pronounced, possibly due to the relatively higher influence of spontaneous activity. Figure 4F further exemplifies the similarity between fibers. In the top, middle, and bottom subpanels, seven, five, and two pairs of axons (as in Fig. 4D) are shown, respectively. The ΔF/F signals were color coded to represent the data in compact form. A high degree of correlation of the responses was detected both among different fibers within the same glomerulus, as well as among fibers from different β-glomeruli. The opposite observation, a response limited to only one fiber of the observed pair within the glomerulus, has never been observed. Note that all fibers showing sensitivity to forskolin also responded to amino acids.
In conclusion, the measurements obtained by line illumination microscopy clearly suggest that all fibers entering the β-glomerulus have the same sensitivity to odorants. One has therefore to assume the existence of a broadly tuned olfactory receptor in the olfactory system of Xenopus tadpoles.
To see postsynaptic effects such as M/T cells affected by the activity in the β-glomerulus, we combined electroporation of presynaptic fibers with Alexa Fluor 647 and bolus loading of Fluo8-AM at the OB with ACI. Figure 5A shows the small cluster containing the β-glomerulus presynaptically stained with Alexa Fluor 647 (ROI 1) and Figure 5B displays in the second color channel part of the OB's postsynaptic network stained by Fluo8-AM. Note the position of the β-glomerulus surrounded by numerous cells. Calculating the neighborhood correlation map (Fig. 5C, see Materials and Methods) highlights cells and cellular elements with correlated activities in neighboring pixels. Figure 5D shows the ACI image in which the activity of the β-glomerulus is taken as a reference trace (top left inset) to which the activities in all pixels are compared. The image of the resulting correlation coefficients (i.e., the ACI map) clearly shows, in addition to the β-glomerulus, a group of M/T cells and their processes. These processes became visible as a result of the contrast based on correlation instead of fluorescent intensity alone and allowed us to identify some mitral cells with dendrites innervating the β-glomerulus. Although a thorough investigation of the functional impact of the β-glomerulus upon the OB's network was beyond the scope of this work, its role is likely to be complex. Some M/T cells (e.g., ROI 2) are highly correlated with the activity of the β-glomerulus (Fig. 5E, top trace, β, and ROI 2, second trace from above), whereas others (e.g., ROI 3, second trace from below), although showing responses to the stimuli presented, respond with different amplitude ratios to the stimuli. There are also M/T cells in the vicinity of the β-glomerulus that do not appear to be correlated to the activity of the β-glomerulus. These cells are identifiable in the neighborhood correlation map (Fig. 5C), but not in the ACI map (Fig. 5D, ROI 4 and subfigure E, bottom trace). Kludt et al. (2015) reported the finding of dual-sensitive M/T cells responding to both temperature drops and amino acid stimulation. Mechanosensitive M/T cells observed in this study in the neighborhood of the β-glomerulus were also found to be dual-sensitive. All M/T cells responding to pressure pulses also showed [Ca2+] increases in response to amino acid stimulations. In total, 17 M/T cells in four animals were dual-sensitive and not one M/T cell showed mechanosensitivity without being also amino acid-sensitive.

Mitral cell connectivity revealed by ACI. A, Maximum intensity projection of a 25-μm-thick volume of Alexa Fluor 647-electroporated OSN axons. ROI 1, β-glomerulus. Scale bar, 20 μm. B, Same region as in A with postsynaptic bolus loading with Fluo8-AM recorded in the second channel. Scale bar, 20 μm. C, Neighborhood correlation map providing increased contrast for areas exhibiting similar activity patterns. Scale bar, 20 μm. D, Activity correlation image revealing mitral cells connected to the β-glomerulus. Top left corner, Reference trace obtained from the β-glomerulus. The image highlights areas showing activity similar to that of the β-glomerulus. Scale bar, 20 μm. E, ΔF/F traces corresponding from top to bottom to the four ROIs shown. The red bars beneath the traces depict the stimulus application times of the indicated amino acids.
In summary, the information gathered by the β-glomerulus is conveyed to the OB's network in a complex way, which needs further investigation using different experimental designs such as two-photon microscopy to cover larger parts of the cellular network (Schrödel et al., 2013; Ahrens et al., 2013).
M/T cells innervating the β-glomerulus are expected to show responses to the stimuli effective for the presynaptic glomerulus and should thus also respond to pressure pulses if this information is conveyed to the postsynaptic side of the glomerulus and thus further processed in the olfactory system. In the proximity of the β-glomerulus, we indeed observed M/T cells that responded to pressure pulses in a similar way as the β-glomerulus itself (MC1 in Fig. 6A). Figure 6A represents two measurements with different sets of M/T cells: the top three traces for each measurement show the pressure profile (red), the resulting activity of the postsynaptic β-glomerulus (β-Gl), and the activity of a neighboring M/T cell (MC1). There are, however, also M/T cells that appear to be inhibited upon pressure stimulation, as shown in the fourth trace (MC2) of each measurement. Figure 6B presents a longer recording in a different animal in which stimulus-triggered periods of inhibition are interposed with a pronounced spontaneous activity. The strong and long-lasting inhibition of the M/T cell in response to the pressure pulses is especially pronounced due to its high amount of spontaneous activity exhibited in between inhibitions. Figure 6C presents two images recorded simultaneously in two channels. The top image shows Alexa Fluor staining of OSN axons and the bottom image a color-coded ΔF/F map for the Fluo8-stained M/T cells after stimulus application (150 hPa), with red indicating an increase in ΔF/F and blue a decrease. The recording was obtained with a field of view containing the β-glomerulus (left part of each image), as well as part of the lateral cluster (right half of each image). Although the cell encircled as ROI 2 and located close to the β-glomerulus (ROI 1) responded in a similar way as the β-glomerulus (top traces to the right of the figure), the regions selected in the lateral cluster showed a pronounced decrease in Ca2+-dependent fluorescence, clearly indicating inhibitory responses. The view of Figure 6D contains one layer of the lateral cluster, which is mostly inhibited by the pressure application, but there are also cells that follow the activity of the β-glomerulus. ROI 1 indicates a M/T cell positively responding to pressure pulses; the M/T cell in ROI 4 is inhibited by the mechanical stimulus. The postsynaptic side of the two glomeruli indicated by ROI 2 and 3 in the lateral cluster are also strongly inhibited (compare Movie 2). Inhibition of M/T cells and postsynaptic glomeruli was mainly observed in and around the lateral cluster.

Processing of mechanosensitivity in the mitral cell layer of the OB. A, Two sets of traces taken in a Fluo8-stained OB. The two measurements show traces from different mitral cells. Top trace of each set are pressure pulses applied to the OM (red). Middle traces are ΔF/F for the postsynaptic compartments of the β-glomerulus (β-Gl). Bottom traces are two mitral cells (MC1 and MC2) showing opposite responses with respect to the β-Gl. B, Similar to A, but with longer recording and a different animal. C, Top, Presynaptic fibers stained by electroporation with Alexa Fluor 647. ROI1, β-Gl. Bottom, Color-coded ΔF/F map during a 150 hPa pressure pulse of the Fluo8-stained postsynaptic mitral cells and dendrites. Positive and negative responses are shown in red and blue, respectively. To the right of the images, ΔF/F traces correspond to the four indicated ROIs. Scale bar, 20 μm. D, Similar to C, but with the field of view containing the lateral cluster only. Scale bar, 20 μm.
The movie shows the data presented in Figure 6C and D and allows one to follow the activity of the preparation in relation to the pressure application for the complete area. First, the presynaptically stained OSN axons that form the β-glomerulus and part of the lateral cluster are shown. Then, the screen changes and shows the same area recorded in the second channel corresponding to the postsynaptic Fluo8-AM staining. The color coding represents negative responses in blue and positive responses in red. Above the image, two traces are shown corresponding to the two indicated ROIs. The third trace indicates the applied pressure. Next, the movie runs the same course as before, but now shows an ROI containing only the lateral cluster.
In conclusion, our results show that the β-glomerulus receives both chemosensory and mechanosensory information. The β-glomerulus' information is then transmitted to the M/T cell network, where it appears to exert widespread and dynamically complex effects.
Discussion
Recent developmentd in the field of olfaction suggest that odorant quality is coded partly by first-spike latencies in the mitral cells of the OB (Spors et al., 2006; Schaefer and Margrie, 2007; Bathellier et al., 2008; Junek et al., 2010). This puts particular emphasis on precise timing, not only in M/T cells, but also in all preceding processes, the flux in the nasal cavities included. Unfortunately, very little is known about the actual flux within nasal cavities and thus the odorant arrival dynamics (Kux et al., 1988; Cox, 2008). If changes in odorant flux modulated the activities of OSNs and if this effect affected odor perception, then flux changes would be reflected in the activities of glomeruli and M/T cells. We therefore induced flux changes by changing the pressure with which the solution is applied to the OM and then imaged the effects in the OB. Our working hypothesis was that the activities of many or most glomeruli and M/T cells would be pressure-pulse modulated. This hypothesis turned out to be incorrect. Rather, it was a single glomerulus, the β-glomerulus, that responded reliably to pressure pulses, which is consistent with our preliminary observations (Kludt, 2009). It thus appears that flux changes are in general not coded in OSNs and converged to the OB, except for those OSNs projecting to the β-glomerulus. In mice, in comparison, ∼60% of the OSNs are reported to possess a mechanosensitivity and the septal organ in particular contains many mechanosensitive cells (Grosmaitre et al., 2007; Connelly et al., 2015). It is, however, unknown how mechanosensitive OSNs send this information to the OB. The mechanosensitivity might be used as a synchronizing signal for the OB, where breathing-synchronized activity has been described in a number of species (Onoda and Mori, 1980; Cang and Isaacson, 2003; Buonviso et al., 2006; Spors et al., 2006). In mice, this synchronization appears to be related to the mechanosensitivity of OSNs (Grosmaitre et al., 2007) and a similar function has been discussed for the temperature and mechanosensitive subsystems, namely the Grueneberg ganglion and septal organ (Mori et al., 2014).
Xenopus tadpoles do not inhale or exhale. However, as in other species, various types of behavior might lead to a pulsatile stimulation of the olfactory organ. For example, the flicking of the tongue brings odorants to the vomeronasal organ of snakes (Kubie and Halpern, 1975) and some aquatic animals such as flounders actively pump water through their nasal chamber. (Døving and Thommesen, 1977; Ache and Young, 2005). Xenopus tadpoles are never at rest. Their most frequent behavior is a rhythmical up-and-down movement at angles close to 30° to the vertical. This movement most presumably serves, not only for food intake, but must also result in rhythmical pressure pulses to the tadpoles' nasal cavities. A detailed investigation of this behavior was beyond the scope of our study, but it seems noteworthy that the pressure pulses applied to the OM corresponded to flow changes in the range between 0 and 0.56 m/s and, conversely, that the movement speed of tadpoles reaching up to 0.27 m/s, as measured in Hyla versicolor tadpoles (Van Buskirk and McCollum, 2000), was exactly in the range of the β-glomerulus' mechanosensitivity. In a certain analogy to breathing, this glomerulus may thus detect the animal's rhythmical movement and use it as synchronization signal. A signal that corresponds to the animal's relative movement and the concomitant flow changes at the nostrils might be used by the OB for compensating for the neuronal effects of the flux changes.
The effects of the β-glomerulus upon the OB network were twofold: (1) a few M/T cells were activated in synchrony with the β-glomerulus and (2) many M/T cells in the lateral cluster were inhibited. It will be interesting to determine whether this serves to increase the signal-to-noise ratio of the M/T cells' response activity patterns.
The β-glomerulus also responded to a large number of amino acids and our activity analysis of individual axons clearly suggested that every individual axon branch in the β-glomerulus had the same broadly tuned sensitivity. In addition, amino acid sensitivity and sensitivity to pressure pulses was found in the same fibers. The corresponding receptor is unknown at present. The sensitivity spectrum of the taste receptor T1R1 + 3 shows the highest overlap with the spectrum that we found, but it differs, for example, regarding histidine, which elicits the strongest responses in the β-glomerulus but is one of the lowest in the taste receptor (Nelson et al., 2002). Interestingly, Connelly et al. (2015) reported that the mechanosensitivity of OSNs in the mouse septal organ is mediated by ORs. This is consistent with the coexistence of amino acid sensitivity and mechanosensitivity observed in the fibers innervating the β-glomerulus and the limitation of mechanosensitivity to a single glomerulus. The OSNs innervating the β-glomerulus express likely the same OR with combined general amino acid sensitivity and mechanosensitivity.
Note that the amino-acid-sensitive fibers in the β-glomerulus also showed responses to forskolin application at the OM, whereas responses to forskolin have not been observed in the amino-acid-sensitive OSNs projecting to the lateral cluster. This suggests that the amino-acid-sensitive OSNs projecting to the β-glomerulus use a transduction pathway that differs from the standard transduction pathway of amino-acid-sensitive OSNs (Manzini and Schild, 2003).
We were unsuccessful in determining the location of the OSNs that project to the β-glomerulus due to the difficulty of backtracing the β-glomerulus' fibers without simultaneously loading other cells or axons in the neighborhood of the β-glomerulus.
Glomerular clusters of the OB in Xenopus tadpoles respond to different stimuli, as was studied in some detail by Gliem et al. (2013). The small cluster in Xenopus tadpoles stands out because it consists of only five glomeruli, compared with ∼170 in the lateral and 100 in the medial cluster (Manzini et al., 2007b). The temperature-sensitive γ-glomerulus is among these five glomeruli and is the only glomerulus receiving a bilateral innervation supposedly adding information about the direction of the sensed temperature gradient (Kludt et al., 2015). The β-glomerulus described in the present study is another glomerulus located in the small cluster and provides a broadly tuned sensitivity to amino acids and mechanic stimuli. It thus appears as if the small cluster would generally fulfill a special role within the OB, possibly calibrating other parts of the OB with information about additional modalities such as temperature and flux, which are most likely relevant for the correct coding of odorants. With its broad sensitivity to amino acids and mechanical stimuli, the activation of the β-glomerulus might also provide a signal for the OB indicating the arrival of a new sample of odorants. Such a predicting signal would be crucial for latency-mediated odor coding and could potentially indicate the starting point of a new latency pattern.
In conclusion, it seems that some OSNs in Xenopus tadpoles are endowed with a mechanoreceptor that is also sensitive to a broad spectrum of amino acids. The presence of mechanosensitivity and temperature sensitivity may be used for some kind of calibration or for modulation of the coding in the OB, as suggested by the large impact seen on M/T cells. Alternatively, it might serve as additional information for sensing and localizing amino acid-containing food. The advantage of coding mechanical stimuli in combination with amino acids may be revealed by further experiments investigating the detailed influence of the β-glomerulus upon the OB network, as well as the flow dynamics within the nasal cavities.
Footnotes
This work was supported by the Deutsche Forschungsgemeinschaft Excellence Cluster 171; the Center for Nanoscale Microscopy and Molecular Physiology of the Brain; and the Bernstein Center for Computational Neuroscience (Grant FKZ01GQ1005A). We thank Stephan Junek and Mihai Alevra for providing MATLAB codes for image evaluation, especially MatVis, and Christina Patzelt for her help with animal preparations and electroporation.
The authors declare no competing financial interests.
- Correspondence should be addressed to Detlev Schild, Department of Neurophysiology and Cellular Biophysics, University of Göttingen, Humboldtallee 23, 37073 Göttingen, Germany. dschild{at}gwdg.de


