

Abstract
The prelimbic prefrontal cortex (PL) has consistently been found to be necessary for the acquisition of goal-directed actions in rodents. Nevertheless, the specific cellular processes underlying this learning remain unknown. We assessed changes in learning-related expression of mitogen-activated protein kinase/extracellular signal-related kinase (MAPK/ERK1/2) phosphorylation (pERK) in layers 2–3 and 5–6 of the anterior and posterior PL and in the population of neurons projecting to posterior dorsomedial striatum (pDMS), also implicated in goal-directed learning. Rats were given either a single session of training to press a lever for a pellet reward or yoked reward deliveries without instrumental training and assessed 5 or 60 min after training for pERK expression. Relative to yoked training, instrumental training produced an increase in pERK expression in all regions of the PL both at 5 and 60 min, and this was accompanied by an increase in nuclear pERK expression in the posterior PL in rats given instrumental training. pDMS-projecting neurons showed a transient increase in pERK expression in posterior layer 5–6 projection neurons after 5 min, and a delayed increase in anterior layer 2–3 neurons after 60 min, suggesting that ERK expression in the PL is necessary for the consolidation of goal-directed learning. Consistent with this claim, we found that rats trained on two lever press actions for distinct outcomes and then infused with the MEK inhibitor PD98059 into the PL immediately after training failed to acquire specific action–outcome associations, suggesting that persistent pERK signaling in the PL is necessary for goal-directed learning.
SIGNIFICANCE STATEMENT The prelimbic cortex is implicated in goal-directed learning in rodents; however, it is unclear whether it is involved in the consolidation of this learning, and what cellular processes are involved. We used pERK as a marker of activity-related synaptic plasticity to assess learning-induced changes in distinct layers and neuronal populations of the prelimbic prefrontal cortex (PL). Training produced long-lasting upregulation of pERK throughout the PL and specifically within neurons that project to the pDMS, another region critical for goal-directed learning. Next, we demonstrated that pERK signaling in the PL was necessary for the consolidation of goal-directed learning. Together, these results indicate that instrumental training induces ERK signaling in distinct layers and populations in the PL and this signaling underlies the consolidation of goal-directed learning.
- consolidation
- dorsomedial striatum
- extracellular signal-related kinase
- goal-directed action
- mitogen-activated protein kinase
- prelimbic cortex
Introduction
There is now extensive evidence that animals integrate both evaluative and contingency related information to acquire goal-directed actions and make value-guided decisions in instrumental tasks (Dickinson and Balleine, 1994; Balleine and Dickinson, 1998). In the rat, the prelimbic (PL) region of the medial prefrontal cortex has been consistently found to be critical for this acquisition process; however, its role in goal-directed action appears to be transient (Ostlund and Balleine, 2005; Tran-Tu-Yen et al., 2009) suggesting that, whereas the PL is important early in learning, long-term storage and performance based on this learning are mediated by downstream structures (Ostlund and Balleine, 2005).
A key target of the PL in this regard is the posterior region of the dorsomedial striatum (pDMS), which has been found to be necessary for both the acquisition and performance of goal-directed instrumental actions (Yin et al., 2005a). Recent evidence suggests that distinct cortical inputs to the striatum may differentially modulate plasticity in striatal subregions (Friedman et al., 2015; Xiong et al., 2015) and at specific cell types (Shan et al., 2014) during instrumental learning tasks, raising the possibility that the PL inputs to the pDMS may be critical for the striatal plasticity underlying goal-directed learning.
To assess this hypothesis, we used a cellular marker of learning and memory to more thoroughly assess learning-related changes in the PL following acquisition of instrumental actions. We focused on mitogen-activated protein kinase/extracellular signal-related kinase (MAPK/ERK1/2) phosphorylation in PL and pDMS as evidence of cellular activity-related synaptic plasticity. Activation of the MAPK/ERK pathway is important for long-term memory of spatial learning in the hippocampus and entorhinal cortex (Blum et al., 1999; Hebert and Dash, 2002); associative fear memory in the amygdala and prefrontal cortex (Schafe et al., 2000; Runyan et al., 2004), aversive memories for tastes in the insular cortex (Berman et al., 1998), and for the acquisition and performance of goal-directed instrumental actions in the pDMS (Shiflett et al., 2010). Furthermore, repeated neuronal stimulation has been shown to produce prolonged (hours) ERK signaling and long-lasting ERK-dependent morphological dendritic changes in hippocampal neurons (Wu et al., 2001). Therefore, prolonged MAPK/ERK signaling is a strong candidate for mediating persistent structural changes underlying long-term learning and memory in cortical neurons.
Here we quantified short-term (5 min) and prolonged (1 h) changes in instrumental training-induced MAPK/ERK phosphorylation (pERK) in the PL and pDMS, hypothesizing that instrumental training would produce a long-lasting upregulation of pERK in the PL. We further hypothesized that there would be specific upregulation of pERK in pDMS-projecting PL neurons, consistent with the ultimate role of the pDMS in long-term storage and expression of goal-directed actions. We then sought to assess the functional role of MAPK/ERK in the consolidation of goal-directed learning by infusing the specific MEK antagonist PD98059 into the PL immediately after instrumental training, hypothesizing that blockade of the MEK/ERK pathway would prevent consolidation of the recently acquired learning. Finally, we assessed the nature of the learning disrupted by MEK/ERK blockade using a within-subjects design that controlled for potential amnestic effects.
Materials and Methods
The current study was divided into three experiments investigating the role of the PL in the consolidation of goal-directed learning. First, we investigated both short-term and prolonged changes in pERK expression in superficial and deep layers of the PL and in the pDMS (Experiment 1). Next, we investigated the effect of blocking ERK phosphorylation on goal-directed learning by infusing the MKK/MEK inhibitor PD98059 into the PL immediately after instrumental training (Experiment 2). Finally, we conducted a within-subject replication of Experiment 2 in which rats' performance was assessed after both drug and vehicle infusions so as to control for any potentially amnestic effects of PD98059 infusion in that experiment (Experiment 3).
Experiment 1: instrumental training-induced changes in pERK expression in the PL and in the pDMS
Subjects
Subjects were 24 experimentally naive male outbred Long–Evans rats (290–360 g before surgery) obtained from Monash University Animal Research Platform.
Apparatus
Training for all experiments was conducted in 16 operant chambers (MED Associates) enclosed in sound- and light-attenuating cabinets. Each chamber was fitted with a pellet dispenser capable of delivering a 45 mg grain food pellet (Bioserve Biotechnologies) and a pump, which delivered 0.2 ml of 20% sucrose (Coles) diluted in H2O into a recessed magazine inside the chamber. The chambers also contained two retractable levers that could be inserted individually on the left and right sides of the magazine. Head entries into the magazine were detected via an infrared photobeam. The operant chambers were fully illuminated during all experimental stages; except when otherwise specified, illumination was provided by a 3 W, 24 V house light located on the upper edge of the wall opposite to the magazine. The training sessions were controlled by two computers located in a separate room using software (Med-PC, MED Associates). These computers also recorded the experimental data from each session.
Surgery
All rats received an infusion of the retrograde tracer, fluorogold (FG), unilaterally into the pDMS. Rats were anesthetized with 3% inhalant isoflourane gas with oxygen, delivered at a rate of 0.5 L/min throughout surgery. Anesthetized rats were placed in a stereotaxic frame (Kopf), and an incision was made down the midline of the skull. The scalp was retracted to expose the skull, a Hamilton 1.0 μl glass syringe was lowered into the pDMS at the coordinates (mm from bregma): anteroposterior, −0.4; mediolateral, ±2.2; dorsoventral, −3.5. A total volume of 0.15 μl of FG (3 mg/ml diluted in 1 m sterilized PBS) was infused into the pDMS at a rate of 0.05 μl/min. The infusion syringe was left in place for a further 4 min for diffusion.
Behavioral protocol and food deprivation
Food deprivation.
After recovery from surgery, rats underwent 4 d of food deprivation before the onset of the experiment. During this time, they received 5 mg of chow daily for the first 2 d, and 10 mg from the third day until the end of the experiment. Their weight was monitored daily to ensure it remained >85% of their presurgery body weight at all times.
Magazine training.
All rats were given 2 d of magazine training (days 1 and 2), during which they were placed in the operant chamber, and grain pellets were delivered into the magazine on a random interval 60 s schedule. The session ended once 30 outcomes had been delivered, at which point the lights inside the chambers went out, and rats remained in the darkened chambers for an additional hour before being removed.
Instrumental/yoked training.
On day 3, two groups of rats (Groups Inst 5 and Inst 60) started instrumental training. During this session, rats were placed into the operant chambers where one lever was inserted. Rats were trained to respond on the lever for a single grain pellet, delivered on a continuous reinforcement schedule. The session ended once 30 pellets had been earned. The other two groups (Groups Yoked 5 and Yoked 60) were given identical sessions, except that pellet delivery was not contingent on instrumental responding; instead, pellets were delivered at random intervals, where the average interval was determined by the average interval of pellet delivery for the matched instrumental group. At the end of the session, the levers retracted and the house lights went off. Rats in Groups Inst 5 and Yoked 5 remained in the chambers for a further 5 min before being removed and rapidly anesthetized with Lethabarb. Rats in Groups Inst 60 and Yoked 60 remained in the chambers for 60 min after the end of the session before being anesthetized. All rats were immediately perfused for tissue analysis.
Histology and immunofluorescence staining
Rats were perfused transcardially with cold 4% PFA, and brains were removed and postfixed for another 1–3 d, before being sliced on a vibratome at 30 μm. Sections from the anterior PL (3.7–4.7 mm anterior to bregma) and posterior PL (2.5–3.2 mm anterior to bregma) and pDMS (0.2–0.5 mm posterior to bregma) were stored in cryoprotective solution in a −20 degree freezer and immunostained for expression of pERK.
Quantification of size and location of FG injections.
A subset of sections from the DMS of each rat was mounted onto slides, and the extent and location of FG injections were assessed. Injections were verified under a fluorescent microscope, using the boundaries defined by Paxinos and Watson (2007). Rats with misplaced or incomplete injections, extensive damage or infection, or injections that included large areas of neighboring structures were excluded from the statistical analyses. Whole-brain map images were taken of each FG injection at its widest point and the area of the 2D injection site was quantified using image processing software (ImageJ, RRID:SCR_003070); a manually selected region of interest (ROI) corresponding to the injection site was isolated, and the area of that region was calculated. The correlation between FG injection size and the degree of retrograde labeling in the anterior and posterior PL in superficial and deep layers was calculated, with significance determined via the Parson product-moment correlation coefficient.
Immunoflourescence staining for pERK in the PL.
Sections were washed three times in 0.1 m TBS with 2% NaF for 10 min each. Sections then underwent peroxidase treatment, which consisted of submerging each section in TBS (NaF) with 1% methanol and 0.3% hydrogen peroxide for 5 min. Sections were again rinsed 3 times with TBS (NaF), before being submerged in TBS (NaF) with 2% Triton X-100 for 30 min. Sections were again rinsed 3 times in TBS (NaF). Each section was submerged in 400 μl of rabbit anti-phospho-p44/42 MAPK (Erk1/2) (Thr202/Tyr204) (1:300, cat #9101, Cell Signaling Technology, RRID:AB_331646), diluted in TBS (NaF) for 48 h on a shaker at 4 degrees. Upon removal, sections were again rinsed three times with TBS (NaF) and then placed in the secondary; donkey anti-rabbit Alexa-546 (1:1000, cat #A10040, Invitrogen, RRID: AB_2534016) diluted in TBS (NaF) for 2 h at room temperature. Sections were then rinsed twice each with TBS and TB, each for 10 min, and mounted onto slides using Vectashield mounting medium without DAPI (Vector Laboratories). For the 60× series, sections were left in full light for 24 h to bleach FG before staining, and stained sections were mounted with Vectashield with DAPI.
Immunoflourescence staining for pERK and DARP-32 in the pDMS.
The immunofluorescence protocol used for staining pERK in the pDMS was identical to that used for the PL, except that in addition to the rabbit anti-phospho-p44/42 MAPK (1:300), a purified mouse anti-DARP-32 (1:1000, cat #611520; BD Biosciences, RRID: AB_398980) was applied. The secondaries were donkey anti-rabbit Alexa-546 and donkey anti-mouse Alexa-488 (cat# A21202, Invitrogen, RRID: AB_2535788), both diluted at a concentration of 1:1000 in TBS (NaF) for 2 h at room temperature.
Cellular quantification
All fluorescent imaging was conducted on a confocal microscope (Olympus BX16WI). For quantification in the PL and pDMS, a single image was taken per hemisphere using a 10× objective. For all tissue, fluorescent images were taken no more than 1 week after sections had been mounted, to minimize variation in signal strength. The imaging settings were kept constant across slices for each series.
Images from the PL were analyzed with computer software (ImageJ) for counts of pERK-positive cells, FG-labeled neurons, and pERK neurons colabeled with FG. The images from the pDMS were analyzed in the same manner for pERK neurons colabeled with DARP-32. Four sections per rat were analyzed each from the anterior PL (aPL), posterior PL (pPL), and pDMS.
Quantification of nuclear/cytosolic + nuclear signal in PL
A single section per rat from the aPL and one from the pPL were used for analysis of cytosolic and nuclear pERK in layers 2–3 and layers 5–6. Before pERK staining, sections were left in light for 24 h to bleach the FG signal. This was done to allow the use of a nuclear stain in a similar excitation wavelength (DAPI), to detect nuclear boundaries. A 60× oil-immersion objective was used, and a single image was taken per neuron. The imaging settings were kept constant across all neurons. Only one hemisphere was imaged; this was the right hemisphere in the majority of cases unless there was tissue damage in which case the left hemisphere was selected. For any given rat, the same hemisphere was selected for the aPL and pPL. All the cells within a single focal plane in the PL were selected for imaging. Image processing software (ImageJ) was used to process the mean gray (fluorescence) values of manually selected ROIs corresponding to the cytoplasm, nucleus, and background within each image (Bertran-Gonzalez et al., 2013). Mean gray values were extracted only from the 546 (pERK) channel; the DAPI channel was used only for identifying nuclear borders. For each image, a 10 μm2 area was selected from the darkest part of the image to represent the background. The DAPI channel was used to manually outline the nuclear ROI, and the cytoplasm was defined using a merged channel with both pERK and DAPI to determine the outer and innermost borders of the cytoplasm.
The background-corrected nuclear/cytosolic + nuclear signal was calculated for each neuron by dividing the mean gray value of the cytosol and nucleus by the background mean gray value and then dividing the background-corrected mean gray value of the nucleus by that of the nucleus plus cytosol of the same neuron. These values were then averaged across all neurons within a group to obtain the group mean ratio; hence, equal fluorescence in the nucleus and cytosol will result in a value of 0.5, and higher fluorescence in the nucleus relative to the cytosol will result in a value between 0.5 and 1.
Statistical analyses
Behavioral data were analyzed via a two-way (time × training) ANOVA. FG tracing was analyzed with planned, orthogonal contrasts to assess differences in expression across hemispheres and across layers, controlling the per-contrasts error rate at α = 0.05. Quantification of pERK in the PL was initially analyzed for differences in expression across layers in the aPL and pPL using a set of planned, orthogonal contrasts controlling the per-contrast error rate at α = 0.05. Each layer was then analyzed separately with a two-way (time × training) ANOVA for main effects of time, training, and the interaction controlling α at 0.05. Separate orthogonal pairwise comparisons were conducted using Fisher PLSD to assess the levels of pERK expression 5 and 60 min after instrumental training to their baseline yoked controls. For analysis of nuclear translocation, a two-way (time × training) ANOVA was used to assess the main effects of time, training, and any interactions controlling α at 0.05. Post hoc pairwise tests were conducted according to Fisher PLSD to follow-up any significant ANOVAs. Colabeled pERK and FG neurons and pDMS pERK expression were analyzed using planned orthogonal contrasts controlling the per-contrast error rate at α = 0.05.
Experiment 2: the role of MEK/ERK activation in the PL in the consolidation of goal-directed learning
Subjects
Subjects were 32 experimentally naive male outbred Long–Evans rats (350–500 g before surgery) obtained from Monash University Animal Research Platform.
Surgery
All rats were implanted with bilateral cannula aimed at the PL. Rats were anesthetized as described above. Anesthesised rats were placed in a stereotaxic frame (Kopf), and an incision was made down the midline of the skull. The scalp was retracted to expose the skull, and 3 jeweler's screws were inserted into the skull distributed laterally and rostrally around where the PL cannula would be inserted. A 5 mm double-guide cannula, spaced 1.5 mm apart (Plastics One) was inserted bilaterally into the PL at the coordinates: anteroposterior, 2.8; mediolateral, ±0.75; dorsoventral, −3.0. The guide cannula was held in place by a stereotaxic arm, while dental cement was applied to the skull around the insertion point of the cannula, and over the jeweler's screws. Once the cement had dried, the stereotaxic arm was removed and a dummy cannula was inserted into the guide cannula, and only removed during infusions. The dummy cannula extended 1 mm ventral to the tip if the guide cannula. Infusions consisted of removing the dummy cannula and inserting a 5 mm (1 mm projection) infusion cannula into the guide. The infusion cannula was connected to a Harvard pump with a Hamilton syringe attached. Drug or vehicle was infused bilaterally at a rate of 0.15 μl/min for a total infusion volume of 0.3 μl. The infusion cannula was left for an additional 2 min after infusions.
Drug
The mitogen-activated protein kinase kinase (MAPKK/MEK) inhibitor, PD98059 (Tocris Bioscience) was dissolved in 40% w/v isotonic saline and 60% DMSO (Sigma-Aldrich) to a concentration of 1 mg/ml. The control vehicle solution was 40% w/v isotonic saline and 60% DMSO. The drug or vehicle was infused bilaterally into the PL at a total volume of 0.3 μl. Therefore, a total of 300 ng of drug was infused.
Behavioral protocol
Recovery and food deprivation procedures were the same as for Experiment 1
Magazine training.
Rats were given 2 d of magazine training (days 1 and 2). Magazine training consisted in placing the rats in the experimental chambers, where they received 30 presentations of 20% Poly-Joule solution into the magazine, delivered at a random interval of 60 s.
Instrumental pretraining.
Instrumental pretraining began on day 3. During this training, rats were placed in the instrumental chambers where they were trained on a continuous reinforcement schedule for Poly-Joule solution, until a total of 30 outcomes had been acquired, or for 60 min. Both levers were trained in separate sessions that were separated in time by at least 1 h. Rats that failed to acquire 30 outcomes in the session were given another training session until the criterion had been reached. On day 4, rats received identical training at a random interval schedule of 15 s; and on days 5 and 6, the random interval was increased to 30 s. The order of lever presentations was counterbalanced within groups and across days for all subjects.
Instrumental training.
On day 7, rats received instrumental training with two new outcomes (grain pellets and sucrose solution). During this session, one lever was inserted for 10 min. Responding on the lever prompted the delivery of one of the outcomes (either sucrose or grain pellets) on a random interval schedule of 30 s. After 10 min, the lever was retracted and the house light turned off for 1 min, after which time, the house light was turned on and the second lever was inserted. Responding on this lever gave rise to the other outcome (pellets or sucrose) on a random interval schedule of 30 s. This sequence was repeated, leading to a total of two 10 min sessions on each lever. Immediately after training, rats were infused with either PD98059 (Group PD98059) or vehicle (Group VEH) into the PL. The order of lever and outcome presentations was fully counterbalanced within each group.
Outcome devaluation and extinction test.
Outcome devaluation tests were conducted on days 8 and 9. On day 8, rats were placed in a separate set of chambers and provided with ad libitum access to either pellets or sucrose for1 h. Rats were then immediately returned to the experimental chambers where they were given a choice test in extinction for 5 min in which both levers were inserted into the chamber but no rewards were delivered. On the final day (day 9), rats were given free access to the other reward (i.e., that not consumed on day 8), followed by an identical 5 min choice test. The levers remained out and the house light remained on for an additional 5 min after the termination of the session, during which time the rats were removed and given a lethal injection of pentobarbital and rapidly perfused for tissue analysis.
Tissue analysis
Brains were processed in the manner described in Experiment 1. A subset of sections containing the PL were mounted onto slides and stained with cresyl violet, to confirm cannula placements using a light microscope. Placements were verified according to the boundaries identified by Paxinos and Watson (2007).
Sections were taken of the pDMS (∼0.4 mm posterior to bregma), and immunostained for rabbit anti-phospho-p44/42 MAPK (1:300) and mouse anti-DARP-32 (1:1000) in the manner described previously.
Cellular quantification
For quantification of pERK in the pDMS, four sections from each rat were imaged using a 20× objective to take 4 adjacent (2 × 2) images, which covered ∼1 mm squared in the medial, most dorsal corner of the pDMS. Images were stitched into a single image in ImageJ, and quantification was conducted as described previously for total number of expressing neurons costained with DARP-32.
Statistical analyses
Instrumental pretraining and training data were analyzed using a one-way (drug) ANOVA. Devaluation was analyzed according to a two-way (drug × devaluation) mixed ANOVA to assess the main effects of drug, devaluation (within-subjects), and the interaction. Post hoc pairwise tests were conducted using Fisher PLSD to follow-up any significant ANOVAs. Expression of pERK in the pDMS was assessed via a two-tailed t test. All tests controlled α at 0.05.
Experiment 3: the effect of PD98059 and vehicle infusions on consolidation of goal-directed learning (within-subject assessment)
Subjects
The study was conducted in two replications with separate cohorts of rats. The initial study was conducted with 16 experimentally naive male outbred Hooded Wistar rats (300–360 g before surgery) obtained from University of Adelaide Animal Research Platform. The replication was conducted with an additional 16 experimentally naive male outbred Long–Evans rats (340–430 g before surgery) obtained from the Animal Resources Centre (Canning Vale, WA).
Surgery
All rats received implantation of a bilateral cannula aimed at the PL and drug infusions as described in Experiment 2.
Drug
PD98059 was dissolved in 40% w/v isotonic saline and 60% DMSO to a concentration of 1 mg/ml, as described in Experiment 2. Details regarding the vehicle solution and infusion volume are the same as described in Experiment 2.
Behavioral protocol
Recovery and food deprivation procedures were the same as those described in Experiments 1 and 2
Magazine training.
Rats were given 2 d of magazine training (days 1 and 2), with 30 outcome deliveries per session and 2 sessions per day, one with grain pellets and one with 20% sucrose solution counterbalanced within groups.
Instrumental training.
Instrumental training was conducted on days 3 and 4. On day 3, rats were trained in a single session with one lever earning either sucrose solution or grain pellets on a continuous reinforcement schedule, terminating once 30 outcomes had been earned. Immediately after the session ended, rats were removed from the chambers and half received bilateral PL infusions of PD98059 while the other half received vehicle. Rats were trained in an identical fashion on day 4 with the alternative outcome and lever. Immediately after the session, rats that had received infusions of PD98059 on the previous day received vehicle, and rats that had received vehicle now received PD98059. The order of outcomes and levers was fully counterbalanced.
Outcome devaluation and extinction test.
Outcome devaluation tests were conducted on days 5 and 6 as described in Experiment 2.
Histology
Rats were killed with a lethal injection of pentobarbital, and their brains removed and sliced on a cryostat. Every fourth section was collected on a slide and stained for cresyl violet to confirm cannula placements using a light microscope. Placements were verified according to the boundaries identified by Paxinos and Watson (2007).
Statistical analyses
Instrumental training data were analyzed using a one-way (drug) ANOVA. Devaluation was analyzed according to a two-way (drug × devaluation) within-subjects ANOVA to assess the main effects of drug, devaluation, and the interaction. Post hoc pairwise tests were conducted using Fisher PLSD to follow-up any significant ANOVAs. All tests controlled α at 0.05.
Results
Experiment 1: instrumental training-induced changes in pERK expression in the PL and the pDMS
This experiment quantified short-term (5 min) and more sustained (60 min) instrumental training-induced changes in pERK in the PL and pDMS following yoked or instrumental training. The behavioral data are presented in Figure 1A, B. All rats in Groups Inst acquired the instrumental response and reached the criterion of earning 30 pellets. Rats in Groups Yoked did not acquire the instrumental response but showed similar rates of magazine entries to Groups Inst. The mean rates of magazine entries for each group are shown in Figure 1A; there were no differences between groups in the mean number of magazine entries across instrumental/yoked training (F < 1.0). The mean rates of instrumental responses (lever presses) for each group are shown in Figure 1B; rats in Groups Yoked made significantly less instrumental responses than those in Groups Inst (F(1,18) = 40.8, p < 0.001). Because of the free-operant nature of the instrumental task, there was variability in the total duration of the session for each rat: average duration in minutes (SD) for Group Inst 5: 18.2 (17.02); Inst 60: 11.7 (4.62); Yoked 5: 14.8 (2.9); Yoked 60: 14.0 (5.0); however, despite this variation, we found that both Groups Inst 5 and Inst 60 made an average of 79% of their total instrumental responses in the last 4 min of training (range 67–97), whereas Groups Yoked made an average of 17 (Yoked 5) and 11 (Yoked 60) percentage of responses in the same time frame. On this basis, we reasoned that learning about the response-outcome relationship occurred primarily in the final few minutes of training for rats in Groups Inst, and as such, pERK expression as a result of instrumental training should be largely related to these last few minutes, rather than the total duration of the session. This was supported by the finding that session duration had no correlation with total pERK expression in the PL in Group Inst 5 (r = 0.14, n = 22, p = 0.53) or Group Inst 60 (r = −0.24, n = 22, p = 0.28). However, pERK expression was strongly correlated with session length for rats in Group Yoked 5 (r = 0.94, n = 22, p < 0.001) and was weakly correlated for rats in Group Yoked 60 (r = 0.45, n = 22, p = 0.04).

Instrumental training increases pERK expression in layers 5–6 of the pPL 5 min after training, and layers 2–3 of the aPL 60 min after training. A, B, Mean rate of magazine entries (A) and mean rate of instrumental responding (lever press; B) during the instrumental/yoked training session for rats in each group. Error bars indicate group means ± SEM. C, Fluorescent image of a coronal 30 μm section (bregma −4.0 mm) showing a representative FG injection in the pDMS. D, Placements and spread of FG injections in the pDMS at their widest point (bregma −0.1 to −0.5 mm) for each rat. E, Fluorescent image of a coronal 30 μm section (bregma 3.7 mm) showing pERK expression (green) and FG retrograde tracing from the pDMS (red) in the PL in each hemisphere. Scale bar, 200 μm. F, Representative PL section (coronal 30 μm section) from one rat in each group showing pERK expression (green) and retrograde FG tracing from the pDMS (red) and colabeled pERK and FG neurons (yellow, indicated by arrows). Scale bar, 100 μm. G–J, Mean number of pERK-positive cells per slice for each rat in layers 2–3 (G) and layers 5–6 (H) of the posterior PL, and layers 2–3 (I) and layers 5–6 (J) of the anterior PL. Bars represent group means. Error bars indicate SEM. *p < 0.05.
FG tracing in the PL
All rats received a unilateral infusion of the FG into the pDMS; a representative injection site is shown in Figure 1C. All rats included in the statistical analysis had FG injections at their widest point between 0.1 mm and 0.5 mm posterior to bregma. The widest point of each injection for each rat is shown in a single plane (representing 0.1–0.5 mm posterior) in Figure 1D. Two animals were excluded from the final analysis due to misplaced pDMS FG injections. Final group numbers were as follows: Group Inst 5, n = 5; Group Yoked 5, n = 5; Group Inst 60, n = 6; Group Yoked 60, n = 6. There were significantly more retrogradely labeled FG neurons in the ipsilateral relative to the contralateral hemisphere to the injection (aPL, F(1,21) = 36.2, p < 0.001; pPL, F(1,21) = 46.7, p < 0.001) and significantly more in layers 5–6 than in layers 2–3 (aPL, F(1,21) = 34.5, p < 0.001; pPL F(1,21) = 61.7, p < 0.001). Individual variation in the number of FG neurons in the aPL was correlated with the size of the FG injection; there was a significant positive correlation with the number of retrogradely labeled neurons in the ipsilateral aPL in both layers 2–3 and layers 5–6 (layers 2–3, r = 0.46, n = 22, p = 0.03; layers 5–6, r = 0.53, n = 22, p = 0.01). However, there was no significant correlation between injection size and contralateral expression in the aPL, or expression in either hemisphere of the pPL (largest r = 0.29, p = 0.19, aPL layers 5–6 contralateral).
This finding may relate to the topographical organization of the PL-pDMS projections; it has been noted in the literature that there is a strong topographical organization of prefrontal projections to the striatum along dorsoventral, mediolateral, and rostrocaudal dimensions; however, this pattern is more clearly observed across structures, rather than within a single structure, although both have been reported (Sesack et al., 1989; Gabbot et al., 2005). However, more recent connectivity tracing in mice shows that that there is a general ventral shift in the primary PL inputs along the rostrocaudal axis of the DMS; specifically, PL inputs are densest in the dorsal region of anterior DMS and shift to more ventral regions of the posterior DMS, although dorsal inputs are still evident (Oh et al., 2014; Hintiryan et al., 2016) (http://connectivity.brain-map.org), and this pattern seems to be particularly strong among anterior PL inputs, suggesting that larger injection sites, including more ventral pDMS regions, may be likely to trace more heavily in the aPL.
Instrumental training increases pERK expression in layers 5–6 of the pPL 5 min after training, and layers 2–3 of the aPL 60 min after training
Four brain slices from each of the aPL and pPL regions were stained for pERK using immunofluorescence. Figure 1E shows a representative bilateral PL section with distributed pERK expression (green) and retrograde FG tracing (red), pERK was not uniformly expressed throughout cortical layers and was predominantly expressed in superficial layers 2–3 with scattered expression throughout layers 5–6. A representative image from the aPL showing pERK and FG expression (colabeled neurons indicated by arrows) for one rat in each group is presented in Figure 1F. Figure 1G, H shows the mean number of pERK-expressing neurons per slice in layers 2–3 and layers 5–6 of the pPL (bregma 2.5–3.2) whereas Figure 1I, J shows the corresponding data from the aPL (bregma 3.7–4.7). There were no differences in pERK expression in the hemispheres ipsilateral and contralateral to the FG injection (F < 2.0) or in the ipsilateral and contralateral hemispheres to the lever (F < 1.0). In the pPL, there was significantly higher pERK expression in layers 2–3 relative to layers 5–6 for Groups Inst 60 (F(1,18) = 4.7, p = 0.04), Yoked 5 (F(1,18) = 8.6, p = 0.009), and Yoked 60 (F(1,18) = 8.2, p = 0.01) but not for Group Inst 5 (F(1,18) < 1.0). Similar results were observed in the aPL: there was significantly higher pERK expression in layers 2–3 than in layers 5–6 for Groups Inst 5 (F(1,18) = 5.7, p = 0.028), Inst 60 (F(1,18) = 27.2, p < 0.001), and Yoked 60 (F(1,18) = 4.8, p = 0.046), but this difference did not reach statistical significance for Group Yoked 5 (F(1,18) = 4.0, p = 0.061).
Each layer was then analyzed separately via two-way (time × training) ANOVAs. In pPL layers 2–3 (Fig. 1G), there was a significant main effect of training (Groups Inst vs Groups Yoked F(1,18) = 5.7, p = 0.03); no main effect of time (5 vs 60, F < 1.0) and no interaction (F < 1.0). This pattern of results was consistent across pPL layers 5–6 (Fig. 1H); there was a significant main effect of training (F(1,18) = 8.2, p = 0.01), no main effect of time (F(1,18) = 1.4, p = 0.3) and no interaction (F < 1.0). Similar results were observed in aPL layers 2–3 (Fig. 1I) and layers 5–6 (Fig. 1J); there was a significant main effect of training (layers 2–3, F(1,18) = 8.8, p = 0.008; layers 5–6 F(1,18) = 5.7, p = 0.03), no significant main effect of time (layers 2–3, F(1,18) < 1.0; layers 5–6 F(1,18) = 3.22, p = 0.9), and no interaction (F < 1.0). Therefore, relative to yoked training, instrumental training produced a rapid (within 5 min) and prolonged (up to 60 min after training) increase in PL pERK expression, and this increase was observed in both the aPL and pPL in all layers assessed.
Follow-up pairwise comparisons (Fisher PLSD) compared the levels of pERK expression 5 or 60 min after instrumental training to their respective baseline yoked controls at each time point. When assessing differences in pERK expression at each time point, Group Inst 5 expressed significantly more pERK than Group Yoked 5 specifically in pPL layers 5–6 (p = 0.04), and Group Inst 60 expressed significantly more pERK than Group Yoked 60 specifically in aPL layers 2–3 (p = 0.01); there were no other significant pairwise comparisons (highest p = 0.08). Therefore, assessment of pERK expression at each time point revealed that, relative to yoked controls, instrumental training generated a significant increase in pERK expression 5 min after instrumental training in pPL layers 5–6 and 60 min after instrumental training in aPL layers 2–3.
Nuclear translocation of pERK 5 and 60 min after training in layers 2–3 and layers 5–6 of the PL
There is substantial evidence that ERK shuttles between the nucleus and the cytosol in an activity-dependent manner and that changes in nuclear concentration are rapid (within a few minutes) and dynamic (Costa et al., 2006). Many of the long-term consequences of ERK1/2 activation rely on phosphorylation and translocation of ERK from the cytosol to the nucleus of the cell, where it can promote the expression of genes under specific transcription factors. Therefore, an important functional consequence of pERK for long-term learning and memory consolidation is its translocation from the cytosol into the nucleus of the cell.
We sought to measure the degree of nuclear pERK expression relative to cytosolic expression in the PL 5 and 60 min after training. To assess this, pERK-expressing neurons were imaged at high resolution (60×) with a DAPI stain to show nuclear boundaries (see Materials and Methods). Figure 2A shows representative neurons with low (top) and high (bottom) ratios of nuclear to cytosolic pERK expression. We hypothesized that the observed increase in pERK expression after instrumental relative to yoked training represented consolidation of instrumental learning and, as such, we hypothesized that this increase would be accompanied by an increase in nuclear pERK expression. Our initial analysis suggested that there was an early (5 min) increase in pERK expression in pPL layers 5–6. We therefore hypothesized that these neurons would show heightened nuclear pERK expression relative to yoked controls. Data were analyzed according to a series of two-way (time × training) ANOVAs within each layer for main effects of time, training, and interaction. The mean background-corrected nuclear/cytosolic plus nuclear (nuc/cyt+nuc) ratio in pPL layer 2–3 neurons for each group are presented in Figure 2B; the total number of neurons analyzed per group were as follows: Group Yoked 5, n = 59; Group Yoked 60, n = 49; Group Inst 5, n = 41; Group Inst 60, n = 61. In layers 2–3, Groups Yoked had significantly lower mean nuc/cyt+nuc ratios than Groups Inst (main effect of training, F(1,206) = 6.7, p = 0.01), there was no main effect of time (Groups 5 vs Groups 60; F < 1.0), but there was a significant time × group interaction (F(1,206) = 11.7, p = 0.001). This significant interaction was followed up with post hoc pairwise tests (Fisher PLSD) to assess specific between-group differences; there was a significant difference between Group Inst 60 and Yoked 60 (p < 0.001), and between Groups Yoked 5 and Yoked 60 (p = 0.003), but not between groups Inst 5 and Inst 60 (p = 0.065). These results therefore indicate that pERK decreased over time following training for Groups Yoked, and this decrease was prevented in rats that had instrumental training, leading to significantly greater nuclear pERK expression 60 min after instrumental training.

Nuclear translocation of pERK 5 and 60 min after training in layers 2–3 and layers 5–6 of the PL. A, Representative pERK-positive neurons expressing relatively low (top) and high (bottom) nuc/cyt+nuc ratios. Scale bar, 20 μm. Insets, Merged images with DAPI (red) to show nuclear boundaries. B–E, Mean nuc/cyt+nuc ratio averaged across all neurons per group in layers 2–3 (B) and layers 5–6 (C) of the posterior PL, and layers 2–3 (D) and layers 5–6 (E) of the anterior PL. Error bars indicate SEM. *p < 0.05. **p < 0.01. ***p < 0.001.
The mean nuc/cyt+nuc ratio in pPL layer 5–6 neurons for each group are presented in Figure 2C. The total number of neurons analyzed per group were as follows: Group Yoked 5, n = 27; Group Yoked 60, n = 17; Group Inst 5, n = 22; Group Inst 60, n = 36. The pattern of results found in layers 5–6 was similar to that found in layers 2–3; however, the difference between Groups Inst and Groups Yoked did not reach statistical significance (F(1,98) = 3.4, p = 0.07), there was no main effect of time (Groups 5 vs Groups 60; F < 1.0), but again there was a significant time × group interaction (F(1,98) = 5.6, p = 0.02). Follow-up post hoc pairwise tests (Fisher PLSD) indicated that there was a significant difference between Group Inst 60 and Yoked 60 (p = 0.004), and between Groups Inst 5 and Inst 60 (p = 0.015), but not between groups Yoked 5 and Yoked 60 (p = 0.327). These results therefore indicate that nuclear pERK increased over time following instrumental but not yoked training, leading to significantly greater nuclear pERK expression 60 min after instrumental training. Together, these results indicate that, in both superficial and deep layers of the pPL, the effect of time on the degree of nuclear relative to cytosolic pERK expression was opposing for Groups Inst and Groups Yoked, whereas nuclear pERK expression was similar between groups at 5 min; at 60 min there was significantly more nuclear pERK expression in Group Inst relative to Group Yoked.
We next assessed the degree of nuclear relative to cytosolic pERK expression in the aPL. Our initial analysis had indicated that neurons in layers 2–3 of the aPL expressed more pERK 60 min after instrumental training relative to their yoked baseline control. We therefore predicted that neurons would express more nuclear pERK 60 min after instrumental training than after 5 min or after yoked training. The mean background-corrected nuc/cyt+nuc ratio in aPL layer 2–3 neurons for each group is presented in Figure 2D; the total number of neurons analyzed per group were as follows: Group Yoked 5, n = 44; Group Yoked 60, n = 35; Group Inst 5, n = 56; Group Inst 60, n = 57. There was no significant difference overall between Groups Inst and Groups Yoked (F(1,188) = 1.7, p = 0.2); there was a significant main effect of time (5 min vs 60 min; F(1,188) = 5.1, p = 0.03) and no interaction (F < 1.0).
The mean background-corrected nuc/cyt+nuc signal for each group in layers 5–6 are presented in Figure 2E. The total number of neurons analyzed per group were as follows: Group Yoked 5, n = 19; Group Yoked 60, n = 7; Group Inst 5, n = 16; Group Inst 60, n = 21. There was a clear main effect of time, with neurons in Group Yoked 60 and Inst 60 expressing significantly higher mean nuc/cyt+nuc ratios than those in Groups Yoked 5 and Inst 5 (F(1,59) = 28.3, p < 0.001); there was no main effect of group (Inst vs Yoked; F < 1.0) and no interaction (F < 1.0). These results indicate that in both superficial and deep layers of the aPL, nuclear pERK expression increases over time after either yoked or instrumental training.
Assessment of pERK activity in pDMS-projecting neurons
The results so far have shown that instrumental training induces increased pERK expression across layers 2–3 and 5–6 of both the aPL and pPL, which is accompanied by an increase in nuclear relative to cytosolic pERK expression in the pPL. Furthermore, instrumental training produces a significant increase in pERK expression above its specific (yoked) baseline in pPL layers 5–6, 5 min after training, and in aPL layers 2–3, 60 min after training. We hypothesize that these increases in pERK expression at 5 and 60 min reflect, at the very least, separate stages of consolidation of recently acquired action–outcome associations, and that this information is subsequently transferred to the pDMS for long-term storage. To assess this hypothesis further, we quantified the degree of colabeling between retrogradely labeled pDMS-projecting neurons (expressing FG) and pERK expression in layers 2–3 and layers 5–6 of the aPL and pPL. Figure 1E shows the distribution of pERK and FG labeling bilaterally in a representative PL section; retrograde FG labeling was strongest in the hemisphere ipsilateral to the pDMS injection (Fig. 1E, right) and was predominantly located in layer 5 with some expression in layer 6 and layers 2–3. FG and pERK colabeling was sparsely expressed throughout both superficial and deep layers of the aPL and pPL; examples of colabeled neurons are indicated in Figure 1F (arrows). Figure 3A, B shows the percentage of FG labeled neurons in layers 2–3 and layers 5–6 of the pPL, respectively, that were colabeled with pERK. We planned a series of orthogonal contrasts to specifically test the hypotheses that pERK expression was heightened in pDMS-projecting pPL layer 5–6 neurons in Group Inst 5, relative to the other three groups. There were no significant differences between groups in layers 2–3 (highest F(1,18) = 1.2, p = 0.3; Group Yoked 5 vs rest). However, in layers 5–6, rats in Group Inst 5 had a significantly higher percentage of FG neurons colabeled with pERK than the other three groups (Group Inst 5 vs rest; F(1,18) = 5.0, p = 0.04), and there were no differences between the remaining three groups (F < 1.0). Therefore, in the pPL, there is a specific increase in pERK expression in pDMS-projecting neurons in layers 5–6, 5 min after instrumental training.

Assessment of pERK activity in pDMS-projecting neurons and pERK expression in the pDMS 5 and 60 min after instrumental or yoked training. A–D, Mean percentage of FG-labeled neurons colabeled with pERK per slice in layers 2–3 (A) and layers 5–6 (B) of the posterior PL and layers 2–3 (C) and layers 5–6 (D) of the anterior PL. Error bars indicate SEM. E, Representative pDMS section (coronal 30 μm section) from one rat showing pERK expression (green) and DARP-32 stained MSNs (red). Scale bar, 100 μm. F, Mean number of pERK-expressing MSNs per slice in the pDMS for each group. Error bars indicate SEM. *p < 0.05.
Figure 3C, D shows the percentage of FG labeled neurons in layers 2–3 and layers 5–6 of the aPL, respectively, colabeled with pERK. We planned a series of orthogonal contrasts to specifically test the hypotheses that pERK expression was heightened in pDMS-projecting aPL layer 2–3 neurons in Group Inst 60 relative to the other three groups. In aPL layers 2–3, rats in Group Inst 60 had a significantly higher percentage of FG neurons colabeled with pERK than the other three groups (Group Inst 60 vs rest; F(1,18) = 4.5, p = 0.048), and there were no differences between the remaining three groups (F < 1.0). In aPL layers 5–6, there were no significant differences between groups (highest F(1,18) = 2.9, p = 0.1; Group Inst 5 vs rest). Therefore, in the aPL, there is a specific increase in pERK expression in pDMS-projecting neurons in layers 2–3, 60 min after instrumental training.
Together, these results highlight two anatomically separate PL-pDMS pathways that show heightened pERK expression at different time points following instrumental training; shortly after training, projections from pPL layers 5–6 show heightened expression, and after 60 min, pERK expression is heightened in projections from aPL layers 2–3.
Assessment of pERK expression in the pDMS 5 and 60 min after instrumental or yoked training
Finally, we sought to quantify pERK expression in pDMS medium spiny projection neurons 5 or 60 min after instrumental or yoked training. It has previously been shown that there is an increase in pERK expression in the pDMS shortly after instrumental training (Shiflett et al., 2010). Previous research has also suggested that the pDMS is not involved in the consolidation of instrumental goal-directed actions (Yin et al., 2005b). Therefore, we predicted that instrumental training would result in increased pERK expression in the pDMS 5 min after instrumental training. We planned a set of orthogonal contrasts deigned to test the hypothesis that pERK expression is heightened in the pDMS in Group Inst 5 relative to the other three groups.
Brain slices containing the pDMS were stained using immunofluorescence for pERK and DARP-32, the specific marker for medium spiny projection neurons (MSNs) in the striatum. Neurons colabeled with pERK and DARP-32 were quantified in the pDMS. A representative image from the pDMS for one rat is shown in Figure 3E. Figure 3F shows the mean number of pERK-expressing MSNs per slice for rats in each group. There were significantly more pERK-positive MSNs in the rats in Group Inst 5 relative to the other three groups (Inst 5 vs rest; F(1,18) = 4.9, p = 0.04), and there were no differences between the latter three groups (F < 1.0). Thus, instrumental training produces an early transient increase in pERK expression in pDMS spiny projection neurons, which contrasts with the more sustained changes observed in the PL, particularly in layers 2–3 of the aPL.
Experiment 2: the role of MEK/ERK activation in the PL in the consolidation of goal-directed learning
We have demonstrated that instrumental training induces a transient, early (5 min) increase in pERK within the population of pPL neurons in layers 5–6 that project to the pDMS, and this is followed by a later (60 min) increase in pERK in a separate population of projection neurons in layers 2–3 of the aPL. Together, these results are consistent with the hypothesis that recently acquired instrumental learning is consolidated in the PL, and that the MAPK/ERK signaling pathway is recruited during this consolidation. We therefore sought to test the role of ERK signaling in the PL in the consolidation of recently acquired instrumental learning. Wu et al. (2001) demonstrated that prolonged MAPK signaling underlying long-term morphological changes relied on the continued activation of MAPK kinase (MEK). We therefore used a MEK inhibitor to prevent pERK activation in the PL during consolidation of goal-directed learning.
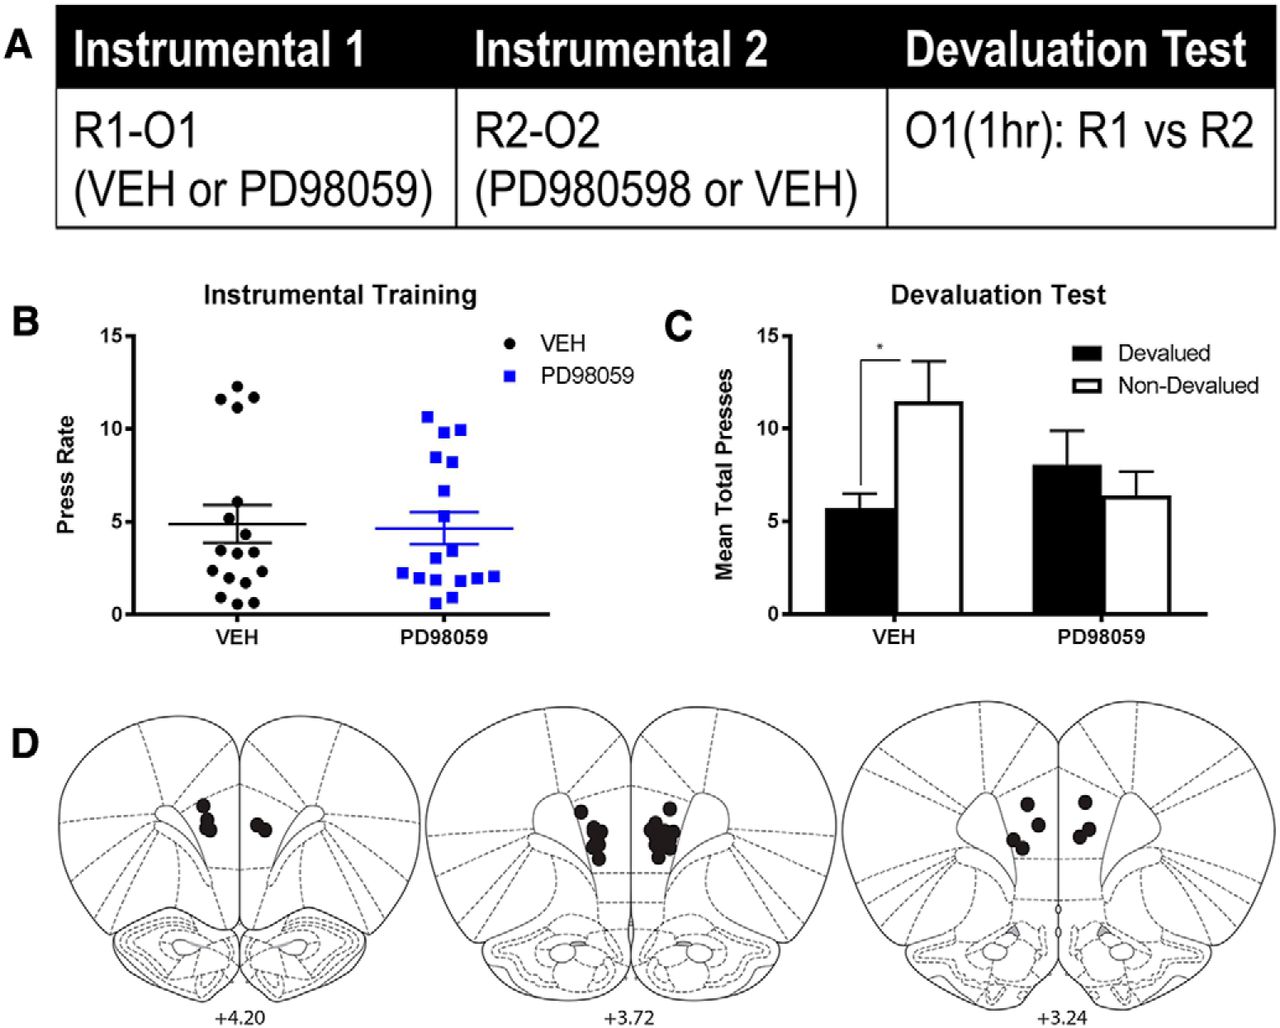
The design of the experiment is presented in Figure 4A. Rats were pretrained on two actions both earning a common outcome (R1-Oc; R2-Oc) before a critical training session in which each pretrained action was followed by one of two new outcomes (R1-O1 and R2-O2). Rats were then immediately given an infusion of the MEK inhibitor, PD98059, or vehicle into the PL and, over the next 2 d, tested for consolidation of learning using an outcome devaluation test with choice between the two actions assessed after devaluation by specific satiety (e.g., O1 [1 h]: R1 vs R2). Figure 4F shows the locations of cannula tips for all animals included in the statistical analysis; 13 rats in total were excluded due to misplaced cannulae or damage. Final group numbers were as follows: Group PD98059, n = 10; Group VEH, n = 9.

The role of MEK/ERK activation in the PL in the consolidation of goal-directed learning. A, Experimental design: rats were pretrained to make two responses (R1, R2) for a common outcome (Oc) and then given instrumental training with two new outcomes (O1, O2) followed by infusions of PD98059 or vehicle. B, C, Mean rate of instrumental responding (lever press) across the 4 d of instrumental pretraining (B) and during the instrumental training session (C) for rats in each group. Error bars indicate mean ± SEM. D, Mean total instrumental responses (lever press) on the lever paired with the devalued and nondevalued outcomes for each group. Error bars indicate SEM. E, Mean number of pERK-expressing MSNs per slice for each rat in each group. Error bars indicate group means ± SEM. *p < 0.05. **p < 0.01. F, Locations of infusion cannula tips for all rats included in the statistical analysis. Adapted with permission from Paxinos and Watson (2007).
Figure 4B, C shows the rate of instrumental responding for rats in each group across instrumental pretraining (Fig. 4B) and during the critical instrumental training session (Fig. 4C); there were no differences between groups in the rate of instrumental responding during pretraining (F(1,17) = 1.5, p = 0.2) or during the critical instrumental training session (F < 1.0). Figure 4D shows the rate of responding on the lever paired with the recently devalued outcome and the nondevalued outcome, averaged across the two tests for rats in each group. Data were analyzed according to a two-way (mixed) ANOVA with devaluation assessed within-subject and drug treatment between-subjects. There was no significant difference between groups in the overall rate of responding averaged across levers (main effect of drug; F < 1.0); however, there was a significant main effect of devaluation, averaged across group (F(1,17) = 10.0, p = 0.006), and there was a significant drug × devaluation interaction (F(1,17) = 4.8, p = 0.042). Follow-up simple effects analyses (Fisher PLSD) showed that there was a significant devaluation effect within Group VEH (p = 0.001) but not in Group PD98059 (p = 0.5). Together, these results show that rats in Group VEH showed a significantly greater outcome devaluation effect than the rats in Group PD98059. These results are consistent with the claim that blockade of MEK/ERK activation in the PL immediately after the acquisition of a new instrumental response-outcome association prevented the consolidation of this learning.
Importantly, we also found evidence that the post-training infusion of PD98059 into the PL reduced pERK expression in the pDMS during the devaluation test. Immediately after the second outcome devaluation test, all rats were killed, and sections containing the pDMS were stained using immunofluorescence for pERK and DARP-32. Neurons colabeled with pERK and DAPR-32 were quantified in the pDMS. The mean number of pERK-expressing medium spiny projection neurons (MSNs) per slice for rats in each group is presented in Figure 4E. There were significantly more pERK-expressing MSNs in Group VEH relative to Group PD98059 (t(1,17) = 2.3, p = 0.036). Thus, blockade of the MEK/ERK pathway in the PL during consolidation of instrumental learning prevented the subsequent expression of goal-directed learning in performance and reduced pERK expression in the pDMS on test.
Experiment 3: the effect of PD98059 and vehicle infusions on consolidation of goal-directed learning (within-subjects assessment)
We have demonstrated that activation of the MEK/ERK pathway in the PL is required for consolidation of a recently learned instrumental association; rats that received an infusion of PD98059 into the PL immediately after instrumental training with two new outcomes failed to show goal-directed behavior on the subsequent test, despite comparable overall rates of responding. However, it is unclear whether this disruption was due to rats' failure to encode the specific action–outcome associations or whether the drug produced a general disruption of all instrumental learning. To test this possibility, we used a within-subject assessment that did not include pretraining, and additionally controlled for effects of drug administration per se on devaluation. The design is presented in Figure 5A.
The effect of PD98059 and vehicle infusions on consolidation of goal-directed learning: Within-subjects assessment. A, Experimental design: rats were trained on separate days to make two responses (R1, R2) for two different outcomes (O1, O2), where one training session was followed by an infusion of PD98059 and the other by an infusion of vehicle. B, Mean rate of instrumental responding (lever press) during the instrumental session followed by vehicle or PD98059 for each rat. Error bars indicate session means ± SEM. C, Mean total instrumental responses (lever press) on the lever paired with PD98059 and vehicle following devaluation of each outcome. Error bars indicate SEM. *p < 0.05. D, Locations of infusion cannula tips for all rats included in the statistical analysis. Adapted with permission from Paxinos and Watson (2007).
Rats were given two sessions of instrumental training spaced 24 h apart, one with each lever-outcome pairing. After one session, they were infused with PD98059; and after the other session, they received vehicle, in counterbalanced order. Rats were then given outcome devaluation tests as previously described. We predicted that all rats would show outcome devaluation on the lever paired with vehicle. However, if PD98059 causes a disruption of the recently acquired instrumental learning, or general amnesia for the recent training, then rats should fail to acquire the instrumental response that was followed by the drug, and should respond significantly less, if at all, on the drug-paired lever relative to the vehicle lever. In contrast, if the post-training infusion of PD98059 specifically abolishes consolidation of the recently acquired action–outcome association without affecting instrumental learning generally, then rats should continue to respond on the lever that was followed by PD98059, but responding on that lever should be insensitive to outcome devaluation.
Fifteen rats were excluded from the statistical analysis due to misplaced cannulas or damage; Figure 5D shows the location of cannula tips for the remaining rats in the experiment (N = 17). Figure 5B shows the rate of responding across the 2 d of instrumental training, there were no differences in rate of instrumental responses during the drug-paired session relative to the VEH-paired session (F < 1.0). Figure 5C shows the total presses across the 5 min test on the lever that was followed by an infusion of PD98059, and the lever followed by vehicle when these actions were devalued and when they were not devalued. Data were analyzed according to a two-way (devaluation × drug) within-subject ANOVA; there was no significant difference in the overall rate of responding on the PD98059 lever relative to the VEH lever (main effect of drug; F(1,16) = 1.04), nor was there a significant main effect of devaluation (F(1,16) = 2.7, p = 0.1); however, there was a significant drug × devaluation interaction (F(1,16) = 6.98, p = 0.02). Follow-up simple effects analysis (Fisher PLSD) showed that there was a significant devaluation effect on responding on the VEH paired lever (p = 0.01) but not on the PD98059 paired lever (p = 0.42). Therefore, blockade of MEK/ERK in the PL immediately after acquisition of a new instrumental response-outcome pairing preserved general instrumental learning but prevented the consolidation the specific response-outcome association necessary for goal-directed learning.
Discussion
The present series of experiments demonstrates that MEK/ERK activation in the PL is necessary for consolidation of recently acquired goal-directed actions. We found that instrumental training produced a general increase in pERK expression in the PL 5 min after training had finished and was sustained at 60 min after training. We also demonstrated that instrumental training produced an increase in nuclear relative to cytosolic pERK expression over time following training in the pPL. We found evidence of two anatomically distinct PL-pDMS pathways that show differential patterns of activation following instrumental training; shortly after training (5 min), there was a transient increase in pERK expression in pPL layer 5–6 neurons that project to the pDMS, whereas 60 min after training, there was an increase in pERK expression in aPL layers 2–3 pDMS-projecting neurons. We hypothesized that these distinct periods of activation reflected separate stages of consolidation of goal-directed learning, or goal-directed learning and its consolidation, respectively. In support of this, blockade of the MEK/ERK pathway in the PL after instrumental training prevented both the expression of goal-directed learning on the subsequent test, and the expression of pERK in the pDMS during that test.
Training-induced changes in pERK expression and nuclear translocation
In Experiment 1, we assessed instrumental training-induced changes in short-term and sustained pERK expression in the PL using three separate measurements; initially, we counted the number of neurons expressing pERK in distinct layers in each region; next, we assessed the distribution of pERK within each of these populations by measuring nuclear relative to cytosolic pERK; and finally, we counted the percentage of pDMS-projecting neurons that coexpressed pERK. Our initial assessment highlighted that instrumental training induced a general increase in pERK expression in all regions and layers; however, when each instrumental group was compared against its baseline yoked control, training produced a significant increase in pPL layers 5–6 at 5 min and in aPL layers 2–3 at 60 min. This finding was supported by the expression of pERK in pDMS-projecting neurons, which were also heightened after instrumental training in pPL layers 5–6 at 5 min and aPL layers 2–3 at 60 min. We hypothesized that this heightened pERK expression represented consolidation of goal-directed learning, and as such, an important functional consequence of its expression for this purpose was its translocation from the cytosol into the nucleus. When we assessed this in the pPL, we observed in both superficial and deep layers that neurons had approximately similar nuclear relative to cytosolic ratios 5 min after either yoked or instrumental training. Strikingly, however, when we measured these ratios 60 min after training, nuclear expression was significantly higher in rats that received instrumental training than those that received yoked training. The precise mechanism for this difference differed in the separate layers: in layers 2–3, this difference was driven by a significant decrease in nuclear pERK from 5 to 60 min in Groups Yoked, whereas in layers 5–6, this difference was driven by a significant increase in nuclear pERK from 5 to 60 min in Groups Inst. In each case, however, the differences in nuclear pERK were not apparent until 60 min after training, despite the finding that instrumental training produced an increase in total pERK expression in the pPL layers 5–6 after 5 min, suggesting a gradual increase in layer 5–6 nuclear pERK concentration following initial activation. The nuclear concentration of pERK is determined by multiple factors, including the balance between activity-dependent influx and efflux; and although the dynamics of nuclear pERK translocation following learning has not been well characterized, gradual accumulation of nuclear pERK over a 60 min time period has been demonstrated previously in living cells (Costa et al., 2006). Using this same logic, if heightened pERK expression in the aPL 60 min after training represented the early phase of a consolidation process in which pERK accumulated in the nucleus over time, we would not expect to observe a training-induced increase in nuclear pERK at this time point. Interestingly, the overwhelming pattern of results in the aPL was a gradual nuclear accumulation over time after either yoked or instrumental training, indicating perhaps a general sensitivity to reward delivery.
MEK/ERK signaling in the PL is required for the consolidation of goal-directed learning
In the hippocampus, stable long-lasting dendritic morphological changes were shown to require both extended MAPK/ERK signaling (up to 60 min), produced by repeated spaced stimulation, and continued activation of MEK (Wu et al., 2001). Interestingly, the present results suggest that these two criteria were also required for consolidation of goal-directed learning in the PL: instrumental training (with repeated, spaced response-outcome pairings) produced sustained pERK expression (up to 60 min) in the PL; and consolidation of this learning required MEK activation. We also demonstrated that it was consolidation of the specific response-outcome learning that was disrupted by MEK inhibition; rats in Experiment 3 responded on the lever paired with the MEK inhibitor at similar overall rates to the lever paired with vehicle, indicating that the general reinforcing properties of the instrumental response had been acquired and consolidated. This finding is consistent with Jonkman et al. (2009), who demonstrated that repeated post-training PL infusions of a protein synthesis inhibitor, anisomycin, did not alter the rate of acquisition of an instrumental response. This, along with our own finding in Experiment 3, provides strong evidence that some aspects of instrumental learning can be consolidated independently of the PL; however, we also found that responding on the lever paired with the MEK inhibitor was insensitive to devaluation, indicating that the drug disrupted consolidation of the specific response-outcome association required for goal-directed action. The precise mechanism via which the MEK inhibitor disrupted consolidation is unknown; however, we hypothesize that the early increase in pERK expression in the pPL and subsequent nuclear pERK accumulation following instrumental training are critical for consolidation of goal-directed learning, and thus the MEK inhibitor disrupted consolidation by preventing this process.
Distinct PL-pDMS pathways may underlie goal-directed learning and consolidation
Projections from the PL to the pDMS arise from two distinct neuronal subpopulations: pyramidal tract neurons, which are predominantly in layer 5 and project ipsilaterally to the striatum and brainstem via the pyramidal tract; and intratelencephalic neurons, which project to the striatum ipsilaterally, contralaterally, and bilaterally from layer 5, and predominantly ipsilaterally from layers 2–3. Given that the vast majority of pDMS projections arise from layer 5, it is interesting that we only saw an increase in pERK expression in these projection neurons in pPL 5 min after instrumental training, and pERK expression in this population had dropped to levels comparable with yoked controls by 60 min. In contrast, activity in aPL pDMS projection neurons in layers 2–3 were at similar levels to controls 5 min after instrumental training but were heightened at 60 min. One possible explanation for this discrepancy may be related to the role of PL neurons in layer 5 and layers 2–3 in learning versus consolidation. We hypothesize that within-session detection of response-outcome contingencies may drive striatal activation via the primary corticostriatal pathway arising from layer 5 and feedback to layer 2–3 neurons in the PL, likely via thalamocortical projections (Cruikshank et al., 2012; Little and Carter, 2012). Layer 2–3 neurons in turn project to the pDMS directly and indirectly via layer 5 to promote feedforward learning in the striatum. Within-session learning thus produces changes in synaptic plasticity in layers 5–6 projection neurons and pDMS MSNs, as reflected by heightened pERK expression in each of these populations shortly after training, however, delayed synaptic changes in the PL may occur primarily in layer 2–3 neurons across the minutes to hours after training has ended. On this point, it is worth noting that this hypothesis generally suggests a sequential process between the distinct layers and regions; however, the exact duration of each of these processes is unclear. Indeed, the data indicate that the increase in pERK expression in the pPL 5 min after training is followed by a gradual accumulation of nuclear pERK observed 60 min later.
It is unknown how and when information consolidated in the PL is transferred to the pDMS; however, it is possible that layer 2–3 neurons in the PL store recently consolidated goal-directed learning temporarily and that this information is transferred to the pDMS either directly or indirectly when the memory is subsequently retrieved and expressed. Long-term memory storage is therefore maintained at the level of the striatum and continuously updated by new learning consolidated in the PL. Alternatively, a critical component of goal-directed learning, perhaps the error signal associated with the learning process, may be consolidated in the PL and transferred to the pDMS where it updates outcome predictions based on specific actions. Critical to these predictions is the demonstration that the direct projection from the PL to the pDMS is necessary for the acquisition of goal-directed learning; and although the current findings provide strong support for this hypothesis, functional inactivation of this pathway during training is needed to provide direct evidence.
These hypothesized functions of the PL-pDMS pathway are consistent with the general interlaminar connectivity of the cortex (Thomson and Bannister, 2003) and with the identification of distinct excitatory projections from layers 2–3 to layer 5 corticostriatal neurons (Anderson et al., 2010). The concept of temporary memory storage also has a strong precedent in the hippocampal memory system; it has now been well established within the fear learning literature that contextual associative memory is initially consolidated and stored in the hippocampus but becomes hippocampal-independent over time (Kim and Fanselow, 1992). Likewise, we have demonstrated that recently acquired goal-directed memory is dependent on pERK signaling in the PL; however, multiple studies have shown that, remotely, goal-directed memory can be both retrieved and expressed in the absence of the PL (Ostlund and Balleine, 2005; Tran-Tu-Yen et al., 2009). Finally, it is worth noting that the nature of the corticostriatal feedback circuit also provides a means via which prior learning stored in the striatum can modulate the magnitude of new learning in the PL, which could serve to regulate this new learning in a manner stipulated by prediction error-based learning theories (e.g., Rescorla and Wagner, 1972). Corticostriatal error-correction processes have been described previously (e.g., Morita et al., 2012), and the current findings suggest an important function that appears to be subserved by this mechanism.
Footnotes
This work was supported by Australian Research Council Grant DP150104878, National Health and Medical Research Council of Australia Grant GNT1089252, and National Health and Medical Research Council of Australia Senior Principal Research Fellowship GNT1079561 to B.W.B. We thank Prof Frederick Westbrook, Dr. Emily Heath, and Dr. Jesus Bertran-Gonzalez for helpful discussions.
The authors declare no competing financial interests.
- Correspondence should be addressed to Dr. Bernard W. Balleine, Decision Neuroscience Laboratory, Level 4, Matthews Building, School of Psychology, University of NSW, Kensington, NSW 2052, Australia. bernard.balleine{at}unsw.edu.au


