

Abstract
Spike-timing-dependent plasticity (STDP) is a form of long-term synaptic plasticity exploiting the time relationship between postsynaptic action potentials (APs) and EPSPs. Surprisingly enough, very little was known about STDP in the cerebellum, although it is thought to play a critical role for learning appropriate timing of actions. We speculated that low-frequency oscillations observed in the granular layer may provide a reference for repetitive EPSP/AP phase coupling. Here we show that EPSP-spike pairing at 6 Hz can optimally induce STDP at the mossy fiber–granule cell synapse in rats. Spike timing-dependent long-term potentiation and depression (st-LTP and st-LTD) were confined to a ±25 ms time-window. Because EPSPs led APs in st-LTP while APs led EPSPs in st-LTD, STDP was Hebbian in nature. STDP occurred at 6–10 Hz but vanished >50 Hz or <1 Hz (where only LTP or LTD occurred). STDP disappeared with randomized EPSP/AP pairing or high intracellular Ca2+ buffering, and its sign was inverted by GABA-A receptor activation. Both st-LTP and st-LTD required NMDA receptors, but st-LTP also required reinforcing signals mediated by mGluRs and intracellular calcium stores. Importantly, st-LTP and st-LTD were significantly larger than LTP and LTD obtained by modulating the frequency and duration of mossy fiber bursts, probably because STDP expression involved postsynaptic in addition to presynaptic mechanisms. These results thus show that a Hebbian form of STDP occurs at the cerebellum input stage, providing the substrate for phase-dependent binding of mossy fiber spikes to repetitive theta-frequency cycles of granule cell activity.
SIGNIFICANCE STATEMENT Long-term synaptic plasticity is a fundamental property of the brain, causing persistent modifications of neuronal communication thought to provide the cellular basis of learning and memory. The cerebellum is critical for learning the appropriate timing of sensorimotor behaviors, but whether and how appropriate spike patterns could drive long-term synaptic plasticity remained unknown. Here, we show that this can actually occur through a form of spike-timing-dependent plasticity (STDP) at the cerebellar inputs stage. Pairing presynaptic and postsynaptic spikes at 6–10 Hz reliably induced STDP at the mossy fiber–granule cell synapse, with potentiation and depression symmetrically distributed within a ±25 ms time window. Thus, STDP can bind plasticity to the mossy fiber burst phase with high temporal precision.
Introduction
The dualistic function of cerebellum as a “learning and a timing machine” has been early recognized (Eccles, 1967; Marr, 1969). The cerebellum can learn and store information about sensorimotor contingencies and thereby control behavior with millisecond precision (Timmann et al., 1999; Osborne et al., 2007). Nonetheless, if and how timing of incoming signal control the induction of long-term synaptic plasticity remained to be demonstrated.
Fundamental elements of spike-timing and long-term synaptic plasticity have been recognized in the cerebellum; and the granular layer, located at the cerebellar input stage, has been proposed to exploit these mechanisms to regulate transmission and storage of complex spatiotemporal patterns (D'Angelo and De Zeeuw, 2009; Gao et al., 2012). On the one hand, different forms of long-term synaptic and nonsynaptic plasticity have been reported at the mossy fiber–granule cell synapse (D'Angelo, 2014), where LTP induction is favored by long high-frequency bursts and strong membrane depolarization, whereas LTD induction is favored by short low-frequency bursts and weak membrane depolarization (Sola et al., 2004; Gall et al., 2005; D'Errico et al., 2009). On the other hand, the mossy fiber–granule cell synapse is endowed with specific molecular mechanisms allowing high temporal precision (Silver et al., 1992; Cathala et al., 2005; Kanichay and Silver, 2008) and controlling the delay and persistence of spike emission (Nieus et al., 2006). Now the question is if and how spike-timing can drive synaptic plasticity. The key to understand this relationship is the observation that granule cells show coherent low-frequency oscillations in rats and monkeys in vivo (Pellerin and Lamarre, 1997; Hartmann and Bower, 1998; Courtemanche and Lamarre, 2005; D'Angelo et al., 2009) so that spike timing-dependent plasticity (STDP) may be able to detect the precise phase relationships between postsynaptic action potentials (APs) and EPSPs.
STDP is a form of long-term synaptic plasticity that exploits the temporal relationship of activity in presynaptic and postsynaptic neurons to regulate the switch between potentiation and depression (called here st-LTP and st-LTD) (Artola and Singer, 1993; Abbott and Nelson, 2000; Caporale and Dan, 2008; Markram et al., 2011). STDP typically requires repetitive EPSP/AP pairing at low frequency with a “time window” of <100 ms and shows a sharp transition between st-LTP and st-LTD; its magnitude is sensitive to the EPSP/AP interval (STDP degrades toward the edges of the time window) and depends on spike back-propagation and membrane depolarization (Markram et al., 1997; Bi and Poo, 1998; Zhang et al., 1998; Stuart and Häusser, 2001; Celikel et al., 2004; Sjöström and Häusser, 2006). STDP is defined Hebbian when potentiation occurs with EPSPs leading APs (st-LTP) and depression occurs with APs leading EPSPs (st-LTD) (Hebb, 1949); vice versa, it is called anti-Hebbian (in both cases, spike back-propagation into the dendrites down to the synapses is needed, otherwise STDP in non-Hebbian). Various forms of STDP have been observed in several brain areas, including neocortex, striatum, hippocampus, and olfactory system (Debanne et al., 1998; Feldman, 2000; Sjöström et al., 2001; Froemke and Dan, 2002; Bender et al., 2006; Cassenaer and Laurent, 2007; Pawlak and Kerr, 2008). A form of non-Hebbian STDP has been observed at the parallel fiber Purkinje cell synapse of cerebellum (Safo and Regehr, 2008; Piochon et al., 2012), and anti-Hebbian STDP has been reported in the corresponding synaptic relay of cerebellum-like structures (electrosensory lobe of fishes and dorsal cochlear nucleus) (Bell et al., 1997; Tzounopoulos et al., 2004; Wu et al., 2015).
In this work, the induction of STDP over a theta-frequency cycle was investigated at the mossy fiber–granule cell synapse of cerebellum. This paradigm reliably led to Hebbian STDP that exploited induction and expression pathways that overlapped in part with those of LTP and LTD induced using duration/frequency-modulated spike bursts (Gall et al., 2005; D'Errico et al., 2009; D'Angelo, 2014). Thus, this study suggests that STDP could have a relevant role in linking spike timing and learning at the input stage of the cerebellar circuit.
Materials and Methods
The experiments reported in this paper have been conducted on 17- to 22-day-old (P0 = day of birth) Wistar rats of either sex according to protocols approved by the local ethical committee and by the European Commission (under Human Brain Project). The rats were anesthetized with halothane (Sigma) and killed by decapitation to remove the cerebellum for acute slice preparation according to a well-established technique (D'Angelo et al., 1995; Armano et al., 2000; Gall et al., 2005).
Slice preparation and solutions.
The cerebellar vermis was isolated and fixed on the vibroslicer's stage (Leica VT12005) with cyano-acrylic glue. Acute 220-μm-thick slices were cut in the parasagittal plane from in cold (2°C-3°C) cutting-solution containing the following (in mm): 130 potassium gluconate, 15 KCl, 0.2 EGTA, 20 HEPES, 10 glucose, pH 7.4 with NaOH. Slices were incubated for at least 1 h at room temperature in oxygenated bicarbonate-buffered (Krebs') solution containing the following (in mm): 120 NaCl, 2 KCl, 1.2 MgSO4, 26 NaHCO3, 1.2 KH2PO4, 2 CaCl2, 11 glucose, pH 7.4 (when equilibrated with 95% O2-5% CO2), before being transferred to a recording chamber mounted on the stage of an upright microscope (Zeiss). The slices were perfused with oxygenated Krebs' solution and maintained at 32°C with a Peltier feedback device (TC-324B, Warner Instrument). For recordings, Krebs' solution was added with the GABAA receptor antagonist SR95531 (10 μm; Tocris Bioscience). Local perfusion with Krebs' solution and 10 μm SR95531 was commenced before seal formation and was maintained until the end of recording.
In a set of experiments, SR95531 (gabazine) was omitted from the extracellular solution. Patch pipettes were pulled from borosilicate glass capillaries (Hilgenberg) and, when filled with the intracellular solution, had a resistance of 7–9 mΩ before seal formation. The whole-cell recording pipettes were filled with the following solution (in mm): 126 potassium gluconate, 4 NaCl, 5 HEPES, 15 glucose, 1 MgSO4 · 7H2O, 0.1 BAPTA-free, 0.05 BAPTA-Ca2+, 3 Mg2+-ATP, 0.1 Na+-GTP, pH 7.2 adjusted with KOH. This solution maintained resting free [Ca2+] at 100 nm. In a different series of recordings, BAPTA was increased to 10 mm.
Electrophysiological recordings.
Recordings were performed with Multiclamp 700B [−3 dB; cutoff frequency (fc),10 kHz], sampled with Digidata 1550 interface, and analyzed off-line with pClamp10 software (Molecular Devices). Just after obtaining the cell-attached configuration, electrode capacitive transients were carefully cancelled to allow for electronic compensation of pipette charging during subsequent current-clamp recordings (D'Angelo et al., 1995, 1999). Mossy fiber stimulation was performed with a bipolar tungsten electrode (Clark Instruments) via a stimulus isolation unit. The stimulating electrode was placed over the central fiber bundle in the cerebellar lamina to stimulate the mossy fibers, and 200 μs step current pulses were applied at the frequency of 0.33 Hz (in specific experiments, paired-pulse stimulation at 20 ms interpulse was used). From comparison with previous data obtained in comparable conditions (Sola et al., 2004; D'Errico et al., 2009), between 1 and 2 mossy fibers were stimulated per granule cells. After evoking EPSCs at −70 mV at the test frequency for 10 min (control period), the recording was switched to current clamp. STDP protocols consisted of pairings of presynaptic and postsynaptic stimulations (60 times at 1, 6, or 10 Hz) with a time interval (Δt) that could either be fixed (phase-locked) or random. During random stimulation, EPSPs always occurred regularly at 6 Hz, but the AP occurred casually between 25 ms and −25 ms. Therefore, the number of EPSPs and APs was the same as in phase-locked STDP experiments. In some experiments, we varied Δt between −100 and 100 ms to fully explore the time window of plasticity induction. The time interval Δt was defined as the time between the onset of the EPSP and the peak of the AP. Presynaptic activity corresponded to mossy fiber stimulations and postsynaptic activity to an AP evoked by a brief (5 ms) depolarizing current step (40 pA) in the recorded granule cell. Long-term synaptic efficacy changes were measured after 20 min. After delivering the STDP protocol, revoltage clamp at −70 mV was reestablished and stimulation was restarted at the test frequency.
The stability of whole-cell recordings can be influenced by modification of Rs. To ensure that Rs remained stable during recordings, passive electrode-cell parameters were monitored throughout the experiments. The granule cell behaves like a lumped electrotonic compartment and can therefore be treated as a simple resistive-capacitive system, from which relevant parameters can be extracted by analyzing passive current relaxations induced by 10 mV hyperpolarizing steps from a holding potential of −70 mV applied 10 ms before each mossy fiber stimulus (D'Angelo et al., 1995, 1999; Silver et al., 1996). The voltage clamp time constant, τvc, was estimated from biexponential fitting to current transients elicited by voltage steps. The 3 dB cutoff frequency of the electrode-cell system was calculated as fvc = (2π × τvc)−1 = 2.1 ± 0.1 kHz (n = 120). Membrane capacitance Cm = 3.2 ± 0.1 pF (n = 120) was measured from the capacitive charge (the area underlying current transient), membrane resistance Rm = 1.6 ± 0.1 GΩ (n = 120) was obtained from the steady-state current flow, also yielding series resistance Rs = τvc/Cm = 30.3 ± 1.4 mΩ (n = 120). In the cells used in this paper, these values did not significantly change after 30 min attesting recording stability. Otherwise, variation of series resistance (Rs) >20% led to the rejection of the experiment.
Postsynaptic currents analysis and data processing.
All EPSCs were digitally filtered at 1.5 kHz and analyzed off-line. EPSC amplitude was measured as the difference between EPSC peak and the current level just before stimulation. The paired-pulse ratio (PPR) between the first and second EPSC in a sequence was PPR = EPSC2/EPSC1. In specific experiments, the acquisition program automatically alternated EPSC with background activity recordings (1 and 9 s, respectively), from which miniature EPSCs (mEPSCs) were detected. mEPSC analysis was performed automatically with Clampfit software, setting a proper threshold for event detection. A further visual inspection of detected signals allowed us to reject noisy artifacts. A 10 min period was used to evaluate mean mEPSC amplitude and coefficient of variation (CV).
Data are mean ± SE, statistical comparisons are done using unpaired Student's t test and differences are considered statistically significant at p < 0.05.
Analysis of neurotransmission.
In voltage-clamp recordings at −70 mV, the fast component of mossy fiber—granule cell EPSCs is generated almost exclusively by activation of AMPA receptors (Silver et al., 1996; D'Angelo et al., 1999). In addition to the fast component (direct response; time to peak <1.5 ms), the EPSCs included a minor slow component (indirect response) due to neurotransmitter spillover (Nielsen et al., 2004; Sola et al., 2004). Neurotransmission failures usually showed only the indirect component. A minority of failures (<2%) without the slow component were considered stimulation failures and were discarded from analysis. The error introduced in amplitude measurement by the failures, which have non-0 amplitude due to the indirect response, was eliminated by setting the amplitude of the indirect responses to 0 (Sola et al., 2004). To investigate the expression mechanism of STDP (Sola et al., 2004; D'Errico et al., 2009; Mapelli et al., 2009), a simplified version of quantal analysis was performed by measuring the mean and SD of EPSC amplitude. All measurements were performed over N = 100 contiguous EPSCs minimizing errors introduced by small samples (data not shown). EPSC changes, which do not strictly require that single synaptic connections are isolated, were obtained from mean (M) and SD (S): the CV = S/M (Eq. 1) and the PPR = M2/M1 (Eq. 2). In general, one should expect that both CV and PPR will increase (decrease) with a presynaptic LTD (LTP) expression, but would not change with a postsynaptic LTD (LTP) expression. The comparison between mean and CV obtained before (State A) and after (State B) the induction of STDP could be performed in the plot (CVB/CVA)−2 < = > (MB/MA) (Eq. 3). The inequality leads to a topological representation of neurotransmission changes (see Fig. 8) and has been extensively used to interpret the plasticity mechanism (Bekkers and Stevens, 1990; Malinow and Tsien, 1990; Sola et al., 2004; D'Errico et al., 2009). Equation 3 has the following properties. For a mean increase: (1) when (CVB/CVA)−2 > (MB/MA), both n and p can increase; (2) when (CVB/CVA)−2 = (MB/MA), only n can increase; and (3) when (CVB/CVA)−2 < (MB/MA), neither n nor p can increase implying an increase in q. A pure increase in q will lie on the axis (CVB/CVA)−2 = 1.
For a mean decrease, complementary parameter changes are predicted. A confident interpretation of the plot can be achieved only providing independent estimates of q and cvq because simultaneous changes of the parameters cannot be excluded by inspection (von Kitzing et al., 1994).
Calcium imaging.
Calcium imaging was performed as reported previously in this same preparation (Gall et al., 2005; D'Errico et al., 2009), by using Oregon green BAPTA-1 (OG1, Invitrogen). Briefly, the intracellular solution was added with 0.2 mm OG1 in substitution to the BAPTA/Ca2+ buffer. Granule cells were identified with a ×63, 0.9 NA water-immersion objective (Olympus). Digital fluorescence images were obtained using an excitation light source from TILL Photonics controlled through Axon Imaging Workbench AIW5.2 (INDEC Systems). Images were acquired with a 50 ms exposure/image at video rate. Acquisition (frame rate = 2 Hz) started after allowing >2 min for dye loading in the neuron. After this time, the resting fluorescence (F0) varied by <5% in each analyzed cell region for the entire recording time, and the background fluorescence (B0) was also stationary. Each protocol was preceded by 2 s of baseline, during which no stimulus was given, to allow subsequent F0 (basal [Ca2+]i) evaluation. [Ca2+]i changes were first elicited during voltage-clamp recordings by depolarizing granule cells from −70 to 0 mV for 400 ms. This depolarization induced [Ca2+]i changes in the dendrites, more evident at the level of terminal digits (Gall et al., 2005): [(ΔF/F0)max = 0.18 ± 0.025; n = 6]. The [Ca2+]i increase at the somatic level was very low [(ΔF/F0)max = 0.035 ± 0.02, n = 6]. All stimulation protocols were separated by a minimum of 60 s to allow [Ca2+]i to return to basal level. Cell damage was identified by the following signs: the failure of 200 ms depolarization at 0 mV in voltage clamp to elicit a fluorescence transient or the sudden inability of fluorescence levels to recover to baseline after stimulation. We never observed bleaching of OG1 basal fluorescence during stimulations.
Stimulus-induced fluorescence changes were analyzed off-line in the regions of interest (ROIs). For each experiment, regions were drawn by eye defining the ROIs in the first image of a sequence, thus giving a set of two-dimensional arrays of pixels. In addition, background fluorescence was evaluated by defining a background area of similar size close to the cell. For each ROI, a measurement of the relative change in fluorescence during cell stimulation, ΔF/F0 (F0 is the mean resting fluorescence), was obtained as follows: for each consecutive image in the sequence, the fluorescence intensity f(n) was evaluated in the ROI. Background fluorescence was measured simultaneously in the background area, B(n). Care was taken to check that background fluorescence was stationary. The background-subtracted fluorescence F(n) = f(n) − B(n) was then used to evaluate ΔF/F0(n) = (F(n) − F0)/F0, where F0 is the average background-subtracted resting fluorescence over four consecutive images before applying the stimulus. This background subtraction procedure was used to account for slice auto-fluorescence and/or fluorescence arising from outflow of dye from the pipette before seal formation. As well as in our previous work (Gall et al., 2005; D'Errico et al., 2009), [Ca2+]i was measured in the granule cell dendritic ending showing the most prominent fluorescence change, to exclude nonsynaptically activated dendrites, in which voltage-dependent calcium channels open due to electrotonic diffusion of depolarization.
Chemicals.
The following chemicals were used at the indicated concentrations: d-APV (50 μm; Tocris Bioscience), SR 95531 hydrobromide (gabazine 10 μm; Tocris Bioscience), and 7-chlorokynurenic acid sodium salt (50 μm; Tocris Bioscience) were dissolved in the extracellular solution. (RS)-1-aminoindan-1,5-dicarboxylic acid (AIDA 15 μm; Tocris Bioscience) was perfused locally through a multibarrel pipette; and ruthenium red (10 μm; Tocris Bioscience) and 1 mg/ml heparin (Tocris Bioscience).
Results
Whole-cell patch-clamp recordings were performed from granule cells in acute cerebellar slices of juvenile rats (P17-P22) using stimulation protocols designed to determine the presence of STDP. The average control EPSC size in the whole experimental dataset was −41.5 ± 2.7 pA (n = 112). After monitoring baseline EPSCs at low-frequency for 10 min, the recording system was switched to current-clamp for STDP induction, then the EPSCs were monitored again for at least 30 min. During induction, mossy fiber stimulation elicited subthreshold EPSPs, which were paired with a single postsynaptic AP generated by a 1 ms somatic current pulse (Fig. 1A). EPSP-AP pairing was repeated 60 times at 6 Hz using different EPSP-AP phases in different recordings (for similar protocols, see Bell et al., 1997; Feldman, 2000; Froemke and Dan, 2002; Froemke et al., 2005; Fung et al., 2016).

Spike timing-dependent induction of long-term synaptic plasticity in cerebellar granule cells. A, Left, EPSC traces (average of 100 individual sweeps) represent the changes observed following induction in different experiments. An EPSP evoked by extracellular stimulation (pre-) was paired with a spike elicited by current injection into the postsynaptic cell (post-). The spike followed or preceded the onset of the EPSP by Δt = ±5, ±25, ±50, and ±100 ms. Pairings was repeated 60 times at at 6 Hz. Right, Plot represents the time course of EPSC amplitude changes for different Δt. For each series, data are expressed as percentage changes in EPSC peak amplitude compared with control (con) before induction (ind). Dashed line indicates the induction time. Each point indicates the average of 50 contiguous EPSC amplitudes. Top, Sample traces have been taken during STDP induction protocol. Data in the plot are mean ± SEM. B, Summary of the change in the EPSC amplitude for different Δt. The STDP timing curve shows EPSC amplitude changes in individual recordings 20 min after induction (each point is the average of 100 EPSC amplitude measurements). C, Average EPSC amplitude changes in the same experiments as shown in B. Data are mean ± SEM. Note the striking transition from maximal LTP to maximal LTD over the narrow time window ∼0 ms.
Phase-locked pairing determines STDP
When EPSP-AP pairing was performed maintaining the same EPSP-AP phase relationship over the 60 repetitions (phase-locking), the sign and degree of EPSC changes depended on the time interval (Δt) between the onset of the EPSP and the peak of the AP (Fig. 1). When the AP followed the EPSP, EPSP-AP pairing with 0 < Δt < 25 ms induced long-term potentiation of EPSC amplitude (st-LTP: 47.4 ± 11.7%, n = 11, p < 0.05), whereas EPSP-AP pairing with 50 < Δt < + 100 ms did not induce any significant changes (−1.5 ± 2.5%, n = 8, p = 0.7). When the AP preceded the EPSP, EPSP-AP pairing with 0 < Δt < −25 ms induced long-term depression of EPSC amplitude (st-LTD: −37.7 ± 8.5%, n = 13, p < 0.005), whereas EPSP-AP pairing with −50 < Δt < −100 ms did not induce any significant changes (−1.9 ± 4.4%, n = 8, p = 0.4). In all cases, st-LTP and st-LTD lasted almost unaltered for the entire duration of recordings attesting their long-term nature (Fig. 1A). The STDP phase-plot showed an almost symmetric shape ∼0 (Fig. 1B). Unless indicated otherwise, the data reported below refer to st-LTP at Δt = 25 ms and st-LTD at Δt = −25 ms (i.e., where the STDP changes were the largest).
To verify the STDP requirement for a phased-locked EPSP-AP pairing, in a series of recordings, the time between the EPSP onset and the AP peak was varied randomly during the theta cycle (Fig. 2A). After random EPSP-AP pairing, EPSC amplitudes were not significantly changed (−1.4 ± 1.9%, n = 5; p = 0.8), showing that STDP induction was critically dependent on the maintenance of a precise EPSP-AP phase relationship over the stimulation cycles.

STDP requirement for a phased-locked EPSP-AP pairing. A, Left, Sample traces of EPSCs in control (con) and 20 min after STDP induction (ind) in a single cell (average of 100 sweeps) after random EPSP-AP pairing. Right, The time course shows average changes in EPSC amplitude after induction with random pairing. Gray lines replotted from Figure 1A indicate STDP at 6 Hz with phased-locked pairing for comparison. Dashed line indicates the induction time. Each point indicates the average of 50 contiguous EPSC amplitude. Top, Sample traces have been taken during randomly STDP induction protocol. Data in the plot are mean ± SEM. B1, Plot represents nonsignificant correlation between EPSP amplitude during induction and EPSC changes at different Δt (linear regression; R2 = 0.03, n = 40; p(F) = 0.85). B2, Average EPSC amplitude changes in the same experiments as shown in B1. Data are mean ± SEM.
Furthermore, because the efficiency of pairing might be affected by the postsynaptic membrane voltage and hence by the activation state of postsynaptic receptors and ionic channels (Stuart and Häusser, 2001), we have considered whether EPSP amplitude could influence STDP. Indeed, there was no significant correlation between EPSP amplitude during induction and EPSC changes at different Δt (linear regression; R2 = 0.03, n = 40; p(F) = 0.85) (Fig. 2B). Thus, the intrinsic EPSP amplitude variability among cells did not influence STDP remarkably.
STDP dependence on the input frequency
A specific question about STDP induction concerns the eligible frequency window. We therefore repeated EPSP/AP pairing at 1 Hz and 10 Hz using Δt = ±25 ms (i.e., where 6 Hz STDP is maximal) for 60 repetitions (to maintain their number constant at different frequencies). Figure 3 shows the time course of EPSC changes with 1 Hz and 10 Hz pairing. With 1 Hz pairing, STDP disappeared leaving only LTD both at positive EPSP/AP pairing (Δt = 25 ms, −33.5 ± 12.1%, n = 5; p < 0.05) and at negative EPSP/AP pairing (Δt = −25 ms, −30.9 ± 8.0%, n = 5; p < 0.005). Conversely, with 10 Hz pairing, STDP was still present showing st-LTP at positive EPSP/AP pairing (Δt = 25 ms, 23.9 ± 5.4%, n = 4; p < 0.05) and st-LTD at negative EPSP/AP pairing (Δt = −25 ms, −18.0 ± 3.1%, n = 5; p < 0.05). It should be noted that STDP induction at 20 Hz was not tested because in that case pairing with Δt = 25 ms or Δt = −25 ms would be equivalent (aliasing frequency) and the experiment would coincide with that already reported by D'Errico et al. (2009), that actually showed net LTP. A summary graph (Fig. 3C) shows st-LTP and st-LTD at different frequencies along with the EPSC changes caused by frequency-dependent long-term synaptic plasticity reported previously for comparison (D'Errico et al., 2009).
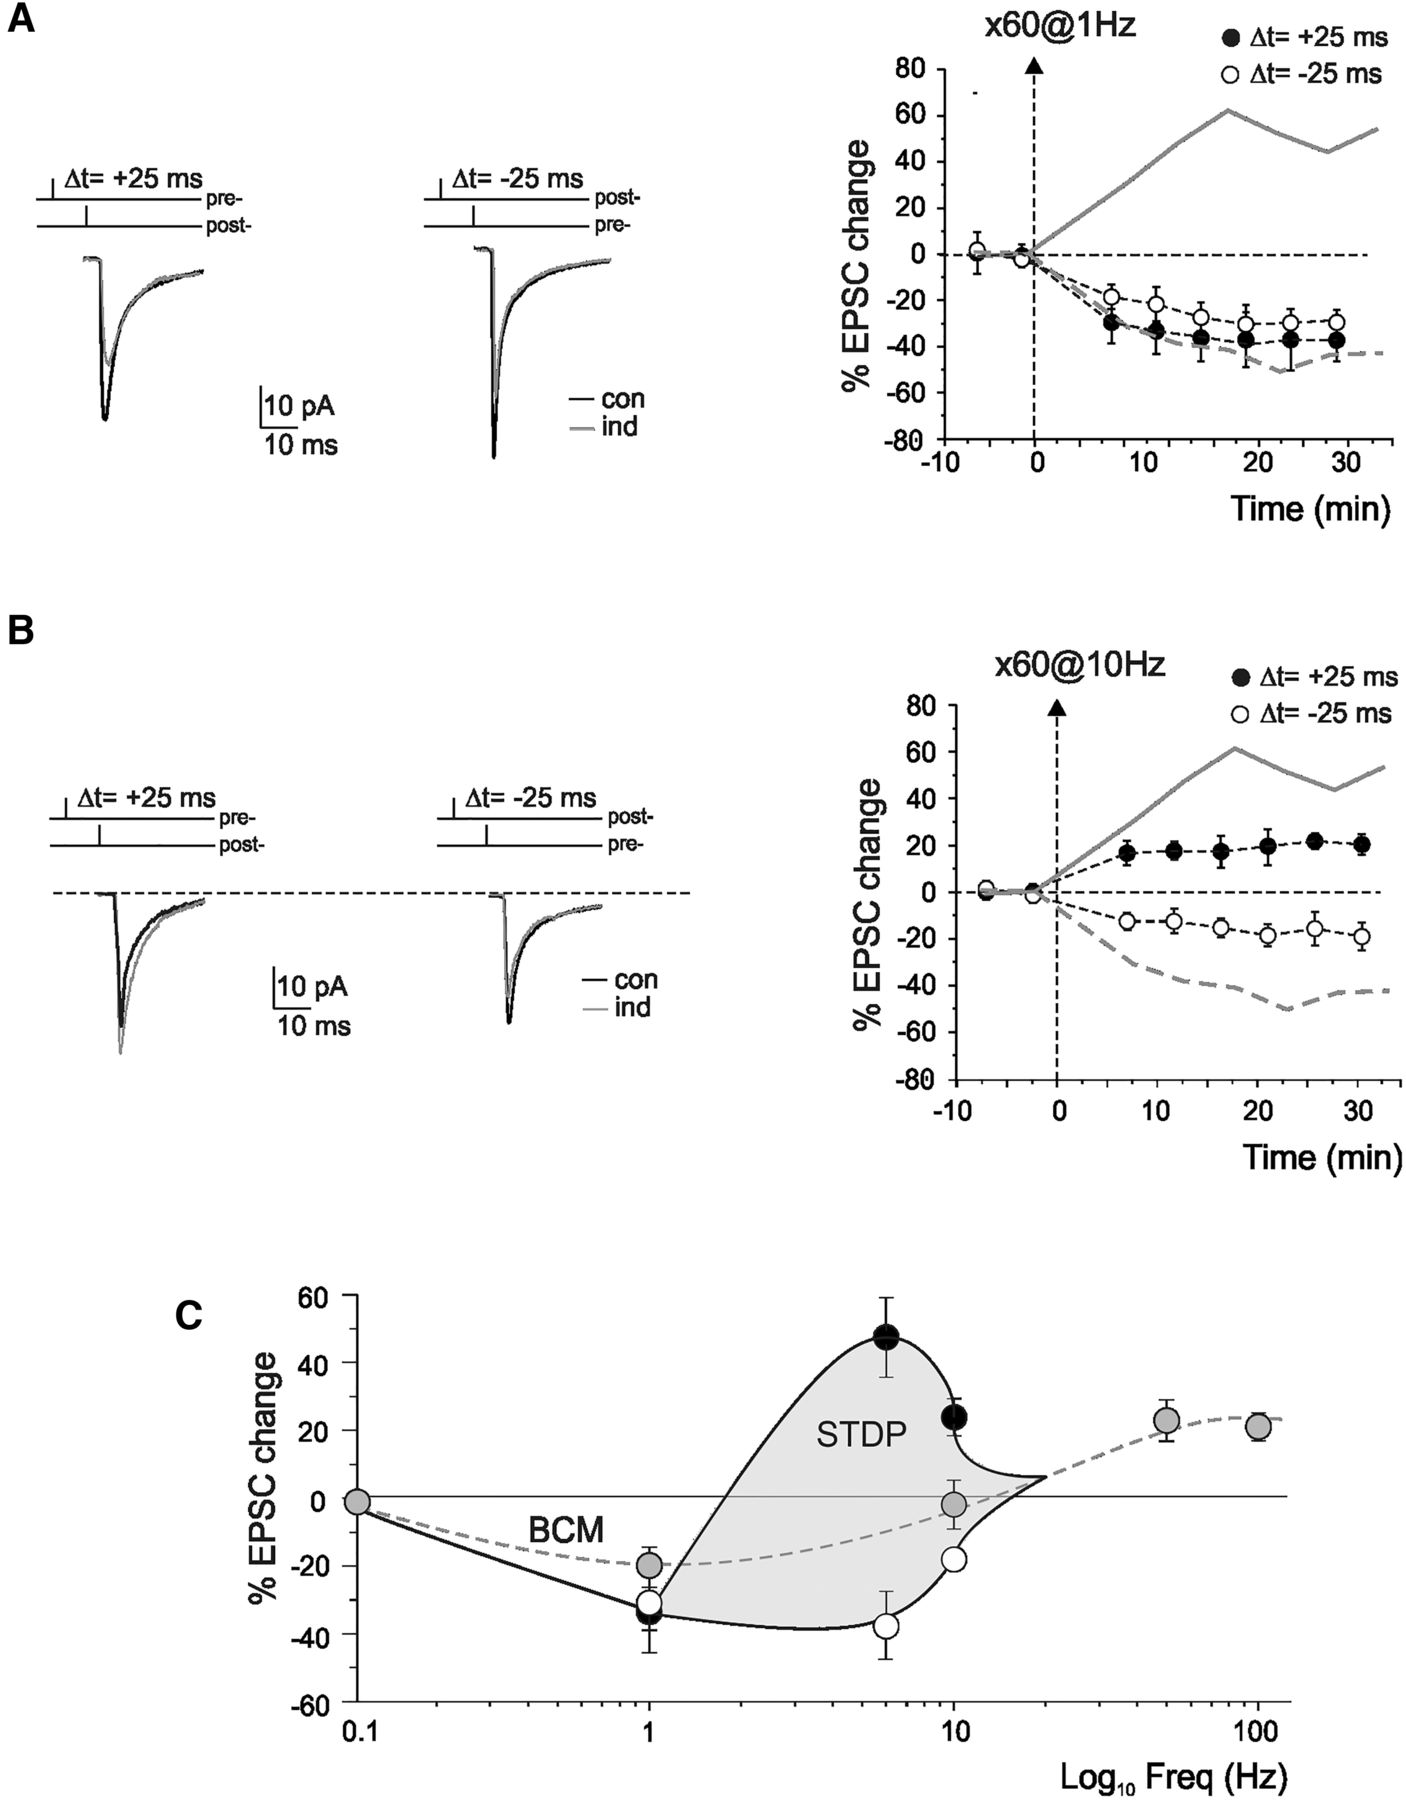
STDP dependence on the input frequency. A, Left, Sample traces of EPSCs in control (con) and 20 min after STDP induction (ind) in a single cell (average of 100 sweeps) after EPSP-AP pairing at 1 Hz. Right, The time course shows average changes in EPSC amplitude after STDP induction. Gray lines replotted from Figure 1A indicate STDP at 6 Hz with phased-locked pairing for comparison. Dashed line indicates the induction time. Each point indicates the average of 50 contiguous EPSC amplitude. Data in the plot are mean ± SEM. B, Left, Sample traces of EPSCs in control (con) and 20 min after STDP induction (ind) in a single cell (average of 100 sweeps) after EPSP-AP pairing at 10 Hz. Right, The time course shows average changes in EPSC amplitude after STDP induction. Gray lines replotted from Figure 1A indicate STDP at 6 Hz with phased-locked pairing for comparison. Dashed line indicates the induction time. Each point indicates the average of 50 contiguous EPSC amplitude. Data in the plot are mean ± SEM. C, The STDP changes obtained following AP-EPSP pairing at 1, 6, and 10 Hz are compared with those obtained from D'Errico et al. (2009). White circles represent st-LTD at Δt = −25 ms. Black circles represent st-LTP at Δt = 25 ms. Gray circle represents Δt = 0 ms. Data in the plot are mean ± SEM.
STDP dependence on postsynaptic Ca2+ changes and GABA-A receptors
In a different series of recordings, to investigate whether STDP depended on postsynaptic Ca2+ concentration ([Ca2+]i) changes, the pipette intracellular solution was supplemented with the calcium buffer, 10 mm BAPTA. Figure 4A shows the time course of EPSC changes. The high concentration of BAPTA prevented both st-LTP (−5.3 ± 5.7%, n = 4; p = 0.4) and st-LTD (3.7 ± 10.1%, n = 4; p = 0.6). These results indicate, therefore, that mossy fiber–granule cell STDP has postsynaptic calcium-dependent induction, like other forms of LTP and LTD at this and other central synapses (Artola and Singer, 1993; D'Angelo et al., 1999; Malenka and Bear, 2004; D'Errico et al., 2009).
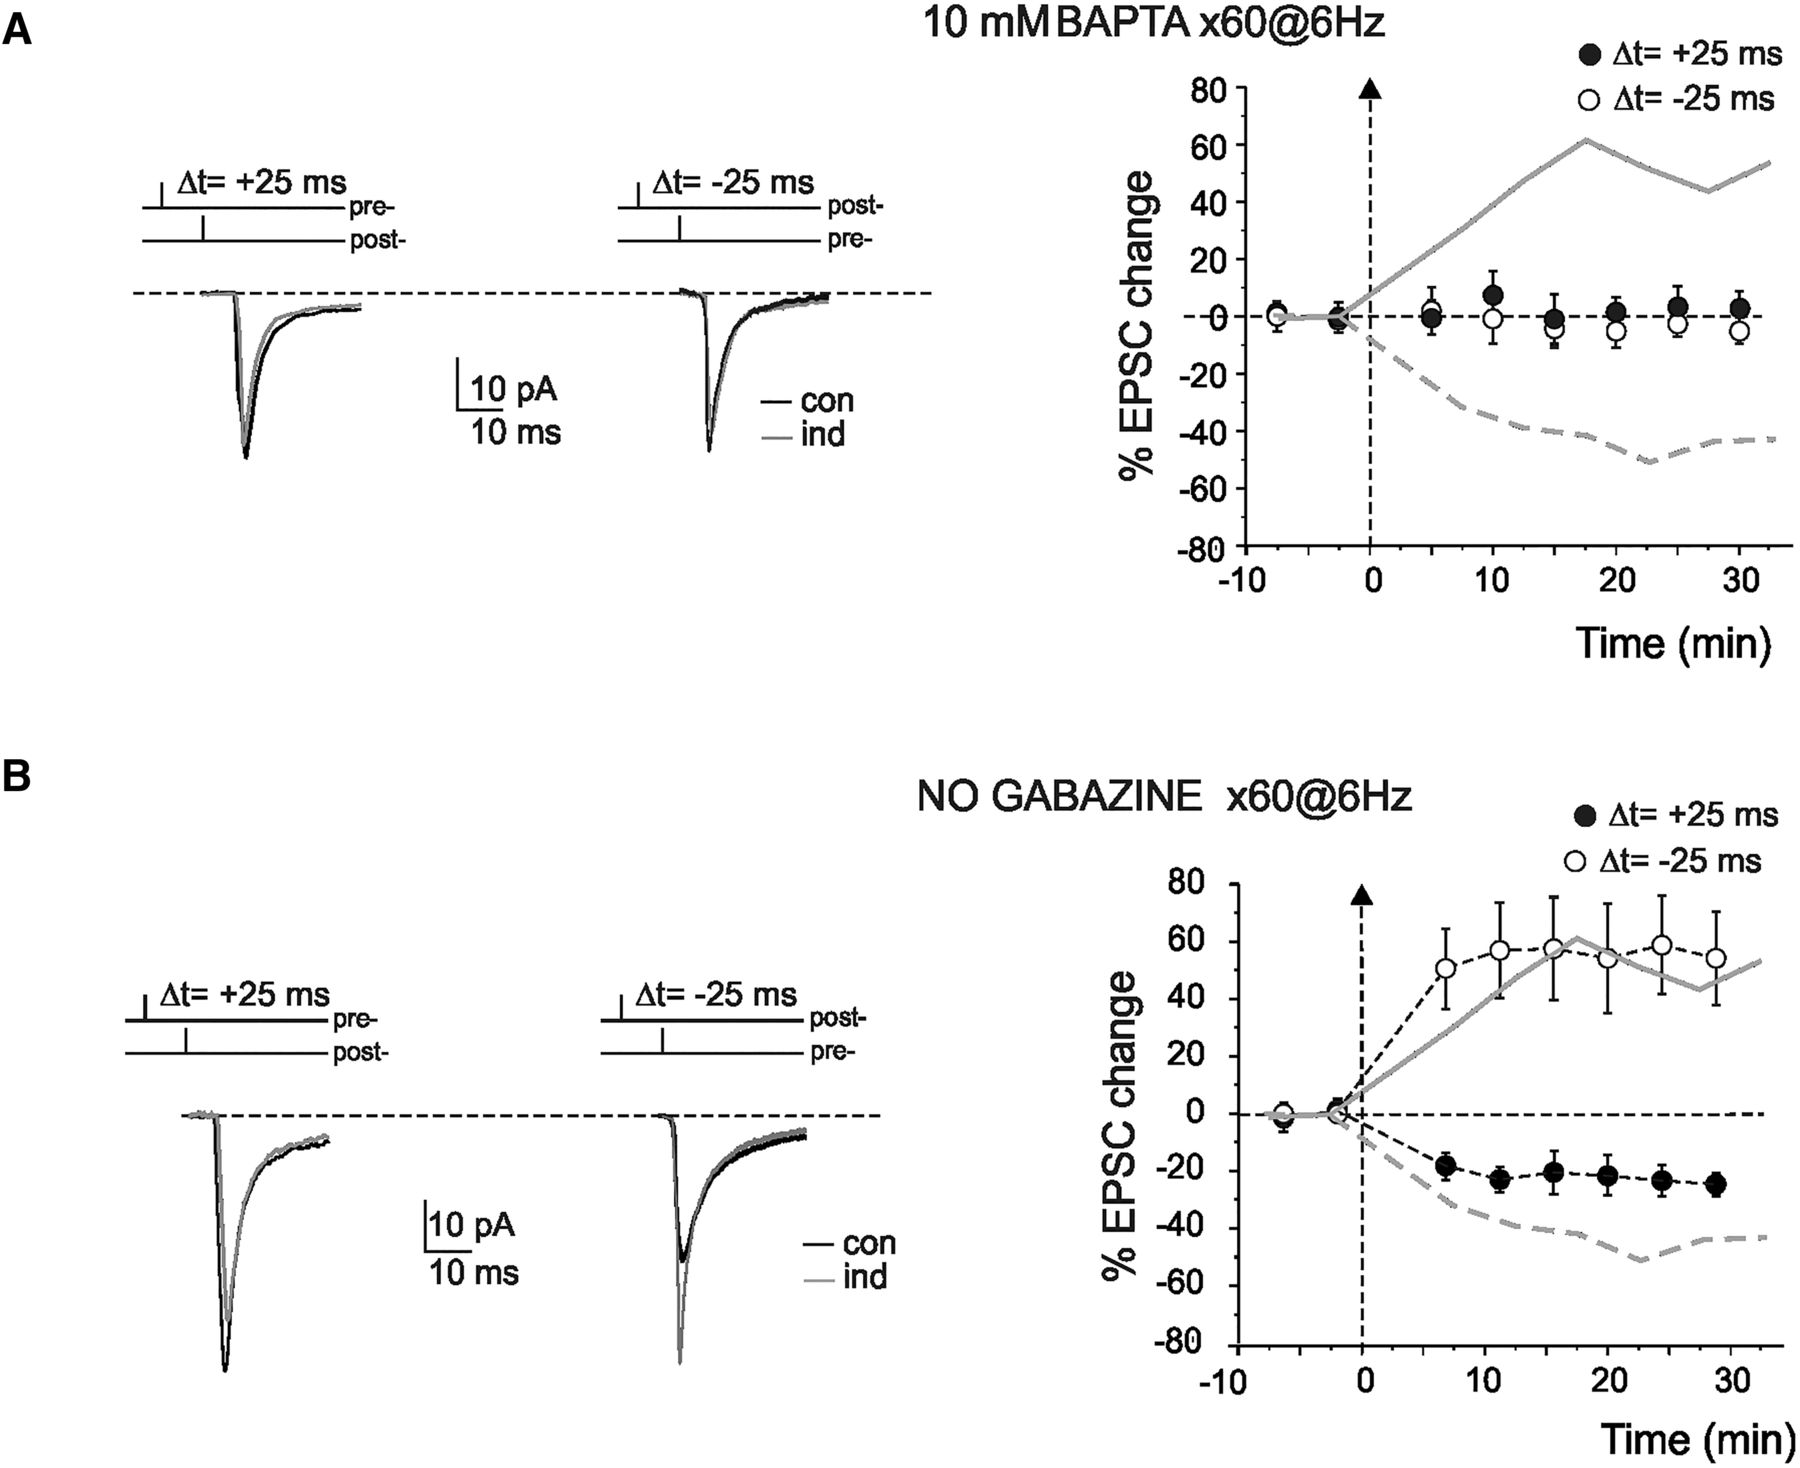
STDP dependence on postsynaptic Ca2+ changes and GABA-A receptors. A, Buffering of postsynaptic Ca2+ with 10 mm BAPTA blocked the induction of LTP. Left, Sample traces of EPSC in control (con) and 20 min after STDP induction (ind) in a single cell (average of 100 sweeps) with 10 mm BAPTA in the intracellular solution. Right, The time course shows average changes in EPSC amplitude after STDP induction using either 0.1 (gray lines) or 10 mm BAPTA-containing intracellular solution. Dashed line indicates the induction time. Each point indicates the average of 50 contiguous EPSC measurements. Data are mean ± SEM. B, Postsynaptic GABAA receptor-mediated inhibition inverted STDP phase dependence. Left, Sample traces of EPSCs in control (con) and 20 min after STDP induction (ind) in a single cell (average of 100 sweeps) without gabazine. Right, The time course shows average changes in EPSC amplitude after STDP induction using either 10 μm (gray lines; replotted from Fig. 1A) or no gabazine-containing extracellular solution. Dashed line indicates the induction time. Each point indicates the average of 50 contiguous EPSC measurements. Data are mean ± SEM.
STDP has been reported to show complex dependence on inhibitory GABA-A receptors (Sivakumaran et al., 2009). In a set of experiments, the GABA-A receptor antagonist gabazine was omitted from the extracellular solution. Figure 4B shows the time course of EPSC changes. Surprisingly enough, the removal of gabazine inverted STDP, so that st-LTD occurred with positive EPSP/AP phase (at Δt = 25 ms, −27.7 ± 4.7%, n = 5; p < 0.05), whereas st-LTP occurred with negative EPSP/AP phase (at Δt = −25 ms, 51.0 ± 17.5%, n = 5; p < 0.01). These results indicate that GABA-A receptor activation can exert a dramatic effect on mossy fiber–granule cell STDP similar to that reported at neocortical synapses (Fino et al., 2010). In the continuation of the work, only experiments in the presence of gabazine have been performed.
The nature of postsynaptic calcium changes during STDP
The relationship between [Ca2+]i changes and STDP was investigated by Ca2+ imaging measurements using 200 μm OG1 in the patch pipette (Gall et al., 2005; D'Errico et al., 2009). The [Ca2+]i increase in the granule cell dendritic endings (Fig. 5A,B), where the mossy fiber synapses impinge, was significantly higher after st-LTP than st-LTD induction [(ΔF/F0)max = 0.31 ± 0.08 vs 0.19 ± 0.028, n = 4; p < 0.05]. It should also be noted that the [Ca2+]i increase started with a greater delay during st-LTD than st-LTD induction (5.9 ± 0.3 s vs 3.2 ± 0.2 s, n = 4; p < 0.05; Fig. 5C). As consequence of combined changes in the size and delay of [Ca2+]i transients, the underlying area (which is related to the total amount of calcium displaced in the cytoplasm) was also significantly increased (Fig. 5C). The relationship between STDP and the maximum [Ca2+]i changes is reported in Figure 5D, showing that the shift between st-LTD and st-LTP occurs across a ∼30% [Ca2+]i increase.
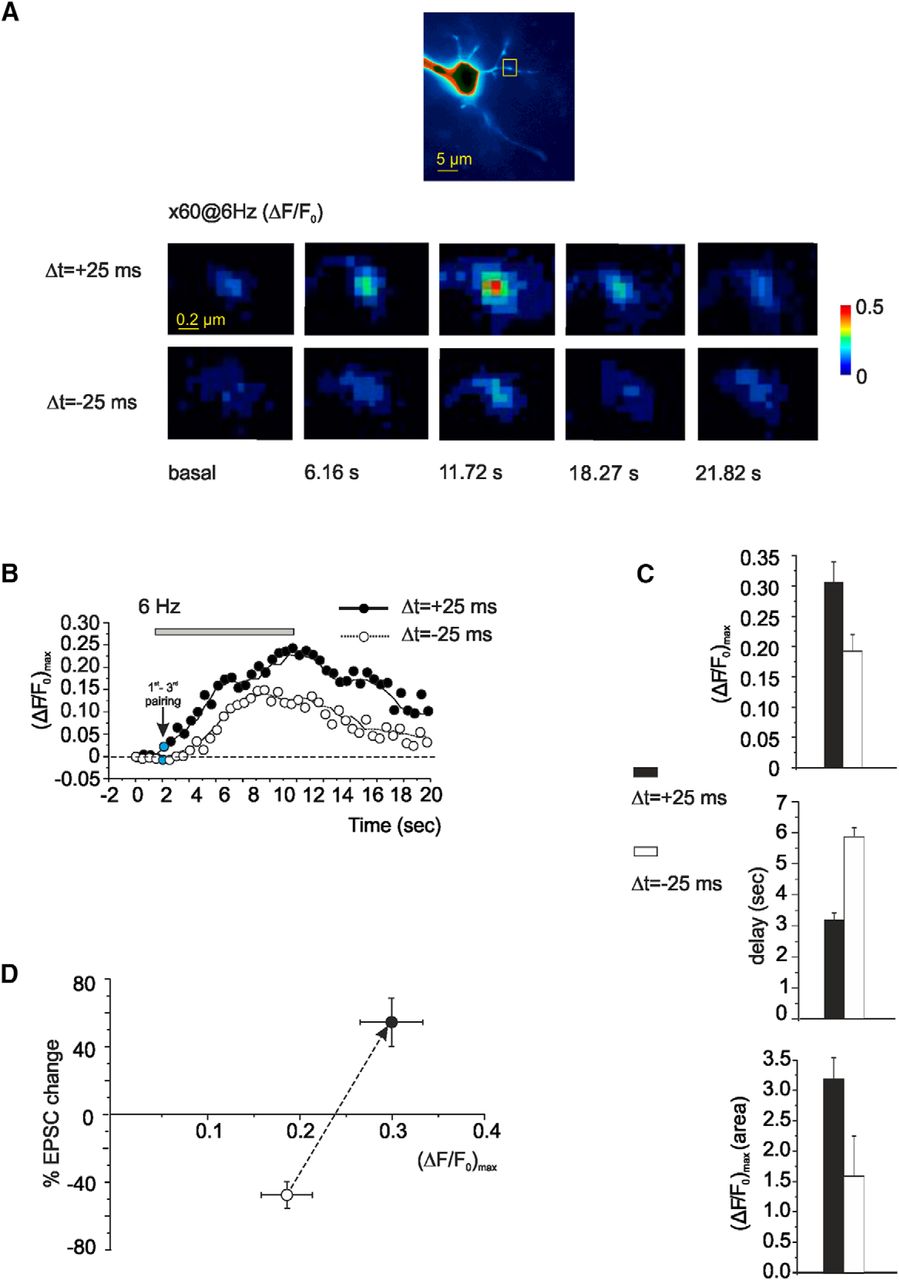
Intradendritic Ca2+ transients evoked during STDP induction protocols. Analysis of Ca2+ transients elicited by the STDP induction protocol at 6 Hz in granule cells filled with 200 μm OG1. A, Top, Fluorescence image of a GrC filled with 200 μm OG1. Scale bar, 5 μm. Fluorescence intensity is color coded with arbitrary units within an interval chosen to allow the visualization of the synaptic terminals. Bottom, The series of pseudo-ratio images illustrate fluorescence changes ΔF/F0 during evoked EPSP paired with spike at Δt = ±25 ms. Yellow square represents the ROI used for measurements. Scale bar, 0.2 μm. B, Traces represent the background-subtracted kinetics of fluorescence changes (ΔF/F0)max, for different STDP induction protocols (Δt = ±25 ms). The stimulation starts 2 s after the beginning of the recording. Gray bar represents the duration of STDP protocols. Each point indicates the Ca2+ transient in response to three consecutive EPSP-AP (or AP-EPSP) pairings. It should be noted that, at the beginning of the pairing period (blue point, i.e., after 3 pairings), the Ca2+ transient was still small and attained plateau near the end of the pairing period (20th point, i.e., after 60 pairings). C, Histograms compare the (ΔF/F0)max amplitude and area, and delay of Ca2+ transients induced by evoked EPSP paired with spike at Δt = ±25 ms. D, The relationship between intracellular Ca2+ changes, [Ca2+]i, and STDP obtained during evoked EPSP paired with the spike at Δt = ±25 ms.
Sensitivity of STDP induction to NMDA and mGlu receptor antagonists
To examine the induction mechanism underlying STDP (Fig. 6), we first evaluated the involvement of NMDARs, which are primarily responsible for the postsynaptic [Ca2+]i changes required for both LTP and LTD at several glutamatergic synapses (D'Angelo et al., 1999; Malenka and Bear, 2004; Dan and Poo, 2006; D'Errico et al., 2009). When the NMDAR blockers d-APV (50 μm) and 7-Cl-Kyn acid (50 μm) were added to the extracellular solution, STDP protocols failed to induce either st-LTP (4.7 ± 2.9%, n = 5; p = 0.2) or st-LTD (−10.6 ± 5.5%, n = 6; p = 0.2). Because, in several cases, activation of mGluRs is also required for LTD and LTP induction (Egger et al., 1999; Bender et al., 2006; D'Errico et al., 2009), we further examined whether st-LTP and st-LTD induction at mossy fiber–granule cell synapse depended mGluRs. During extracellular application of the mGluR antagonist AIDA (15 μm), protocols used for st-LTD induction still caused a significant EPSC reduction (−60.4 ± 11.3%, n = 4; p < 0.05) that was not different from that observed without the drug (p = 0.3). However, during a similar AIDA application, protocols used for st-LTP induction proved inefficient and a significant st-LTD (−16.9 ± 5.4%, n = 5; p < 0.05) was observed in turn.

Ca2+ sources for STDP. Effect of blocking NMDA and mGlu receptors and calcium release from internal stores. Application of 50 μm d-APV and 50 μm 7-Cl-Kyn acid prevented both LTP and LTD induction (Δt = ±25 ms). Application of 15 μm AIDA had no effect on LTD induction (Δt = −25 ms) but blocked LTP induction (Δt = 25 ms). Coapplication of 1 mg/ml heparin and 10 μm ruthenium red in the postsynaptic pipette determined the same effect on STDP induction shown with AIDA perfusion. Dashed line indicates the induction time. A, Left, EPSC traces (average of 100 individual sweeps) represent the changes observed following LTP induction in the presence of d-APV, AIDA, and heparin + ruthenium red. Right, Average time course of EPSC amplitude changes in the presence of d-APV, AIDA, and heparin + ruthenium red. Continuous line indicates st-LTP induction in control conditions. B, Left, EPSC traces (average of 100 individual sweeps) represent the changes observed following LTD induction in the presence of d-APV, AIDA, and heparin + ruthenium red. Right, Average time course of EPSC amplitude changes in the presence of d-APV, AIDA, and heparin + ruthenium red. Gray dashed line indicates st-LTD induction in control conditions. C, Average magnitude of st-LTP and st-LTD 20 min after STDP induction in the presence of d-APV, AIDA, and heparin + ruthenium red. Data are mean ± SEM.
These experiments indicated that both st-LTP and st-LTD required activation of NMDARs, but only st-LTP required mGluR activation for induction. Further pharmacological experiments were performed to determine the engagement of intracellular cascades related to inositol 1,4,5-triphosphate (IP3) receptor- and ryanodine (Ryn) receptor-mediated Ca2+ elevation. We used heparin, a blocker of IP3R-mediated calcium release from intracellular stores (Ghosh et al., 1988) and ruthenium red, a blocker of Ryn receptors and calcium-induced calcium release from intracellular stores (Khodakhah and Armstrong, 1997). During intracellular coapplication of heparin (1 mg/ml) and ruthenium red (10 μm) through the patch pipette, protocols used for st-LTD induction still caused a significant EPSC reduction (−24.6 ± 8.3%, n = 5; p < 0.05) that not was significantly different from that observed without the blockers (p = 0.1). However, during a similar heparin and ruthenium red coapplication, protocols used for st-LTP induction proved inefficient in inducing potentiation (−25.5 ± 12.5%, n = 5; p = 0.1), with an EPSC change that was significantly smaller from that observed without the blockers (p < 0.001).
These results are consistent with the notion that NMDA receptors are needed for both st-LTP and st-LTD and that the mGluRs and an intracellular second messenger cascade controlling calcium release from internal stores are needed for st-LTP only.
Mechanisms of STDP expression: PPR and CV
The mechanism of STDP expression was first assessed by analyzing the PPR (interstimulus interval 20 ms) and the coefficient of variation of EPSCs (CV) (Fig. 7A). PPR is generally considered to reflect changes in the probability of transmitter release in a pair of stimuli (Zucker and Regehr, 2002), whereas CV is a readout of presynaptic variability of quantal transmitter release upon repeated stimulation normalized by the mean (Malinow and Tsien, 1990; Manabe et al., 1993). Therefore, a presynaptic expression mechanism should be accompanied by reduced PPR and CV for st-LTP and by increased PPR and CV for st-LTD. During st-LTP, PPR changed from 0.94 ± 0.05 to 0.76 ± 0.05 (n = 5), showing therefore a significantly reduction by 18.2 ± 6.5% (p < 0.05, n = 5), whereas during st-LTD PPR changed from 0.68 ± 0.10% to 0.84 ± 0.08 (n = 4), showing a significantly increase by 26.3 ± 9.4% (p < 0.01, n = 4). During st-LTP, CV changed from 0.33 ± 0.04 to 0.24 ± 0.04 (n = 9), showing a significantly reduction by −27.9 ± 5.4% (p < 0.005, n = 9), whereas during st-LTD CV changed from 0.27 ± 0.03 to 0.37 ± 0.05 (n = 9), showing a significant increase by 37.1 ± 11.9% (p < 0.05, n = 9). The PPR and CV changes followed the time course of EPSC amplitude (Fig. 1A,B), suggesting that the a bidirectional modification in quantum content took part to mossy fiber–granule cell STDP.

Changes in CV and PPR during STDP expression. A, Average time course of CV and PPR after STDP induction. Dashed line indicates the induction time. Each point is the average of 50 contiguous EPSC measurements. Data are mean ± SEM. B, Histogram compares CV and PPR changes following STDP induction (Δt = ±25 ms).
Mechanisms of STDP expression: minis amplitude and frequency
There is no single method to ascertain the nature of quantal release. For example, the validity of PPR and CV analysis alone has been questioned (mostly at single vesicular release synapses) because changes in quantal content may reflect either increased/decreased transmitter release or expression of new postsynaptic clusters, or possibly, in theory, a simultaneous increase/decrease in quantal size (Nicoll and Malenka, 1999). It is therefore useful to combine PPR and CV analysis with other measurements of neurotransmission phenomena. Additional evidence for a presynaptic or postsynaptic mechanism of expression for STDP can be obtained by analyzing mEPSCs before and after induction of STDP (Kullmann and Nicoll, 1992; Wyllie et al., 1994; Malgaroli et al., 1995), a method that is especially useful at multiquantal release synapses like the present one (Sola et al., 2004; Saviane and Silver, 2006). Because mEPSCs accounted for the whole spontaneous mossy fiber activity, in STDP experiments mEPSCs were recorded without TTX and were used to characterize the STDP expression mechanism (Sola et al., 2004). Here, to prevent mEPSC changes from being obscured by the contribution of nonpotentiated synapses, we activated as many synapses as possible. Indeed, in the recordings used for minis analysis, the EPSCs measured −73.4 ± 8.9 pA (n = 9), indicating activation of three to four mossy fibers by comparison with single fiber EPSCs measured in similar recording conditions (Sola et al., 2004).
After EPSP-AP pairing with Δt = 25 ms, the EPSCs showed 22.0 ± 6.3% increase (p < 0.05, n = 5) attesting effective st-LTP induction. Interestingly, in the same recordings the mEPSCs showed significant increase in both amplitude (16.9 ± 6.3%, n = 5; p < 0.05; Fig. 8A,D) and frequency (18.1 ± 8.7%, n = 5; p < 0.05). After AP-EPSP pairing with Δt = −25 ms, the EPSCs showed −43.8 ± 4.0% change (p < 0.05, n = 4) attesting effective st-LTD induction. In this case, the mEPSCs showed a decrease in both amplitude (−20.1 ± 8.8%, n = 4; p < 0.05) and frequency (−29.8 ± 11.1%, n = 4; p < 0.05; Fig. 8A,D). Further evidence about STDP mechanisms was given by analyzing mEPSC amplitude distributions (Fig. 8B). Accordingly, we measured the mode of the distributions, reflecting the most frequent mEPSC amplitude, and the maximum mEPSC size. After EPSP-AP pairing with Δt = 25 ms, the histogram mode showed a significant shift toward larger amplitudes (4.9 ± 1.2 pA shift, n = 5; p < 0.05) and the mEPSC maximum amplitude significantly increased (8.6 ± 1.3 pA shift, n = 5; p < 0.005). Conversely, after EPSP-AP pairing with Δt = −25 ms, the histogram mode showed a significant shift toward smaller amplitudes (−3.5 ± 1.1 pA shift, n = 4; p < 0.05) and the mEPSC maximum amplitude significantly decreased (−8.0 ± 1.3 pA shift, n = 4; p < 0.01). The variations in mEPSC amplitude were accompanied by a substantial shift in the cumulative frequency distributions (Fig. 8C). Together, these results suggested that a modification in quantum size took part to mossy fiber–granule cell STDP.

mEPSC recordings during STDP. Consecutive tracings showing spontaneous activity before and after STDP induction (Δt = ±25 ms). Following st-LTP induction, both mEPSC amplitude and frequency increased; whereas following st-LTD induction, both mEPSC amplitude and frequency decreased. A, Representative examples of mEPSC before and after STDP induction (Δt = ±25 ms). B, mEPSC amplitude distributions before (gray) and during STDP (blue or yellow). mEPSC amplitude histograms were constructed with 2 pA per bin. Note the shift of the histogram mode with a change in maximum mEPSC amplitude. C, Cumulative frequency distributions before (dashed line) and after STDP induction (continuous line; Δt = ±25 ms). D, The histogram compares mEPSC amplitude and frequency following STDP induction (ΔT = ±25 ms).
Extended analysis of STDP expression mechanisms over the whole Δt range
The analysis of STDP expression was extended over the whole Δt range covered in these experiments. The EPSC mean amplitude changes were accompanied by symmetric CV variations, so that CV changes were usually positive for st-LTD and negative for st-LTP. In Figure 9A, the ensemble CV-M plot for LTP and LTD showed a significant negative linear correlation passing near the origin (R2 = −0.637; n = 53; p < 0.0001). Therefore, STDP changes appeared to exploit a continuous modulation of expression mechanisms with a neutral point ∼0-phase.

The relationship between CV and mean EPSC amplitude during STDP expression. Plots represent obtained points at different Δt (same as in Fig. 1). Single data points (left) and average data grouped per category (right). A, Plots represent the relationship between CV and EPSC changes at different Δt. During st-LTP (Δt = 25 ms), EPSC CV decreased and EPSC amplitude increased, whereas the opposite occurred during st-LTD (Δt = −25 ms). Linear regression over the points was statistically significant (slope = −0.54 ± 0.11, intercept = 11.6 ± 5.2; R2 = −0.63.; n = 45; p < 0.0001). B, (CVB/CVA)−2 < = > (MB/MA) shows that most points fall close to the unitary diagonal. Data in average plots are mean ± SEM.
A further way to determine whether EPSC changes depend on quantum content or quantum size is to plot (CVpost/CVpre)−2 versus (Mpost/Mpre) (Bekkers and Stevens, 1990; Malinow and Tsien, 1990; Sola et al., 2004) (see Materials and Methods; Fig. 9B). Using binomial statistics (Eq. 3), this plot has the property that the unitary slope diagonal divides points determined by increased quantum content (on or above the diagonal) from those determined by increased quantum size (below the diagonal). In our experiments, st-LTP points fell both above the diagonal corresponding to a rise in quantum content and below the diagonal corresponding to an increase of quantum size. The st-LTD points corresponding to a reduction in quantum content or in quantum size fell in the complementary sectors. Together, these results point to a mixed presynaptic and postsynaptic STDP expression mechanism (Sola et al., 2004; D'Errico et al., 2009).
Discussion
This work reveals the existence of STDP at the rat cerebellar mossy fiber–granule cell synapse. While st-LTP was induced when EPSP led AP, st-LTD was induced when AP led EPSP according to the Hebbian principle of coincidence detection between presynaptic and postsynaptic activity. In this respect, mossy fiber–granule cell STDP is similar to that observed at different synapses mostly located in the neocortex and hippocampus (Magee and Johnston, 1997; Markram et al., 1997; Bi and Poo, 1998; Debanne et al., 1998; Egger et al., 1999; Feldman, 2000; Sjöström et al., 2001; Froemke and Dan, 2002; Dan and Poo, 2004; Tzounopoulos et al., 2004). To our knowledge, this is the first evidence that Hebbian STDP occurs in the cerebellum because previous observations only reported either non-Hebbian STDP at the parallel fiber-Purkinje-like cell synapse (Safo and Regehr, 2008; Piochon et al., 2012) or anti-Hebbian STDP at the corresponding synapses of cerebellum-like structures (Bell et al., 1997; Tzounopoulos et al., 2004; Wu et al., 2015). It should be noted that, different from Purkinje cells, granule cells show a rapid and complete spike back-propagation into the dendrites (Diwakar et al., 2009; Dover et al., 2016), so that information about AP generation can be faithfully transmitted to synaptic sites providing a key requirement for Hebbian STDP.
Mossy fiber–granule cell STDP was detected using repeated cycles on the theta-frequency band and depended on precise positive or negative phase locking, such that it was abolished by random pairing. It should be noted that STDP was no longer visible at 1 Hz and that, with an STDP time-window covering 50 ms, STDP should not extend beyond 20 Hz (i.e., the “aliasing” frequency at which the positive and negative phase coincide). In a tentative reconstruction (Fig. 3C), STDP was comprised within the 1–20 Hz region and appeared as a bifurcation around the BCM (Bienenstock et al., 1982) curve generated by 0-phase locking at the same synapse (D'Errico et al., 2009).
STDP induction involves a combination of membrane and cytoplasmic mechanisms
At the mossy fiber–granule cell synapse, the induction of STDP required a postsynaptic intracellular Ca2+ increase that was significantly larger for st-LTP than st-LTD. Although both st-LTP and st-LTD depended on NMDAR activation, only st-LTP was prevented by mGluR antagonists and by blockers of RynR and IP3R. Thus, STDP seems to use molecular pathways in common with burst duration/frequency modulated LTP and LTD.
It is generally accepted that the pattern of postsynaptic Ca2+ increase plays a critical role in determining the polarity of long-term synaptic plasticity, such that a moderate Ca2+ increase induces LTD, an intermediate Ca2+ increase has poor effect and high Ca2+ increase induces LTP (Malenka and Bear, 2004). In STDP, the Ca2+ increase determined by NMDAR activation can act as a trigger for both st-LTP and st-LTD induction (Bi and Poo, 1998; Shouval et al., 2002; Bi and Rubin, 2005; Froemke et al., 2005; Dan and Poo, 2006) as well as for other forms of plasticity (e.g., see Malenka and Bear, 2004). Our results suggest that a similar STDP induction mechanism applies also to the mossy fiber–granule cell synapse of cerebellum. Accordingly, the higher Ca2+ increase observed at positive EPSP/AP phase probably reflects the enhanced unblock of NMDA channels when a simultaneous AP raises membrane depolarization. However, the switch between st-LTD and st-LTP also requires additional mechanisms based on mGluRs and intracellular release of calcium from RynR- and IP3R-gated internal stores.
The narrow coincidence detection window for st-LTD (Δt = −25 ms) is consistent with known NMDAR (Ascher et al., 1992; D'Angelo et al., 1994) and AP kinetics (D'Angelo et al., 1998). With a precession of up to 30–40 ms, AP afterhyperpolarization can depress subsequent EPSP-related membrane depolarization and therefore NMDAR unblock (Froemke et al., 2005). This would lead to a reduced Ca2+ influx, which in turn activates phosphatases, such as calcineurin (Wang et al., 2005), rather than kinases, downregulating NMDARs and promoting synaptic depression (Seol et al., 2005; Pawlak and Kerr, 2008). Conversely, an AP in phase with the EPSP could temporarily enhance Ca2+ influx reversing the chain of effects and leading to activate kinases as well as a Ca2+-induced Ca2+ release from intracellular stores (Berridge, 1998; Finch and Augustine, 1998; Sabatini et al., 2001), eventually causing st-LTP. Indeed, calcium stores blockade using heparin and ruthenium red prevented st-LTP but not st-LTD, suggesting that this pathway provided an additional source of postsynaptic Ca2+ needed for potentiation.
The mGluRs activated during repeated stimulation cycles may serve to reinforce the intracellular Ca2+ signal as a consequence of perisynaptic glutamate buildup (Irving et al., 1992; Kinney and Slater, 1993). At the concentrations used, AIDA is especially effective on mGluR1, the dominant mGluR expressed postsynaptically in cerebellar granule cells (Fotuhi et al., 1993). Thus, because mGluR1 activates PLC to generate IP3, which triggers calcium release from intracellular stores, AIDA may eventually prevent the activation of this reinforcing pathway.
On the same line, the STDP inversion determined by GABA-A receptors may involve a regulation of membrane potential and intracellular calcium (Fino et al., 2010). In summary, although the precise mechanisms require further clarification, NMDA, mGlu, and GABA-A receptors, membrane ionic channels, and calcium stores contribute to tune intracellular calcium changes and the phase-dependent switch between st-LTD and st-LTP.
STDP expression involves a combination of presynaptic and postsynaptic mechanisms
It was of interest to compare the STDP expression mechanisms with those of LTP and LTD induced by duration/frequency modulated trains. CV and PPR significantly and persistently increased with st-LTD and decreased with st-LTP. In support to their specificity, the magnitude and time course of these changes paralleled that in EPSC amplitude. Because PPR and CV changes with a sign opposite to EPSC amplitude changes are assumed to reflect changes in quantal release (Schulz et al., 1994; Saviane and Silver, 2006), the present results suggest that presynaptic mechanisms are involved in STDP expression. If the expression mechanism was purely presynaptic, though, a pure mEPSC frequency increase should be expected. However, mEPSC revealed significant bidirectional changes both in amplitude and frequency. Thus, a change in quantum size should have occurred together with that in quantum content and contribute to explain STDP expression. Consistent with a composite presynaptic and postsynaptic mechanism, the st-LTP and st-LTP points fell in sectors of the (CVB/CVA)−2 versus (MB/MA) plot corresponding to changes in both quantum size and quantum content (Bekkers and Stevens, 1990; Malinow and Tsien, 1990; Sola et al., 2004).
This composite mechanism differs from that reported using similar recording and analysis methods in the same preparation when LTP and LTD are induced by bursts of variable duration or trains of variable frequency (Sola et al., 2004; D'Errico et al., 2009). In burst/train-dependent plasticity, the magnitude of LTP and LTD was significantly smaller than st-LTP and st-LTD. Moreover, in LTP and LTD, expression turned out to be purely presynaptic and the estimated changes in release probability were in fair agreement with the EPSC amplitude changes. It is tempting to speculate that the larger changes observed in st-LTP and st-LTD compared with burst/train-dependent plasticity are caused by the additional engagement of postsynaptic mechanisms (e.g., see Isaac et al., 1996) using a classical pairing protocol.
Conclusions and functional implications
The observation of STDP at the mossy fiber–granule cell synapse opens new perspectives to understand how plasticity might operate at the cerebellum input stage. STDP was optimal in the theta-frequency band (6–10 Hz). This is actually a range of frequencies at which coherent oscillations have been detected in the granular layer (Pellerin and Lamarre, 1997; Hartmann and Bower, 1998). Thus, STDP at mossy fiber–granule cell synapse could provide a mean to coordinate learning at the cerebellar input stage with activity generated in extracerebellar structures, such as the neocortex and striatum, which show coherent oscillations with the cerebellum (Courtemanche and Lamarre, 2005; Courtemanche et al., 2013; Frederick et al., 2014). Accordingly, a recent theoretical work predicted that the granular layer circuit conforms to a learning scheme, such that incoming patterns are first stored in an oscillating inhibitory interneuron network (Kleberg et al., 2014; Garrido et al., 2016), like that formed by GABAergic Golgi cells (Dugué et al., 2009), to later instruct STDP at the mossy fiber–granule cells synapse. It is interesting in this context that activation of GABA-A receptors could actually invert the STDP phase dependence, making it anti-Hebbian. Although the molecular mechanisms of GABAergic regulation remain puzzling (Sivakumaran et al., 2009; Fino et al., 2010), it could provide a powerful mechanism multiplying the number of possible STDP configurations at mossy fiber–granule cell synapses. STDP could therefore be instrumental to bind cerebellar learning to low-frequency oscillations in the thalamocortical and hippocampal circuits to coordinate learning and memory during specific functional states, such as voluntary movement, resting attentiveness, and sleep (Parker, 2015; Cheron et al., 2016). Specific experiments may now be designed to investigate the implications of mossy fiber–granule cell STDP for cerebellar learning and for STDP-based control schemes (Luque et al., 2016).
Footnotes
This work was supported by European Union Grant Human Brain Project HBP-29 604102 to E.U.D. and Fermi Grant 13(14) to E.U.D. and T.S.
The authors declare no competing financial interests.
- Correspondence should be addressed to Dr. Egidio Ugo D'Angelo, University of Pavia, Department of Brain and Behavioral Sciences, via Forlanini 6, 27100 Pavia, Italy. dangelo{at}unipv.it


