

Abstract
Electrical stimulation of the auditory periphery organ by cochlear implant (CI) generates highly synchronized inputs to the auditory system. It has long been thought such inputs would lead to highly synchronized neural firing along the ascending auditory pathway. However, neurophysiological studies with hearing animals have shown that the central auditory system progressively converts temporal representations of time-varying sounds to firing rate-based representations. It is not clear whether this coding principle also applies to highly synchronized CI inputs. Higher-frequency modulations in CI stimulation have been found to evoke largely transient responses with little sustained firing in previous studies of the primary auditory cortex (A1) in anesthetized animals. Here, we show that, in addition to neurons displaying synchronized firing to CI stimuli, a large population of A1 neurons in awake marmosets (Callithrix jacchus) responded to rapid time-varying CI stimulation with discharges that were not synchronized to CI stimuli, yet reflected changing repetition frequency by increased firing rate. Marmosets of both sexes were included in this study. By comparing directly each neuron's responses to time-varying acoustic and CI signals, we found that individual A1 neurons encode both modalities with similar firing patterns (stimulus-synchronized or nonsynchronized). These findings suggest that A1 neurons use the same basic coding schemes to represent time-varying acoustic or CI stimulation and provide new insights into mechanisms underlying how the brain processes natural sounds via a CI device.
SIGNIFICANCE STATEMENT In modern cochlear implant (CI) processors, the temporal information in speech or environmental sounds is delivered through modulated electric pulse trains. How the auditory cortex represents temporally modulated CI stimulation across multiple time scales has remained largely unclear. In this study, we compared directly neuronal responses in primary auditory cortex (A1) to time-varying acoustic and CI signals in awake marmoset monkeys (Callithrix jacchus). We found that A1 neurons encode both modalities using similar coding schemes, but some important differences were identified. Our results provide insights into mechanisms underlying how the brain processes sounds via a CI device and suggest a candidate neural code underlying rate–pitch perception limitations often observed in CI users.
Introduction
Temporally modulated signals are critical components of vocal communication sounds of humans and animals (Rosen, 1992) and encoded by neural firings in auditory cortex (Joris et al., 2004; Wang et al., 2008). In modern cochlear implant (CI) processors, the information about temporal aspects in the acoustic environment is delivered through modulated electric pulse trains (Wilson et al., 1991). It is therefore of great interest how such signals are represented by the central auditory system. Relatively few studies have investigated how auditory cortex represents temporally modulated CI stimulation and nearly all focused on phase-locked (synchronized) responses to slow temporal modulations. Schreiner and Raggio (1996) found that neurons in the primary auditory cortex (A1) of anesthetized cats showed phase-locked responses to CI pulse trains delivered at repetition rates up to 20 Hz and CI pulse trains with faster repetition rates evoked only transient responses at the onset of the pulse train. Middlebrooks (2008) found phase-locked responses to amplitude modulated CI pulse trains at modulation rates as high as 60 Hz in A1 of anesthetized guinea pigs and suggested that it is unlikely that higher modulation frequencies are encoded by A1 neurons with phase-locked responses. These findings collectively suggest that A1 neurons only respond to slow temporal modulations in CI stimulation with stimulus-synchronized firing.
Previous studies have left open the question of how higher-frequency modulations in CI stimulation might be represented by auditory cortex. In acoustic hearing, modulations in the range of 50–500 Hz provide periodicity information relevant to speech voicing, manner, intonation, and stress (Rosen, 1992). CI users have been shown to perceive increases in pitch with increases in CI modulations rate >50 Hz with an upper limit of temporal pitch of ∼300 Hz (McKay et al., 1994; Zeng, 2002; Baumann and Nobbe, 2004), which is beyond the range of modulation rates that can be represented by A1 neurons (Middlebrooks, 2008). One important consideration of previous CI physiology studies is the use of anesthesia, which is known to affect temporal processing of auditory cortex neurons (Goldstein et al., 1959; Zurita et al., 1994; Ter-Mikaelian et al., 2007). Studies in both acoustic hearing (Wang et al., 2005) and electrical hearing (Kirby and Middlebrooks, 2012; Chung et al., 2014) animals have reported marked differences in neural responses between awake and anesthetized preparations. Previous studies in awake, normal hearing animals suggest that rapid temporal modulations are represented implicitly by the firing rate of subpopulations of auditory cortex neurons (Lu et al., 2001b; Bendor and Wang, 2007; Gao and Wehr, 2015). Until now, such coding schemes have not been explored systematically for CI stimulation.
The present study investigated how A1 neurons under the awake condition respond to CI stimuli delivered across a wide range of modulation rates using a newly developed nonhuman primate CI model: marmoset monkeys (Callithrix jacchus) (Johnson et al., 2012). In addition to A1 neurons that exhibited stimulus-synchronized discharges to slow modulations in CI stimulation, we discovered a separate population of A1 neurons, previously unreported in CI physiology studies, with non-stimulus-synchronized discharges that represented rapid CI stimulation with increased firing rates. Interestingly, the increase in average firing rate across this neuronal population plateaus at ∼300 Hz, near the upper limit of temporal pitch perceived by CI users (McKay et al., 1994; Zeng, 2002; Baumann and Nobbe, 2004). These findings shed new light on our understanding of how A1 processes time-varying CI stimulation.
Materials and Methods
Experimental design and statistical analysis.
All experimental procedures were approved by Johns Hopkins University Animal Use and Care Committee. Four adult (three males, one female) common marmosets were implanted unilaterally in the right cochlea with a CI electrode array with eight functional contacts (Cochlear). Details of this electrode array, marmoset cochlear anatomy, and surgical approach have been described in previous studies (Johnson et al., 2012). The data in this study included single-unit recordings from eight hemispheres of four marmosets using acoustic or CI stimulation. Only units that were CI responsive and/or acoustic responsive were included in the analyses (n = 326). Of these, 187 were responsive to CI pulse trains and 237 were responsive to acoustic click trains. Our recent work showed that the left hemisphere (contralateral to CI) was much more responsive to CI than the right hemisphere (Johnson et al., 2016). Therefore, the population data of CI-responsive units consisted of 159 units from left hemispheres and 28 units from right hemispheres. Acoustic stimulation was more effective in activating both hemispheres and the population data of the units responsive to acoustic clicks consisted of 146 units from the left hemispheres and 91 units from the right hemispheres.
The statistical significance of the stimulus-driven firing rate of a neuron compared with the spontaneous firing rate was determined by the Wilcoxon rank-sum (WSR) test (p < 0.05). In addition, because some neurons had very low spontaneous firing rates, significant responses were also required to have stimulus-driven firing rates higher than spontaneous firing rate on ≥50% of trial repetitions. Stimulus-synchronized temporal response patterns were quantified by the vector strength (VS) (Goldberg and Brown, 1969). Two criteria had to be met for a response to be considered stimulus synchronized. First, the VS had to be statistically significant using the Raleigh test (Rayleigh >13.8, p < 0.001) (Mardia and Jupp, 2000). Second, the stimulus-driven firing rate had to be statistically significant as described above. Onset responses (<100 ms) were excluded from the VS calculation.
CI surgery.
CI surgery was conducted concurrently with the head after implantation, which was described in detail by Lu et al. (2001a). The array was inserted through a cochleostomy centered ∼1 mm anteroinferior to the round window. The lead wire and connector plug was imbedded in the head cap and connected to a custom current stimulator during experimental sessions. In two animals (M57U and M77W), the CI electrode array was inserted into an otherwise intact cochlea. In the other two animals (M5X and M3Y), the cochlea was deafened immediately before array insertion with multiple intrascalar injections of neomycin sulfate (10% solution), which is toxic to hair cells (Nuttall et al., 1977). Perilymph was gently removed by suction at the cochleostomy margin and the cochlea was filled with neomycin solution using a flexible syringe inserted through the cochleostomy. After 1–2 min, the fluid in the cochlea was removed by suction and filled again with neomycin solution. This process was repeated four times. To further remove the possibility of residual auditory input in these two animals, the middle ear ossicles of the implanted ear were disarticulated and the incus removed. The ossicles were not removed in the nondeafened animals. The opposite (left) ear remained acoustically intact in all animals. After surgery recovery, electric auditory brainstem responses (EABRs) were measured to confirm effectiveness of electric CI stimulation to activate the auditory pathway. When neural recordings began in each animal, the current levels used were initially based on the levels used in the EABRs and were then adjusted based on animal tolerance and cortical neural responses.
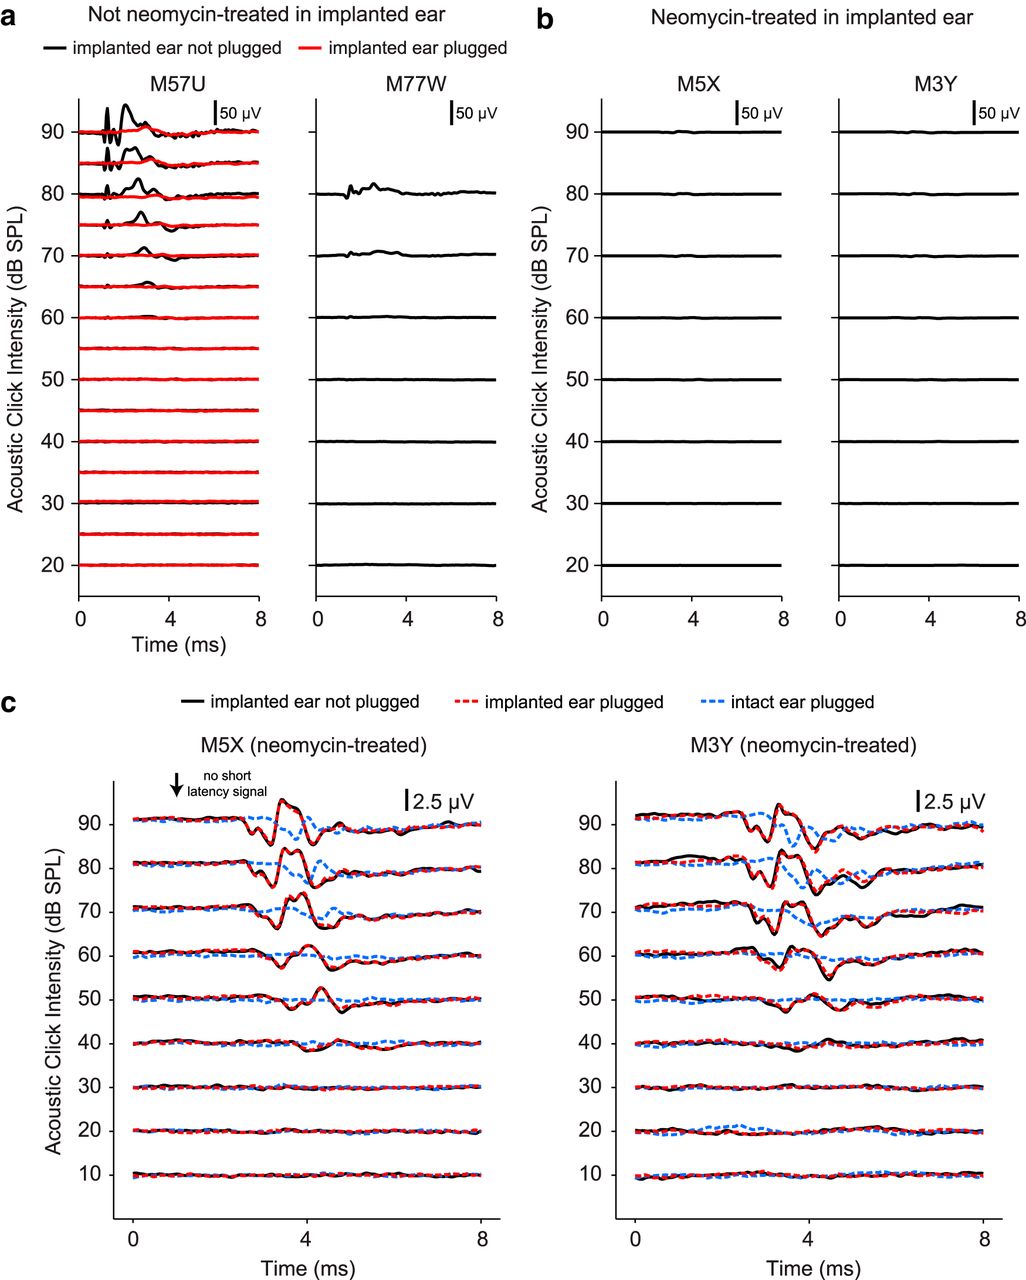
Residual acoustic hearing was assessed by measuring responses to rectangular acoustic clicks (0.1 ms duration) using differential recordings from the most apical and basal CI electrode contacts. An extracochlear contact in the neck served as ground. Stimuli were presented at various sound levels from a free-field speaker 1 m in front of the animal, as used during cortical recording sessions. Signals were amplified (10,000×) and band-pass filtered at 100–3000 Hz. Auditory responses can potentially include (in order of latency): cochlear microphonic and auditory nerve compound action potential (from the implanted ear) and brainstem responses (from either implanted or nonimplanted ear). At high sound levels (≥60 dB SPL), animals not treated with intrascalar injections of neomycin sulfate had prominent short latency responses (Fig. 1a, left, black trace), likely reflecting the cochlear microphonic and auditory nerve compound action potentials and some degree of residual hearing. Elevated response thresholds of the implanted ear were likely due to electrode insertion trauma and cochlear hair cell loss (Kennedy, 1987; Ni et al., 1992). In all animals, the implanted ear was occluded with ear impression material during neural recording sessions. This proved to be effective in substantially reducing auditory responses in animals not treated with neomycin (Fig. 1a, left, red trace). In neomycin-treated animals, no early response was observed up to 90 dB SPL (Fig. 1b). The highest sound level typically used in cortical recording sessions was 80 dB SPL. Signals shown in Figure 1b are enlarged in Figure 1c (black trace) and show responses at longer latencies (>2.5 ms), which likely reflect brainstem responses to acoustic input to the intact ear. Figure 1c also shows signals recorded in two control conditions: implanted ear plugged (red trace) and intact ear plugged (blue trace). The red trace is almost identical to the black trace, indicating that plugging the implanted ear has no effect on the recorded signal. However, the auditory responses measured with the intact ear plugged are significantly reduced (Fig. 1c, blue trace). Note the absence of short-latency responses in all traces. These data suggest that the long-latency signals (>2.5 ms) observed in neomycin-treated animals are from brainstem responses due to auditory input to the intact ear, not the implanted ear. With deafness confirmed in two animals and ear occlusion used in all animals, our recordings largely reflect neural responses to monaural acoustic (left ear, intact) or monaural CI (right ear, implanted) stimulation. However, two nondeafened animals clearly had some residual acoustic hearing and, unlike neomycin-treated animals, would potentially receive limited auditory input through the implanted ear outside of recording sessions in the housing environment.

Assessment of residual acoustic hearing in animals unilaterally implanted with CI electrodes. Signals measured from intracochlear CI electrodes 9–2 (apical-basal) in the four animals used in this study. a, Acoustic responses from the two animals not treated with intrascalar injections of the ototoxic drug neomycin. Responses from one animal (M57U) exhibited short latency responses to acoustic clicks delivered at high sound levels (left, black traces). Signals measured from this animal with the implanted ear occluded with an ear impression material are overlaid on the plot (left, red traces). Ear plug significantly reduced the auditory responses, which was the condition used in all animals during cortical recording sessions to remove possible auditory input to the implanted ear. Only weak auditory responses were observed in the other animal (M77W). Traces shown in these plots are the average of 60 click presentations. The maximum sound level typically used during the reported cortical recordings was 80 dB SPL. The short-latency responses at high sound levels were presumed to be the cochlear microphonic and auditory nerve compound action potential. b, Acoustic responses of the two neomycin-treated animals showed no short latency responses, as expected given that the cochlea was deafened with neomycin sulfate immediately before CI electrode implantation. These traces are the average of 1200 click presentations. c, Signals measured from the two neomycin-treated animals using a scale of 2.5 μV instead of 50 μV. These plots show the same signals as in b (black trace), with two additional recording conditions: implanted (neomycin-treated) ear plugged (red trace) and intact ear plugged (blue trace). The red trace is almost identical to the black trace, indicating that plugging the implanted ear had no effect on the recorded signal. However, the signal measured with the intact ear plugged is significantly reduced (blue trace). Short-latency responses (<2.5 ms) are absent in all traces. These data suggest that the long-latency signals (>2.5 ms) observed in neomycin-treated animals are from brainstem responses due to auditory input to the unimplanted ear, not the implanted ear.
Neurophysiology.
Recording sessions were performed in a double-walled, soundproof chamber (Industrial Acoustic) with an interior covered by 3-inch acoustic absorption foam (Sonex). Daily sessions typically lasted 3–5 h and recordings continued for several months after implantation (3 and 13 months in nondeafened animals and 6 and 8 months in deafened animals). Animals were trained to sit quietly in a custom semirestrained primate chair and did not perform any behavioral tasks. The vigilance state of the animal was not controlled; however, animals were closely monitored by video during recordings and data collection was paused if we saw signs of the animal closing its eyes. Single units were recorded in A1, alternating every 1–2 weeks between hemispheres. Units were recorded using tungsten microelectrodes (2–5 MΩ; A-M Systems) positioned within a small craniotomy (∼1.1 mm diameter) and isolated online using a template-based spike discriminator (MSD; Alpha Omega Engineering). Spike times and raw data traces were digitized (Tucker Davis Technologies) and saved to hard disk. A water-based hydraulic microdrive (Kopf Instruments) was used to advance the electrode slowly (25–50 μm steps). Our search methods likely bias our sample toward supragranular layers 2/3. After each unit was isolated, its responsiveness to acoustic and CI stimulation was tested.
Acoustic and CI stimuli.
Acoustic stimuli were generated digitally in MATLAB (The MathWorks), converted to analog signals (Tucker Davis Technologies), amplified (Crown Audio), and delivered to a free-field speaker (B&W-600S3) positioned 1 m in front of the animal. Once a unit was isolated, its basic acoustic response properties were determined [best frequency (BF), rate-level characteristics]. To obtain the BF of units, frequency tuning curves were made using tones or band-pass noise (≤1 octave) 100–200 ms in duration in 0.1–0.2 octave steps over a range of 1–4 octaves. Rate-level functions were determined using BF stimuli delivered from −10 to 80 dB SPL in 10 dB steps. Acoustic click train stimuli (500 or 1000 ms duration, ≥1000 ms interstimulus interval) consisted of sinusoids at the unit's BF that were amplitude modulated by a Gaussian envelope (Lu and Wang, 2000). The bandwidths of the clicks were determined by the SD parameter σ, which was typically set to 0.2 ms, but ranged from 0.1 to 0.4 depending on unit preference. Sound intensity of click train stimuli were typically set at the peak of the unit's rate-level function if nonmonotonic or ∼20–30 dB above threshold if monotonic.
CI stimuli were generated digitally at a 2.5 MHz sampling rate and delivered to a custom current stimulator through a National Instruments digital I/O PCI board. The eight-channel bipolar stimulator used in these studies was developed by Dr. Philip Loizou's CI Laboratory at University of Texas–Dallas under a National Institutes of Health National Institute on Deafness and Other Communication Disorders contract (Kim et al., 2009). Electrically isolated, charge-balanced biphasic current pulses (100 μs per phase, 50 μs interphase gap) were delivered to adjacent intracochlear electrode contacts. We refer to CI stimulation as the electrical stimulation delivered to one of seven contact pairs during experiment recording sessions. CI stimulation occurred only during experimental sessions; animals were not stimulated chronically using a CI device. Contacts on the array were numbered 9 (most apical) through 2 (most basal). We refer to the pair of contacts current is passed through as a CI electrode (e.g., electrode 9–8 is the most apical pair of contacts; electrode 3–2 the most basal). In one animal, M3Y, electrode 3–2 had much higher impedance than other electrodes and was not used. Our initial characterization of CI responsiveness included testing each unit's response to single pulses, as well as pulse train stimuli with repetition rates ranging from 4 to 488 Hz delivered to each CI electrode systematically. Stimuli were presented at a wide range of current levels, typically 30–130 μA for M57U and M77W and 50–160 μA for M5X and M3Y.
Extensive effort was made to identify parameters (i.e., electrode, level, rate) that could drive unit firing. If there was any indication of a driven response, CI-tuning curves (analogous to frequency-tuning curves) were made using the estimated best repetition rate delivered to each CI electrode. The CI electrode with the highest significant firing response was defined as the best electrode. Rate-level functions were made using the best electrode and estimated best repetition rate in 10–20 μA steps. Once basic CI response properties were determined, units were further tested using 500 or 1000 ms duration pulse trains (≥1000 ms interstimulus interval) delivered to the best electrode. Current levels were typically set at the best current level for nonmonotonic units and ∼10–20 μA above the inflection point of the rate-level function (where rate response plateaus) in monotonic units. If the rate-level function did not plateau, the current level was typically set ∼10 μA below the maximum level tested in the rate-level function. If time permitted, repetition rate stimuli were delivered at multiple current levels. Both acoustic click trains and CI pulse trains were usually delivered at repetition rates ranging from 4 to 488 Hz in near octave steps. A subset of units was presented with pulse trains as high as 1221 Hz (see Fig. 4c).
Electrical stimulation artifact removal.
Each CI stimulus pulse produced a large electrical artifact in the neural recording signal ∼400 μs in duration, creating a potential for data loss if spikes and artifacts occurred concurrently. At low stimulus rates, the data loss was minimal due to few numbers of stimulus pulses and the time delay between peripheral stimulation and cortical response. However, the possible number of spikes occluded by artifact increased with stimulation rate (Fig. 2a). Because the CI stimuli used in this study were periodic pulse trains, spectral profiles of artifact corrupted signals had large magnitude peaks at integer multiples of the stimulus repetition rate (Fig. 2b). To remove the frequency components corresponding to the stimulus artifact, a comb filter was defined with spectral notches also at integer multiples of a given frequency (Fig. 2c). The comb filter was created in MATLAB using the iircomb function and only used for pulse rates (PRs) ≥128 Hz. The filter order must be an integer, defined as the data-sampling rate divided by the stimulus repetition rate. The Tucker Davis Technologies A/D digitized at a sampling rate of 24414.0625 Hz and our CI stimulus delivery system had a sampling rate of 2.5 MHz. Therefore, PRs had to be chosen carefully such that artifact waveforms were always sampled at the same time points in the artifact waveform.

CI stimulus artifact removal. Electrical artifacts caused by CI stimulation were removed from neural recordings using a notch filter. a, Electrical artifacts were typically an order of magnitude larger than spiking activity. Raw neural signal was recorded during a 500 ms duration; 488 Hz stimulus is shown. Without artifact removal, such high stimulation rates prevent reliable sorting during the stimulus period. b, Frequency spectrum of the raw signal shown in a. Spectral peaks occur at integer multiples of the stimulus repetition rate. c, A notch filter was created with spectral nulls at integer multiples of the stimulus repetition rate. d, The raw signal was digitally filtered with the notch filter, allowing spikes to be recovered. e, Spikes were sorted offline using a custom template-based sorting MATLAB program. Spikes obtained after filtering were reduced in amplitude (black), but maintained similar shape as unfiltered spikes (gray). f, SNR of isolated units was large enough to very reliably sort units after notch filtering (median = 28.1 dB). g, Neural responses to CI stimulus delivered at 4–488 Hz. Only responses to stimuli ≥128 Hz were notch filtered. For visualization, stimulus artifact in unfiltered signals is highlighted red.
For comb filtering to work effectively, every artifact waveform in the stimulus pulse train had to be nearly identical. It was determined that 4882.8125 Hz was the highest frequency that could be divided evenly into both sampling rates (24414.0625/4882.8125 = 5; 2500000/4882.8125 = 512). To obtain comb filters with integer orders, stimulus PRs therefore had to be limited to those that satisfied the following formula: PR = 4882.8125/n, where n is an integer ≥ 1. In the example shown in Figure 2, the PR was actually 488.28125 Hz (not exactly 488 Hz). In figures and text, all PRs are rounded to the nearest integer for simplicity. For example, in Figure 2g, the stimulus PRs were actually 4.0023, 8.0046, 16.0092, 32.1238, 64.2475, 128.4951, 256.9901, and 488.2812 Hz.
Comb filtering was done on data files containing CI stimulus rates ≥128 Hz. Filtering was very effective in removing artifact and allowing spikes to be recovered (Fig. 2d). However, a portion of data from one animal, M57U, was recorded before the implementation of comb filtering. In that case, stimuli were delivered at integer repetition rates (i.e., 4, 8, 16, 32, 64, and 128 Hz) and data analysis was limited to responses for stimulus rates ≤128 Hz. During recording sessions, signals were comb filtered on a trial-by-trial basis. A threshold trigger was set manually and spike times were displayed so that CI responsiveness could be assessed online during recording. Spikes were subsequently sorted offline using a more rigorous template-based spike-sorting program, as described in the next section.
Offline sorting method.
All units were initially sorted online using the MSD template spike sorter. Units tested with high rate CI stimulation were subsequently resorted offline using a custom MATLAB program. Sorting was done on a file-by-file basis using the following steps: (1) trials with high rate CI stimuli (≥128 Hz) were filtered using the appropriate comb filter; (2) potential spikes were extracted using a manually defined threshold; (3) principal component analysis and K-means clustering was used to separate candidate spikes from noise or other units (if multiple units present in recording); (4) candidate spikes were displayed and seven template “hoops” were defined manually (Fig. 2e); and (5) all trials in the data files were analyzed and spikes falling within the defined template were identified. This offline spike-sorting method was supervised; a spike template was defined manually for every unit and data file. The quality of sorting of each unit was assessed by visualizing all of the extracted spike waveforms. Spikes and residual artifacts usually had very different waveform shapes. However, if any artifacts were improperly assigned as spikes, it was observable in spike waveform plots. In such instances, the spike-sorting program was run again with a newly defined template. Only single units that could be very well isolated from background activity were recorded and analyzed. The median signal-to-noise ratio [(20 * log10(Vpeak-to-peak/σnoise)] of analyzed CI responsive units was calculated to be 27.6 dB (n = 187; Fig. 2f).
Data analysis.
Data were analyzed using custom software written in MATLAB. Stimulus-driven firing rate was calculated over the entire stimulus duration. Spontaneous firing rate was measured in a window before stimulus onset (typically 500 ms). Mean spontaneous rate was calculated from all stimulus trials and subtracted from mean driven rate for all analyses unless otherwise noted.
Units were classified as stimulus synchronized or nonsynchronized using response measures similar to those used by Lu et al. (2001b): the Rayleigh statistic at 8 Hz and a discharge rate ratio of two repetition rates. The discharge rate ratio was defined as the maximum firing rate occurring at repetition rates ≥128 Hz divided by the maximum firing rate occurring at repetition rates ≤32 Hz. Nonsynchronized units had stronger response to high repetition rates and discharge rate ratios greater than one, but nonsignificant VS at 8 Hz. Synchronized units had significant VS at 8 Hz, but tended to have weaker response to high repetition rates and therefore had discharge rate ratios <1. Units in neither category, with significant synchronized responses to 8 Hz but discharge rate ratios >1, were defined as mixed response units. Units not falling in those three categories had unclear repetition-rate-dependent responses and were not analyzed further.
For neurons in the synchronized population, a synchronization boundary was calculated from the Rayleigh statistic versus repetition rate curve (Lu et al., 2001b). First, an estimate of the synchronization boundary was taken to be the highest repetition rate with significant synchronized response. Second, a logarithmic interpolation between the estimated boundary repetition rate and the next higher repetition rate was used to obtain the synchronization boundary; that is, the repetition rate where the Rayleigh threshold was crossed.
The best repetition rate was defined as the repetition rate stimulus that evoked maximum significant firing. For neurons in the nonsynchronized population, an estimate of the rate–response boundary was obtained using the firing rate versus repetition rate curve (Lu et al., 2001b). This analysis was limited the best repetition rate and below. The highest repetition rate that was either not significantly driven or not significantly different from the next higher repetition rate stimulus (p < 0.05, WSR test) was taken as an estimate of the rate–response boundary. The rate–response boundary was calculated to be the where a linear curve fit, based on the firing rates from the best repetition rate to the estimated boundary, crossed the level of firing rate corresponding to the estimated boundary. Repetition rates were converted to octaves before linear curve fitting.
Results
This report is based on 326 well isolated single-units in A1 of the left and right hemispheres of four marmoset monkeys implanted with a CI electrode in the right ear, with the left ear remaining acoustically intact (see Materials and Methods). This preparation allowed us to compare directly each neuron's responses to a wide range of temporally modulated acoustic and CI stimuli. Each neuron was tested for both acoustic and CI responsiveness with a range of repetition or stimulation rates and sound or current levels (see Materials and Methods). Note that a neuron could be responsive to both acoustic and CI stimulation or only one modality (Johnson et al., 2016). After finding a CI stimulus that evoked firing in the neuron, an electrode-tuning function (Figs. 3a, 4a) was measured to determine the most effective CI channel, which was used in further testing. The same neuron was also tested with acoustic stimuli including pure tones, rectangular, or Gaussian-shaped click trains with the carrier frequency centered at the neuron's BF.

CI stimulus synchronized responses. Synchronized responses to CI pulse trains. a–e, Response and analysis of an example synchronized unit. a, Electrode tuning function shows responses to a single CI pulse delivered to each of the seven CI electrode pairs. b, Response to increasing current levels. Monotonic response to current level was typical. c, Response to repetition rate stimuli. Each CI stimulus evoked one to two spikes for low repetition rate stimuli <32 Hz, but evoked primarily onset responses to high repetition rate stimuli. d, Firing rate response profile shows maximum response to 12 and 16 Hz stimuli. e, Temporal response profile based on vector strength. Nonsignificant vector strength values (Rayleigh statistic <13.8, p > 0.001) were set to zero. The synchronization boundary was calculated to be 79.1 Hz, beyond which there was no significant phase locking. f, g, Additional examples of units with synchronized responses. In the right subplots, arrows indicate synchronization boundaries.

CI stimulus nonsynchronized responses. Nonsynchronized responses to CI pulse trains are shown. a–e, Response and analysis of a nonsynchronized unit. a, Electrode tuning function shows responses to a 257 Hz CI stimulus train delivered to each of six CI electrode pairs (electrode pair 3–2 was not used in this animal due to large impedance of contact 2). Electrode 6–5 was used for subsequent testing. b, Response to increasing current levels. Monotonic response to current level was typical. c, Response to repetition rate stimuli. High repetition rate stimuli >45 Hz evoked strong firing response that was sustained throughout the stimulus duration. d, Firing rate response profile shows maximum response to 257 Hz stimuli. The rate–response boundary was calculated to be 45.2 Hz. e, Temporal response profile based on vector strength. Nonsignificant vector strength values (Rayleigh statistic <13.8, p > 0.001) were set to zero. The only stimulus with significant phase locking was 64 Hz. f, g, Additional examples of units with nonsynchronized responses. In the right subplots, arrows indicate rate–response boundaries.
Synchronized responses to CI stimulation in A1
Previous studies of the responses of A1 neurons to CI stimulation under anesthesia observed primarily stimulus-synchronized firing (Schreiner and Raggio, 1996, Middlebrooks, 2008). We also observed in some neurons stimulus-synchronized firing to CI stimulation at slow repetition rates in A1 of awake marmosets, as shown by representative examples in Figure 3. When stimulated through an appropriate CI channel, the example unit shown in Figure 3, a–e, responded to a single CI pulse with one or a few temporally precise spikes (Fig. 3a). For each unit, we measured current level versus firing rate (“rate-level”) function to determine the threshold and range of current levels that evoked firing. This unit showed a typical monotonic rate-level function for CI stimulation, with firing rate increasing with increasing current level and plateauing at high current levels (Fig. 3b). We tested systematically each unit's ability to represent CI pulse trains delivered at a wide range of repetition rates, 4–257 Hz in this example (Fig. 3c). At low repetition rates, each pulse in the pulse train stimuli evoked one or a few temporally precise spikes, up to a repetition rate of ∼23 Hz (Fig. 3c). Pulse trains delivered faster than 23 Hz evoked consistent responses only at the onset (first pulse) of the stimuli. The overall firing rate of this unit increased as the repetition rate increased, reached a peak between 12 and 23 Hz, and declined at higher repetition rates (Fig. 3d). Figure 3e shows significant VS values at different repetition rates for the example unit shown in Figure 3, a–e. Nonsignificant VS values were set to zero. This unit showed relatively high firing rate and significant VS at repetition rates between 4 and 32 Hz (Fig. 3d,e).
Two other examples of units with synchronized firing to CI stimulation are shown in Figure 3, f and g, respectively, and illustrate the heterogeneity of responses within the population of synchronized neurons. For example, the unit in Figure 3f discharged action potentials with longer latency and less temporal precision than the unit in Figure 3c. CI stimulation at high repetition rates (128–257 Hz) produced sustained suppression and an offset response in this unit. The unit in Figure 3g had a high spontaneous firing rate and followed low repetition rate CI stimuli up to ∼45 Hz, but had both onset and offset responses at higher repetition rates. We will further discuss the population data below.
Nonsynchronized responses to CI stimulation in A1
A population of synchronized units such as those shown in Figure 3 could represent slow modulation rates with synchronized responses, but not fast modulations at rates higher than ∼50 Hz. In contrast to previous CI physiology studies in anesthetized animals, we found that a substantial proportion of A1 neurons in awake marmosets showed sustained, nonsynchronized firing to rapid CI pulse trains. An example of one such unit is shown in Figure 4, a–e. Figure 4b shows its rate-level function. As shown in Figure 4c, this unit did not respond or only responded weakly to CI stimuli at slow repetition rates (≤45 Hz). At higher repetition rates, sustained firing continued throughout the entire 1 s duration of the stimuli (Fig. 4c). The firing pattern of this unit is markedly different from that of the synchronized unit shown in Figure 3c. The firing rate of this unit increased with increased repetition rate >45 Hz (Fig. 4d). This unit showed significant synchronized response at only one repetition rate (64 Hz) (Fig. 4e). The responses to CI stimuli of two other similar units are shown in Figure 4, f and g, respectively. Like the unit shown in Figure 4, a–e, these two units showed weak or no responses at slow repetition rates (<∼100 Hz), but sustained, nonsynchronized firing at higher repetition rates. These example units also illustrate an interesting and consistent observation: that the firing rate–response profile plateaus ∼200–300 Hz (Fig. 4d). In the neurons that we have examined, CI stimulation at higher repetition rates often did not produce further increase in firing rate. This result may have important implications for CI users, who often have limits of temporal rate–pitch at ∼300 Hz (McKay et al., 1994; Zeng, 2002; Baumann and Nobbe, 2004). Population data are discussed below.
Similar response patterns to temporally modulated acoustic or CI stimuli by individual A1 neurons
Because each animal was implanted unilaterally with CI electrodes, we were able to record responses of single neurons in both hemispheres to either CI or acoustic stimulation delivered to the CI-implanted ear (right ear) or the intact ear (left ear) (see illustration on the left side of Fig. 5). This enabled us to compare and contrast directly the temporal and rate representations of temporally modulated acoustic and CI stimuli on a neuron-by-neuron basis in auditory cortex of the same animal. Lu et al. (2001b) showed in normal hearing marmosets that A1 neurons can be largely segregated into synchronized and nonsynchronized populations using two response measures. We applied the same measures on the neurons from this study. In Figure 5, a and b, the Rayleigh statistic computed from responses at 8 Hz repetition rates was plotted against the discharge rate ratio, defined as the maximum firing rate to high repetition rates (≥128 Hz) divided by the maximum firing rate to low repetition rates (≤32 Hz) (see Materials and Methods), for units responsive to CI or acoustic repetition rate stimuli, respectively.

Classification based on synchronization and firing rate–response to CI and acoustic stimuli. a, Population responses to CI pulse trains. The horizontal dashed line at 13.8 indicates the significance level of the Rayleigh test (p < 0.001). The vertical dashed line indicates a discharge rate ratio of 1.0 (see Materials and Methods). Open circles indicate units classified as synchronized (n = 59). Crosses indicate units classified in the nonsynchronized population (n = 113). Crosses falling above the Rayleigh significance level were still classified as nonsynchronized because the firing rate response to the 8 Hz stimulus was not significantly different from spontaneous firing rate. Points indicate neurons with mixed responses (n = 15). Units recorded from the left auditory cortex (AC) are black, units from right AC are green. b, Population responses to acoustic click trains. Open circles indicate units classified as synchronized (n = 79). Crosses indicate units classified in the nonsynchronized population (n = 131). Points indicate neurons with mixed responses (n = 27).
Units were classified as “synchronized” if they had a Rayleigh value ≥13.8 (p < 0.001) and a discharge rate ratio ≤1, reflecting synchronized responses at low repetition rates and poor response at high repetition rates. Of 187 units responsive to CI pulse trains, approximately one-third fell into this category (31.6%, 59/187; Fig. 5a). Units were classified as “nonsynchronized” if they had a Rayleigh value <13.8 and a discharge rate ratio >1, reflecting poor synchronized firing at low repetition rates and stronger response at high repetition rates. Approximately 60.4% (113/187) of the units fell into this category (Fig. 5a); ∼8.0% (15/187) of the units had Rayleigh values ≥13.8 and discharge rate ratios >1 and were classified as “mixed responses.” The same analysis was also applied to the units responsive to acoustic repetition rate stimuli (Fig. 5b). Acoustic stimuli were Gaussian click trains with carrier frequencies set to the unit's BF and delivered across the same repetition rates as the CI stimuli. We found that the distributions of response types for acoustic stimuli (Fig. 5b) were similar to those of CI stimuli (Fig. 5a). Of 237 units responsive to acoustic click trains, 33.3% (79/237) were classified as synchronized, 55.3% (131/237) as nonsynchronized, and 11.4% (27/237) as mixed responses (Fig. 5b). Comparing the two groups of animals (deafened and nondeafened), we found no significant difference in the percentage of units classified as synchronized (χ2 test, nondeafened: 33.6%, n = 37/110; deafened: 28.6%, n = 22/77; χ2 = 0.54, p = 0.46) or nonsynchronized (χ2 test, nondeafened: 59.1%, n = 65/110; deafened: 62.3%, n = 48/77; χ2 = 0.20, p = 0.66). For responses to acoustic click trains, there was no significant difference between the two groups in the percentage of units classified as synchronized (χ2 test, nondeafened: 32.1%, n = 42/131; deafened: 35.0%, n = 37/106; χ2 = 0.21, p = 0.64) or nonsynchronized (χ2 test, nondeafened: 55.7%, n = 73/131; deafened: 54.7%, n = 58/106; χ2 = 0.02, p = 0.88). Units from deafened and nondeafened animals were therefore grouped for subsequent analyses.
A subset of units analyzed in Figure 5, a and b, were responsive to both CI and acoustic repetition rate stimuli and their responses to the two stimulus modalities often fell into the same response category. The example unit in Figure 6a responded to both CI and acoustic stimulation with synchronized responses, whereas the example unit in Figure 6c responded to both CI and acoustic stimulation with nonsynchronized responses. Overall, >60% of units with synchronized responses to CI pulse trains also showed synchronized responses to acoustic click trains (Fig. 6b). The majority (81%) of units with nonsynchronized responses to CI pulse trains also showed nonsynchronized responses to acoustic click trains (Fig. 6d). It was rare to have neurons with nonsynchronized CI responses to be classified as synchronized acoustic responses (<5%; Fig. 6d). Approximately 10% of neurons with synchronized CI responses showed nonsynchronized acoustic responses (Fig. 6b). We did find, however, that certain detailed features of a unit's response to CI and acoustic stimuli differed. For example, the unit in Figure 6a showed offset responses at high repetition rates (128–488 Hz) for acoustic but not for CI stimuli. This unit showed similar synchronized responses at low repetition rates (<32 Hz) for both acoustic and CI stimuli.

Units responsive to CI and acoustic stimuli are typically classified the same. a, Example of unit with synchronized responses to both CI and acoustic stimuli. b, Of 34 units with synchronized CI response also tested with acoustic stimuli, the majority (n = 22) also had synchronized response to acoustic click train stimuli. c, Example of unit with nonsynchronized response to both CI and acoustic stimuli. d, Of 62 units with nonsynchronized CI response also tested with acoustic stimuli, the majority (n = 50) also had nonsynchronized response to acoustic click train stimuli.
These observations clearly indicate that intracochlear electric stimulation delivered through a CI device does not produce exclusively stimulus-synchronized responses at the level of A1, as was previously thought. In a substantial population of A1 neurons, CI stimulation produces nonsynchronized sustained firing, which is qualitatively similar to the responses to acoustic click trains recorded from these animals. These results, that neurons show similar response types to CI and acoustic stimulation, suggest that there are properties intrinsic to A1 neurons and their associated cortical and/or subcortical (e.g., inferior colliculus) connections that produce such response types, rather than the stimulus modality per se.
Temporal and firing-rate representations of acoustic and CI repetitive stimuli by two distinct populations of A1 neurons
To further quantify response properties across synchronized and nonsynchronized populations of A1 neurons tested with acoustic and CI stimuli, we calculated synchronization and rate–response boundaries, respectively (see Materials and Methods). The synchronization boundary is the repetition rate beyond which there is no consistent synchronized response. The synchronization boundary of synchronized units to CI stimuli ranged from 8 to 128 Hz (Fig. 7a, left plot), with a median value of 41.2 Hz (25–75%, 17.8–78.6 Hz, n = 59 units). The synchronization boundary of synchronized units to acoustic stimuli ranged from 8 to 225 Hz (Fig. 7a, right plot), with a median value of 28.6 Hz (25–75%, 14.3–68.9 Hz, n = 79 units). There was no significant difference in the medians of synchronization boundaries of acoustically responsive and CI-responsive units (p = 0.253, WSR test). For the subset of units from which both synchronized CI and acoustic responses were obtained, there was a weak but nonsignificant correlation between the synchronization boundaries of the two stimulus modalities (n = 22, r = 0.369, p = 0.091, Pearson; Fig. 7b).

Distribution of response boundaries, CI and acoustic. a, Synchronization boundaries of synchronized populations (CI, left, red; acoustic, right, blue). There was no significant difference between the distributions of synchronization boundaries (p = 0.253, WRS test, median CI = 41.2 Hz, median acoustic = 28.6 Hz). b, Scatterplot of synchronization boundaries in units with synchronized CI and acoustic responses (n = 22, r = 0.369, p = 0.091, Pearson) c, Rate–response boundaries of nonsynchronized populations. There was no significant difference between the distributions of rate–response boundaries (p = 0.356, WRS test, median CI = 64.2 Hz, median acoustic = 64.0 Hz). d, Scatterplot of rate–response boundaries in units with nonsynchronized CI and acoustic responses (n = 50, r = 0.613, p = 2.2e-6, Pearson) e, Combination of temporal and rate representations of the range of tested repetition rates. Each curve is the cumulative sum of the histograms representing the synchronized and nonsynchronized populations in a, or c, respectively. Dashed lines show the percentage of units with synchronization boundaries greater than or equal to a given repetition rates. Solid line shows the percentage of units with rate–response boundaries less than or equal to a given repetition rate.
The rate–response boundary is the calculated stimulus repetition rate at which the unit begins to show increase in firing rate with increasing stimulus repetition rate (see Materials and Methods). The median rate–response boundary of nonsynchronized units to CI stimuli was 64.2 Hz (25–75%, 33.3–128.5 Hz; Fig. 7c, left plot). The median rate–response boundary of nonsynchronized units to acoustic stimuli was 64.0 Hz (25–75%, 32.4–144.1 Hz; Fig. 7c, right plot). There was no significant difference in the medians of rate–response boundaries of acoustically responsive and CI-responsive units (p = 0.356, WSR test). However, for the subset of units from which both nonsynchronized CI and acoustic responses were obtained, rate–response boundaries were significantly correlated (n = 50, r = 0.613, p = 2.2e-6, Pearson; Fig. 7d).
Figure 7e shows the cumulative distributions of the synchronization boundary and rate–response boundary for synchronized and nonsynchronized neural populations, respectively. All units tested with each stimulus modality were included in this analysis. This figure illustrates two important aspects of these results. First, it shows that a wide range of temporal modulations relevant to speech perception and temporal pitch can be represented by a combination of temporal representations (synchronized) and firing-rate-based representations (nonsynchronized). Second, the distributions of the response boundaries resulted from CI and acoustic stimulation are similar for each category of responses.
Effect of current level on response boundaries
Because responses of A1 neurons depend on the current level, in a subset of units, we compared the responses to CI stimuli at different current levels. Generally, changing the current level of the CI stimulus pulse train did not cause nonsynchronized units to change to synchronized responses. Of these 32 nonsynchronized units tested at two or more current levels, 30 were still classified as nonsynchronized, one was classified as synchronized, and one was classified as mixed. Of the 10 synchronized units tested at two or more current levels, seven were still classified as synchronized, one was classified as nonsynchronized, and two were classified as mixed.
Figure 8a shows responses of a nonsynchronized unit at 80 and 110 μA. Although the maximum firing rate was higher at 110 μA than at 80 μA, rate–response profiles as a function of repetition rate had similar thresholds and shapes at both current levels. Figure 8b shows rate–response boundaries of 30 nonsynchronized units tested at two or more current level. Most nonsynchronized units tested at multiple current levels maintained similar rate–response boundaries (Fig. 8b). Figure 8c shows similar temporal response profiles of a synchronized unit tested at 60 and 120 μA. Synchronization boundaries of a small group of synchronized units tested at two current levels are shown in Figure 8d. The synchronization boundaries were generally similar at multiple current levels.

Effect of current level on response boundaries. Effect of current level on response boundaries of nonsynchronized (left) and synchronized units (right). a, Example of nonsynchronized unit tested at two current levels. Lower current evoked lower firing rates, but the rate–response profile was similarly shaped. b, Rate–response boundaries of units with nonsynchronized responses. Top, Black circles indicate mean rate–response boundaries for each unit over the current levels tested. Units are ordered by their mean rate–response boundaries. Vertical lines indicate the range of minimum and maximum rate–response boundaries measured in each unit. Bottom, Vertical lines indicate ranges of current levels tested for each unit shown in the top. At least two current levels were tested in each unit. c, Example of synchronized unit tested at two current levels. Lower current evoked lower vector strength, but temporal response profile was similar shape. d, Synchronization boundaries of units with synchronized responses. Format is same as in b.
Synchronization strength and rate–response profiles
Given the strong synchronous auditory nerve fiber activation caused by intracochlear electric stimulation (Hartmann et al., 1984), it might be expected that A1 neurons show stronger synchronization to CI stimuli compared with acoustic stimuli. However, we did not find significant differences in synchronization boundaries in synchronized neurons when comparing their responses with the two stimulus modalities. Figure 9a compares mean vector strengths of the units that showed synchronized responses to acoustic or CI stimulation. There are no significant differences in vector strength at and >16 Hz (Fig. 9a). At 8 Hz, the vector strength is slightly stronger for acoustic stimuli compared with CI stimuli (t test, p < 0.05).

Population averages: synchronization and rate–response profiles. a, Vector strength of the CI and acoustic synchronized populations of units (mean ± SEM). Only units tested at repetition rates 4–488 Hz were included in analysis. Vector strength at 8 Hz was slightly stronger for acoustic compared with CI stimuli (t test, p < 0.05). b, Mean firing rate of the CI and acoustic nonsynchronized populations of units. Firing rates were similar at all repetition rates except the highest repetition rate analyzed, 488 Hz (t test, p < 0.05).
We further compared mean firing rates in nonsynchronized units between acoustic and CI stimulation (Fig. 9b). Only units tested at all repetition rates (4–488 Hz) were included in this analysis. For acoustic stimuli, the mean firing rate rises monotonically with increasing stimulus repetition rate. Acoustic stimuli evoked significantly stronger responses than CI stimuli at the highest repetition rate tested (488 Hz, t test, p < 0.05). However, the mean firing rate of the response to CI stimuli plateaus at ∼257 Hz (Fig. 9b). If the mean firing rate of CI responses were used to discriminate repetition rate changes, it would only be useful at repetition rates <257 Hz when CI responses increase nearly linearly with increasing repetition rate. This correlates well with the perceptual limit found in many CI users, who have been shown to be unable to discriminate stimulus repetition rates of >300 Hz (McKay et al., 1994; Zeng, 2002; Baumann and Nobbe, 2004).
Dependence of response types on unit's BF and recording depth
To further understand differences in the functional characteristics of neurons with synchronized and nonsynchronized CI responses, we compared the BF distributions between these two populations (Fig. 10a). Although synchronized population has a significantly lower median BF (5.7 kHz) than nonsynchronized population (9.2 kHz) (p = 0.0153, WRS test; Fig. 10a), the 2 populations have a large overlap in BF between 4 and 32 kHz. The synchronized population contains more neurons with BF between 1 and 4 kHz than the nonsynchronized population. We also analyzed the relationship between the synchronization boundary and BF for the synchronized units and found no correlation for either CI stimuli (n = 46, r = 0.17, p = 0.26, Pearson; Fig. 10b) or acoustic stimuli (n = 76, r = −0.09, p = 0.42, Pearson; Fig. 10b).

Response type based on BF and recording depth. a, Distributions of acoustic BF of CI synchronized and nonsynchronized populations. Bars represent the percentage of units in each category with BFs between the frequencies indicated on the x-axis label (i.e., between 0.5 and 1 kHz, between 1 and 2 kHz, etc.) There was a significant difference between the BFs of the two populations (p = 0.0153, WRS test, median synchronized BF = 5.7 kHz, median nonsynchronized BF = 9.2 kHz). b, Scatterplot of synchronized population BF versus synchronization boundary of CI and acoustic synchronized populations. There was no significant correlation between synchronization boundary and BF in either population (CI: p = 0.26, acoustic: p = 0.42, Pearson). c, Distributions of the recording depth of CI synchronized and nonsynchronized populations. There was no difference between the median recording depths (p = 0.326, WRS test). d, Scatterplot of maximum vector strength versus recording depth for CI and acoustic synchronized populations. There was no significant correlation in either population (CI: p = 0.87, acoustic: p = 0.46, Pearson).
Finally, we compared the distributions of recording depths between synchronized and nonsynchronized CI-responsive units (Fig. 10c). Because the exact laminar position of recorded units could not be determined in these extracellular mapping experiments, depth measurements relative to the first spike activity encountered in an electrode penetration are used in this analysis. In our chronic recording experiments, the electrode was advanced slowly perpendicular to the flat cortical surface of the marmoset temporal lobe while searching for single units (Lu et al., 2001a). It was reasonably assumed that the first spike occurred in uppermost cortical layer. The median depths of synchronized and nonsynchronized CI-responsive units are 600 and 520 μm, respectively, and not significantly different (p = 0.326, WRS test; Fig. 10c). An earlier study of A1 neurons in awake normal hearing marmosets reported no significant difference in the laminar distributions of synchronized and nonsynchronized populations (Lu et al., 2001b). These results indicate that both synchronized and nonsynchronized CI-responsive units were present across the range of cortical depths recorded that included superficial and part of middle layers. In addition, we found no correlation between the maximum vector strength and the recording depth for synchronized CI-responsive or synchronized acoustic populations (CI: n = 59, r = 0.02, p = 0.86, acoustic: n = 79, r = −0.08, p = 0.46, Pearson; Fig. 10d).
Hearing status throughout recording periods
To assess the hearing status of these animals throughout the recording periods (up to 13 months after CI implantation), we measured unit thresholds over time after CI implantation from the left and right hemispheres of each animal (Fig. 11a). Thresholds were measured based on acoustic tone rate-level functions, defined as the lowest sound level that evoked a significant response above spontaneous firing rate. Note there was a wide range of the unit thresholds including units with very low thresholds. Threshold data are summarized in Figure 11b, in which thresholds of each animal were binned into four time periods: 0–100, 100–200, 200–300, and 300–400 d after CI implantation. These data suggest that the hearing status in these animals was relatively stable throughout the recording period after the CI implantation. Combining thresholds over all recording time, mean (SD) were calculated to be 34.1 (17.1), 29.1 (20.7), 28.6 (17.7), and 27.0 (20.5) dB SPL for animals M57U (n = 465 units), M77W (n = 98 units), M5X (n = 272 units), and M3Y (n = 104 units). A previous study (Bendor and Wang, 2008) reported mean (SD) unit thresholds in A1 of normal hearing marmosets to be 17.9 (17.6) dB SPL (n = 150 units). The SDs are similar between studies, although the mean threshold values are higher in the present study. These differences may be due to the monaural nature of the acoustic input in the CI-implanted animals of the present study. In the Bendor and Wang (2008) study, the acoustic stimuli were delivered in free field from a loudspeaker in front of the animal and therefore binaural.

Unit thresholds over time after CI implantation. a, Unit thresholds over time after CI implantation in the left and right hemispheres (LH, RH) of each animal. Thresholds were based on acoustic tone rate-level functions and reflected the lowest sound level that evoked a significant firing rate response. Individual units recorded in the LH and RH are denoted by closed and open circles, respectively. A moving average filter (length = 20 units) was applied to the LH and RH data and is displayed using solid and dashed lines, respectively. Unit counts (LH, RH) for each animal were as follows: M57U (211, 254), M77W (46, 52), M5X (184, 88), and M3Y (48, 56). b, Mean and SD of the unit thresholds at four time periods, 0–100, 100–200, 200–300, and 300–400 d after CI implantation, are shown for each animal (LH and RH combined). Relatively stable mean threshold values can be seen throughout the recording periods.
Discussion
Comparison with previous studies
Schreiner and Raggio (1996) investigated single and multiunit responses in A1 to contralateral CI stimulation and ipsilateral acoustic click stimulation in anesthetized cats in separately sampled neuron populations. In that study, stimuli were delivered at pulse repetition rates between 2 and 38 Hz and maximum firing rates were found at PRs of 7–8 Hz. It is particularly important to note that that Schreiner and Raggio (1996) reported that all responses to acoustic and electric stimuli were “invariably of a phasic nature.” Their measurement of firing rate was defined as the “stimulus-locked” firing rate in a window 10–30 ms after each stimulus pulse. All firing rate versus repetition rate profiles had low-pass or band-pass shapes, with firing rates falling precipitously >10 Hz and minimal responses at >20 Hz (Schreiner and Raggio, 1996). These results were consistent with earlier studies in normal hearing anesthetized animals, suggesting that the ability of A1 neurons to respond to temporal modulations was limited to <20 Hz (Schreiner and Urbas, 1988; Phillips et al., 1989; Eggermont, 1991; Eggermont, 1992).
In awake marmosets, we also found A1 neurons with phasic responses to acoustic clicks and CI pulse trains (Fig. 3). Units classified as synchronized made up ∼32% and 33% of the sampled neurons responsive to CI and acoustic stimuli, respectively (Fig. 5). For the synchronized units, we found the strongest synchronization at repetition rate of 8 Hz for either CI or acoustic stimuli (Fig. 9), but many units could still be significantly synchronized to stimuli at higher repetition rates, with half of units having synchronization boundaries >40 Hz (Fig. 7a). Therefore, the temporal following ability of A1 neurons to CI stimuli is much higher in awake marmosets than reported in previous studies in anesthetized cats (Schreiner and Raggio, 1996; Beitel et al., 2011; Vollmer and Beitel, 2011). However, the median synchronization boundary of 41 Hz for synchronized CI-responsive units in the present study (Fig. 7a) is comparable to that found by Middlebrooks (2008). In that study, half of multiunits in anesthetized guinea pigs showed significant phase locking to constant amplitude CI pulse trains delivered at 30 Hz and higher (up to 60 Hz). It is not clear why the median synchronization boundary in A1 was higher in guinea pigs (Middlebrooks, 2008) than in cats (Schreiner and Raggio, 1996), both of which were conducted in anesthetized conditions. Altogether, these observations suggest that temporal modulations in CI stimuli below ∼60 Hz can be represented in A1 using a temporal code, in which a population of neurons represents repetition rates by spike timing synchronized to CI stimuli. Previous studies in anesthetized animals found little evidence of nonsynchronized responses to CI stimuli (Schreiner and Raggio, 1996; Middlebrooks, 2008). Based on the evidence from normal hearing animals and the consistency between a neuron's temporal firing patterns evoked by acoustic or CI stimulation (Fig. 6), we suspect that the appearance of nonsynchronized responses in A1 to CI stimuli as observed in the present study may have resulted from the use of an awake preparation. The nonsynchronized responses to repetitive acoustic stimuli at high repetition rates have been observed in A1 of several species under awake conditions, including marmosets (Lu et al., 2001b, Bendor and Wang, 2007, Gao et al., 2016), cats (Dong et al., 2011) and rodents (Chambers et al., 2014, Gao and Wehr, 2015).
Temporal and rate representations of CI and acoustic stimuli
Our results parallel findings from earlier studies in awake normal hearing marmosets showing that A1 neurons use both temporal and firing rate-based representations to encode time-varying acoustic signals (Lu et al., 2001b) and suggest that A1 neurons use both coding schemes to represent time-varying CI stimulation. Although slow temporal modulations relevant for speech perception can be represented by phase locking (synchronized population), more rapid modulations can be represented by firing rate (nonsynchronized population). Characteristics of responses to CI and acoustic stimuli were quite similar in both synchronized and nonsynchronized populations (Fig. 7). The repetition rate at which cumulative distributions of the synchronization boundary and rate–response boundary cross is ∼40 Hz for CI responses (Fig. 7e). This is similar to the 40 Hz crossover point reported by Lu et al. (2001b) in awake normal hearing marmosets, which used Gaussian click train stimuli similar to the acoustic stimuli used in the present study. These findings may be relevant to the well known perceptual phenomenon in which slowly occurring temporal patterns can be distinguished as individual events, but faster periodic stimuli are perceived as a continuous sound (Harbert et al., 1968). It is notable that the crossover points that we identified (∼40 Hz), where A1 encoding transitions from more temporal to firing rate-based representations, are near the lower limit of temporal pitch reported in normal hearing (30 Hz, Krumbholz et al. (2000)) and CI (60 Hz, McDermott and McKay (1997)) subjects. Whether CI-implanted marmosets have similar perceptual thresholds remains to be tested, although recent evidence indicates that marmosets have similar pitch perception properties as humans (Song et al., 2016).
A limitation of the results is that the animals used in this study received only passive CI stimulation during experimental sessions. Beitel et al. (2011) showed that, after training with temporally challenging trains of electric pulses, multiunit responses recorded in A1 of neonatally deafened cats showed higher stimulus synchronization rates than the corresponding rates in cats that received only chronic passive intracochlear electric stimulation. A recent study further showed that, in contrast to observations in the A1, behaviorally relevant intracochlear electric stimulation had no effects on temporal processing in the IC, suggesting A1 as a pivotal site for behaviorally driven neuronal temporal plasticity in the deaf cat (Vollmer et al., 2017). However, because the above-mentioned studies were conducted in anesthetized cats, it was not known how the behavioral training would have affected nonsynchronized firing in A1, which can only be observed in the awake condition (Lu et al., 2001b; Chambers et al., 2014). Further studies are needed to test whether animals receiving chronic, behaviorally relevant CI stimulation would show similar synchronized and nonsynchronized firing patterns in A1 as observed in the present study.
Implications of nonsynchronized population for rate–pitch perception
CI users perceive increases in pitch with increasing stimulus repetition rates up to 300 Hz (McKay et al., 1994; Zeng, 2002; Baumann and Nobbe, 2004) or even higher in some “star subjects” (Kong and Carlyon, 2010). Given the limits of synchronized firing found in this and previous CI physiology studies, it is unlikely that such high repetition rates are represented by phase-locked neural activity in A1. Unlike almost exclusively phasic responses to CI stimulation reported by previous studies, here, we report a population of neurons that show nonsynchronized firing to fast stimulus repetition rates. These neurons generally do not show consistent phase-locked responses, but rather represent stimulus repetition rate implicitly by their firing rate response (Fig. 4). Units classified as nonsynchronized made up ∼60% of the neural population responsive to CI stimuli (Fig. 5a). This is a particularly interesting finding because this nonsynchronized neural population could potentially account for rate–pitch perception in CI users. As the stimulus repetition rate increases, the firing rate of this population increases and plateaus ∼257 Hz (Fig. 9b), which is similar to the limiting rate of temporal pitch seen in psychophysical studies in CI users (McKay et al., 1994; Zeng, 2002; Baumann and Nobbe, 2004). It remains to be seen whether CI-implanted marmosets have similar repetition rate discrimination and limits of temporal pitch as human CI users. However, the firing rate of the nonsynchronized population described in this study is a strong candidate neural code for temporal rate–pitch perception of CI stimulation.
Footnotes
This work was supported by the National Institute on Deafness and Other Communication Disorders–National Institutes of Health (Grant R01DC014503 to X.W., Grant F31DC010321 to L.A.J., and Grant P30 DC005211 to the Center for Hearing and Balance at Johns Hopkins University). We thank J. Estes and N. Sotuyo for help with animal care, P. Loizou and D. Kim (UT Dallas) for providing the cochlear implant stimulator current source, and Z. Smith (Cochlear Limited) for assistance obtaining implant electrodes.
The authors declare no competing financial interests.
- Correspondence should be addressed to: Xiaoqin Wang, Ph.D., Department of Biomedical Engineering, Johns Hopkins University School of Medicine, 720 Rutland Ave., Traylor 410, Baltimore, MD 21025. xiaoqin.wang{at}jhu.edu


