

Article Figures & Data
Figures
- Figure 1.
Developmental strengthening of the VCN-LSO pathway is enhanced in Fmr1 KO mice. Sample input–output curves in WT (A, in black here and throughout) and Fmr1 KO mice (B, in red here and throughout) reveal an impaired development of the VCN-LSO connections in Fmr1 KO mice at the end of the third postnatal week. A, Inset, Schematic of the performed experiment. Summary data show evoked EPSC (eEPSC) amplitudes in response to maximal (C) and minimal (D) stimulation of the ipsilateral, excitatory fibers in the developing LSO. E–I, Confocal images display an enrichment of FMRP over development of the LSO neurons. E, F, Validation of the antibody against FMRP in sections including LSO. Dashed squares indicate where the high-power images were taken. G–I, Somata and proximal processes (white arrows) of LSO neurons are strongly FMRP-immunoreactive between P8 and P21. Blue represents DAPI staining. Magenta represents FMRP staining. Green represents MAP2 staining. Scale bars: E, F, 100 μm; E′, F′, 50 μm; G, H, I, 20 μm. Bar graphs represent mean ± SEM. p < 0.05 was considered statistically significant. *p < 0.05 (two-way ANOVA followed by Bonferroni post tests). **p < 0.01 (two-way ANOVA followed by Bonferroni post tests).
- Figure 2.
Increase in the number of release sites underlies the elevated EPSC amplitudes in Fmr1 KO mice. A1, Averaged eEPSC amplitudes in response to a 100 Hz stimulus (20 repetitions) for WT and Fmr1 KO mice. A2, Steady-state depression of eEPSCs remains unchanged for various stimulation frequencies. B–E, Analysis of the sEPSCs reveals unaffected amplitudes and decay time constants (C, D), yet increased frequency (E) comparing WT and Fmr1 KO mice. This indicates an increase in the number of release sites without a change in the quantal size. Bar graph represents mean ± SEM. **p < 0.01 (two-way ANOVA followed by Bonferroni post tests). ***p < 0.001 (two-way ANOVA followed by Bonferroni post tests).
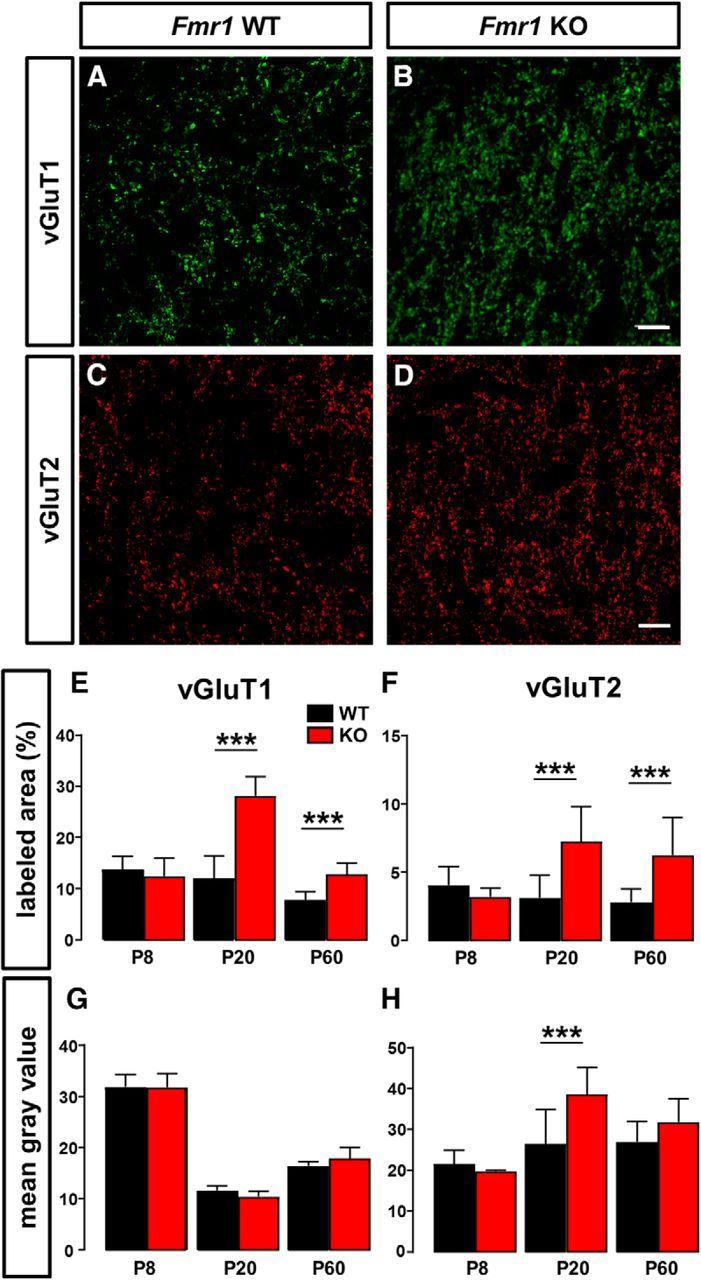
- Figure 3.
Increased vGluT1/2 immunostained area in Fmr1 KO LSO neurons. A–D, Micrographs of WT and Fmr1 KO LSO sections immunostained against vGluT1 (green) and vGluT2 (red) at P20. E–H, Quantification of vGluT1/2 signal intensities (E, F) and immunolabeled area (G, H) of LSO coronal sections on P8, P20, and P60 WT and Fmr1 KO mice. Data are mean ± SEM. Scale bars: 20 μm. ***p < 0.001 (two-way ANOVA followed by Bonferroni post tests).
- Figure 4.
Developmental decrease in GluR1 immunostaining is diminished in Fmr1 KO LSO neurons. A–D, Micrographs of WT and Fmr1 KO immunostained against GluR1 at prehearing and hearing stages. E, Quantification of GluR1 signal intensities from LSO coronal sections on 3 WT and 3 Fmr1 KO mice. Data are mean ± SEM. Unpaired t test, with or without Welch's correction, or Mann–Whitney test was used accordingly to evaluate differences between genotypes and age groups. p < 0.05 was considered statistically significant. *p < 0.05, **p < 0.01, ***p < 0.001. Scale bars: 100 μm; Insets, 20 μm.
- Figure 5.
Inhibitory input properties of the MNTB-LSO pathway remain largely unaffected in the Fmr1 KO mice. Sample input–output curves in WT (A) and Fmr1 KO mice (B) reveal an unchanged synaptic strength of the MNTB-LSO connections in the Fmr1 KO at the end of the third postnatal week. C, Summary data show evoked IPSC (eIPSC) amplitudes in response to minimal and maximal stimulation at P21. D, Maximal input strength of eIPSCs over development did not differ between genotypes. E, Steady-state depression remains unaltered in response to various stimulation frequencies. F, Analysis of spontaneous IPSCs (sIPSC) (F1) reveals unaffected amplitudes (F2) and decay time constants (F3). Only at P14, there was a significant increase in the frequency of sIPSCs (F4). Bar graphs represent mean ± SEM. p < 0.05 was considered statistically significant. **p < 0.01 (two-way ANOVA followed by Bonferroni post tests).
- Figure 6.
Input resistance is slightly enhanced in the hyperpolarizing range in Fmr1 KO mice, whereas other passive membrane properties are unaffected. A, Sample membrane voltage responses to hyperpolarizing and depolarizing current injections from LSO neurons of WT and Fmr1 KO mice at P21. Negative current injections generated a slightly more hyperpolarized membrane potential in the Fmr1 KO mice. B, Current–voltage relationships in the developing LSO neurons reveal no differences between genotypes during the first two postnatal weeks, whereas in P21 Fmr1 KO mice a modest increase in voltage deflection was found. Closed circles represent steady state. Open circles represent peak. C, D, Concomitantly, input resistance in the peak and steady state differed only at P21. E, F, Resting membrane potential and membrane time constant remained largely unaffected. Bar graphs represent mean ± SEM. *p < 0.05 (two-way ANOVA followed by Bonferroni post tests).
- Figure 7.
Loss of FMRP leads to an AP broadening and a decrease in AP latency in LSO neurons. A, Sample traces of APs in LSO neurons of WT and Fmr1 KO mice in response to suprathreshold current injections. Inset, AP shape features measured. B–E, Analysis of the active membrane properties reveals that AP half-width (B) is increased and AP latency decreased (C), whereas AP amplitude (D) and voltage threshold (E) remain unaltered in LSO neurons of Fmr1 mice. Bar graphs represent mean ± SEM. *p < 0.05 (two-way ANOVA followed by Bonferroni post tests). ***p < 0.001 (two-way ANOVA followed by Bonferroni post tests).
- Figure 8.
Increased firing rate and broadened frequency tuning in the LSO of Fmr1 KO mice. A, Schematic of in vivo LSO recording procedure. Exemplary spike shapes provide proof for single-unit recordings. B, HRP-labeled recording site in the LSO with Nissl counterstain. Scale bar, 100 μm. C, Frequency tuning has no effect on spontaneous activity both in WT and in KO. Each circle represents one cell. D, First spike latencies and (E) hearing thresholds were similar in both genotypes. F, Averaged spike response of WT and KO LSO neurons reveals more sustained activity throughout the stimulus presentation in KO mice. G, Mean number of spikes per acoustic stimulation (100 ms). Each circle represents one cell. H, Spike rate dependence on sound pressure level for each individual neuron in WT and KO mice, showing no change in the number of spikes for WT neurons with rising sound pressure level at CF, whereas spike numbers gradually increased for many KO neurons. Response threshold is set to 0 dB for each individual neuron. I, Frequency response areas of two representative LSO neurons, each patch showing the total number of spikes of four repetitions. J, Q values as a measure for frequency tuning sharpness, expressing the bandwidth of the tuning curve 10 and 30 dB above threshold. Smaller Q10 and Q30 values indicate significantly broader tuning in KO animals. Bar graphs represent mean ± SEM. Mann–Whitney test was used to evaluate differences between genotypes. p < 0.05 was considered statistically significant. *p < 0.05, ***p < 0.001.
- Figure 9.
Processing of ILDs is affected by the loss of FMRP. A, Raster dot plots of two exemplary LSO recordings of a WT (left) and KO (right) mouse presenting various ILDs. Each row represents 10 repetitions per ILD combination at neuron's CF (ipsilateral 20 dB above threshold), each dot indicates one spike. Schematic depicts ILD recording procedure. Insets, Corresponding ILD functions, including sigmoidal fit and point of half-maximal inhibition. In the WT neuron (CF = 22.9 kHz), ipsilateral intensity remained at 40 dB SPL (20 dB above threshold). Contralateral intensity ranged from −10 dB SPL to 80 dB SPL. Point of half-maximal inhibition was at ILD = −14 dB. In the KO neuron (CF = 8.6 kHz), ipsilateral intensity remained at 50 dB SPL (20 dB above threshold). Contralateral intensity ranged from 0 to 90 dB SPL. Point of half-maximal inhibition was at ILD = −5 dB. B, ILD of half-maximal inhibition is increased in KO animals. C, An increasing slope steepness of the ILD function in KO mice represents a slower decline due to prevailing excitation. D, Schematic of ILD functions in the LSO of WT and Fmr1 animals. Circles represent point of half-maximal inhibition (point of inflection). Bar graphs represent mean ± SEM. Unpaired t test with Welch's correction or Mann–Whitney test was used accordingly to evaluate differences between genotypes. p < 0.05 was considered statistically significant. **p < 0.001.


Tables
Peak Rin (mΩ) SS Rin (mΩ) RMP (mV) τ (ms) P8 WT (n = 17) 189.4 ± 21.5 101.3 ± 11.1 −57.40 ± 1.0 17.28 ± 1.87 Fmr1 KO (n = 16) 217.1 ± 24.1 92.50 ± 7.33 −61.08 ± 1.1 21.16 ± 2.12 p 0.55 >0.99 0.024 0.014 P14 WT (n = 16) 70.42 ± 7.41 37.41 ± 5.2 −49.82 ± 0.8 3.95 ± 0.51 Fmr1 KO (n = 15) 75.70 ± 14.24 43.20 ± 7.4 −50.54 ± 1.4 3.96 ± 0.90 p >0.99 >0.99 >0.99 >0.99 P21 WT (n = 39) 42.75 ± 1.5 22.04 ± 0.63 −50.31 ± 0.52 2.0 ± 0.14 Fmr1 KO (n = 20) 54.03 ± 5.0 28.54 ± 2.91 −50.06 ± 0.6 1.95 ± 0.22 p >0.99 >0.99 >0.99 >0.99 ↵aInput resistance (Rin) was measured at the peak and the steady state (SS) response to a −100 pA current pulse. RMP, Resting membrane potential. p values: two-way ANOVA followed by Bonferroni post-tests.
- Table 2.
Basic properties of the hyperpolarization-activated current (Ih) in WT and Fmr1 KO LSO neuronsa
Current (nA) at −95 mV Maximum half-activation (mV) P21 WT (n = 10) 2.64 ± 0.13 −71.02 ± 1.09 Fmr1 KO (n = 12) 2.47 ± 0.22 −70.54 ± 1.47 p 0.53 0.79 ↵aVoltage-clamp recordings were obtained in the presence of the following (in mm): 1 3,4-diaminopyridine, 10 TEA-Cl, 0.2 BaCl2, 0.001 TTX, 0.05 NiCl2, 0.1 CdCl2, 0.01 DNQX, 0.025 dl-AP5, and 0.001 strychnine, to block other voltage-gated conductances.
- Table 3.
Active membrane properties in response to the first suprathreshold current pulse in WT and Fmr1 KO LSO neuronsa
AP width (ms) Latency (ms) AP amplitude (pA) Voltage threshold (mV) P8 WT (n = 17) 0.57 ± 0.04 10.09 ± 0.91 76.06 ± 1.6 −28.27 ± 1.1 Fmr1 KO (n = 16) 0.60 ± 0.04 17.24 ± 1.36 80.26 ± 1.9 −30.91 ± 1.0 p >0.99 <0.001 0.67 0.59 P14 WT (n = 16) 0.376 ± 0.034 4.73 ± 0.56 67.04 ± 1.57 −26.49 ± 1.0 Fmr1 KO (n = 15) 0.26 ± 0.01 2.25 ± 0.18 66.50 ± 1.47 −29.43 ± 0.9 p >0.99 0.04 >0.99 0.69 P21 WT (n = 39) 0.21 ± 0.005 3.11 ± 0.18 65.49 ± 1.1 −26.24 ± 0.6 Fmr1 KO (n = 20) 0.24 ± 0.01 2.28 ± 0.1 66.74 ± 0.91 −24.59 ± 1.3 p >0.99 0.72 >0.99 >0.99 ↵ap values: two-way ANOVA followed by Bonferroni post-tests.


