

Abstract
An important aspect of auditory scene analysis is auditory stream segregation—the organization of sound sequences into perceptual streams reflecting different sound sources in the environment. Several models have been proposed to account for stream segregation. According to the “population separation” (PS) model, alternating ABAB tone sequences are perceived as a single stream or as two separate streams when “A” and “B” tones activate the same or distinct frequency-tuned neuronal populations in primary auditory cortex (A1), respectively. A crucial test of the PS model is whether it can account for the observation that A and B tones are generally perceived as a single stream when presented synchronously, rather than in an alternating pattern, even if they are widely separated in frequency. Here, we tested the PS model by recording neural responses to alternating (ALT) and synchronous (SYNC) tone sequences in A1 of male macaques. Consistent with predictions of the PS model, a greater effective tonotopic separation of A and B tone responses was observed under ALT than under SYNC conditions, thus paralleling the perceptual organization of the sequences. While other models of stream segregation, such as temporal coherence, are not excluded by the present findings, we conclude that PS is sufficient to account for the perceptual organization of ALT and SYNC sequences and thus remains a viable model of auditory stream segregation.
SIGNIFICANCE STATEMENT According to the population separation (PS) model of auditory stream segregation, sounds that activate the same or separate neural populations in primary auditory cortex (A1) are perceived as one or two streams, respectively. It is unclear, however, whether the PS model can account for the perception of sounds as a single stream when they are presented synchronously. Here, we tested the PS model by recording neural responses to alternating (ALT) and synchronous (SYNC) tone sequences in macaque A1. A greater effective separation of tonotopic activity patterns was observed under ALT than under SYNC conditions, thus paralleling the perceptual organization of the sequences. Based on these findings, we conclude that PS remains a plausible neurophysiological model of auditory stream segregation.
Introduction
An important aspect of auditory scene analysis is the perceptual organization of sequentially occurring sounds in the environment or auditory stream segregation (Bregman, 1990). Stream segregation can be demonstrated by listening to a sequence of high- and low-frequency tones presented in an alternating (ALT) pattern, ABAB. When the frequency separation (ΔF) between the “A” and “B” tones is small or their presentation rate (PR) is slow, listeners typically perceive a single stream of alternating high and low tones (Fig. 1A). In contrast, when ΔF is large or PR is fast, the sequence perceptually splits into two parallel auditory streams, one composed of A tones and the other of B tones (Fig. 1B).

Schematics of tone sequences used to test neural correlates of auditory stream segregation in the present study and their associated percepts in human listeners (green dashed lines). a–c, Tones A and B are presented either in an alternating pattern, ABAB (a, b), or synchronously (c). Alternating sequences with a small ΔF between tones are typically heard as a single coherent stream (a), whereas when ΔF is large, they are heard as two segregated streams (b). In contrast, synchronous sequences are typically perceived as a single coherent stream even when ΔF is large (c). Effects of PR are not shown.
Whereas perceptual aspects of auditory stream segregation have been studied extensively and are well characterized (for review, see Moore and Gockel, 2012), its neural bases remain unclear. According to the “population separation” (PS) model of stream segregation, originally based on neural responses in primary auditory cortex (A1) of macaques (Fishman et al., 2001), alternating tone sequences are perceived as a single stream or as two separate streams when A and B tones activate the same or distinct neural populations in A1, respectively.
Due to the frequency selectivity of A1 neurons, when ΔF is large, A and B tones activate largely separate neuronal populations in A1, each tuned to the frequency of the A and B tones. This separation is partially manifested as a “dip” in neural activity between the locations tuned to the A and B tones along the tonotopic map (Fig. 2). Tonotopic separation of activity is also enhanced by an increase in PR, an effect explained by the differential strength of forward suppression between best frequency (BF) and non-BF responses. This suppression leads to an effective sharpening of frequency tuning, thereby increasing the functional separation of responses to the A and B tones and promoting a segregated percept (Fishman et al., 2001, 2004).

PS model of stream segregation in A1. Blue and red bell curves schematically represent the magnitude and extent of neural activity elicited by A and B tones, respectively, comprising alternating tone sequences along the tonotopic map. Overlap in activity is represented in purple. Different patterns of activity, and associated percepts, evoked under small, intermediate, and large ΔF values, and slow and fast PR conditions are depicted, as indicated. The PS model predicts a dip in between tonotopic activity patterns elicited by A and B tones under stimulus conditions wherein tone sequences are perceived as two separate streams.
While supported by several subsequent neurophysiological investigations (Kanwal et al., 2003; Bee and Klump, 2004; Micheyl et al., 2005; Gutschalk et al., 2007; Bidet-Caulet and Bertrand, 2009; Middlebrooks and Bremen, 2013; Scholes et al., 2015; Uhlig et al., 2016), the PS model was challenged by a seminal study in ferrets comparing A1 responses to sequences in which A and B tones were presented either synchronously or in alternation (Elhilali et al., 2009). Whereas ALT sequences may be perceived either as one or two streams, depending upon ΔF and PR, synchronous (SYNC) sequences are generally perceived as a single stream, even when the A and B tones are widely separated in frequency (up to an octave or more; Fig. 1C; Elhilali et al., 2009; Micheyl et al., 2013b). Thus, a crucial test of the PS model is whether it can account for the perceptual difference between ALT and SYNC sequences. Accordingly, if the PS model of stream segregation has validity, then a significantly larger dip in neural activity should be observed in the ALT condition than in the SYNC condition. Contrary to predictions of the PS model, no significant difference in the depth of the dip was observed (Elhilali et al., 2009). These findings and further analyses suggested instead a predominant role for “temporal coherence” in stream segregation, whereby A and B tones are perceptually grouped if they activate neural populations in a synchronous or coherent fashion (Elhilali et al., 2009; Shamma et al., 2011), as would occur for SYNC sequences but not for ALT sequences, when ΔF is large or PR is fast.
The present study examined responses to SYNC and ALT sequences in macaque A1 to crucially test the PS model in an Old World primate. We found a greater effective separation of tonotopic activity patterns under ALT than under SYNC conditions, thus paralleling the differential perceptual organization of the sequences and thereby indicating that both PS and temporal coherence may contribute to auditory stream segregation.
Materials and Methods
Neurophysiological data were obtained from three adult male macaque monkeys (Macaca fascicularis) using previously described methods (Steinschneider et al., 1992; Fishman et al., 2001). All experimental procedures were reviewed and approved by the AAALAC-accredited Animal Institute of Albert Einstein College of Medicine and were conducted in accordance with institutional and federal guidelines governing the experimental use of nonhuman primates. Animals were housed in our AAALAC-accredited Animal Institute under daily supervision of laboratory and veterinary staff. Before surgery, monkeys were acclimated to the recording environment and were trained to sit in custom-fitted primate chairs using preferred foods and liquid rewards as reinforcements. To minimize the number of monkeys used, in addition to the experimental protocols described in this report, all three animals were involved in at least two other auditory experiments conducted within the same recording sessions.
Surgical procedure.
Under pentobarbital anesthesia and using aseptic techniques, rectangular holes were drilled bilaterally into the dorsal skull to accommodate epidurally placed matrices composed of 18 gauge stainless steel tubes glued together in parallel. Tubes served to guide electrodes toward auditory cortex for repeated intracortical recordings. Matrices were stereotaxically positioned to target A1 and were oriented to direct electrode penetrations perpendicular to the superior surface of the superior temporal gyrus, thereby satisfying one of the major technical requirements of one-dimensional current source density (CSD) analysis (Müller-Preuss and Mitzdorf, 1984; Steinschneider et al., 1992). Matrices and Plexiglas bars, used for painless head fixation during the recordings, were embedded in a pedestal of dental acrylic secured to the skull with inverted bone screws. Perioperative and postoperative antibiotic and anti-inflammatory medications were always administered. Recordings began after at least 2 weeks of postoperative recovery.
Stimuli.
Stimuli were generated and delivered at a sample rate of 48.8 kHz by a PC-based system using an RX8 module (Tucker-Davis Technologies). Frequency response functions (FRFs) derived from responses to pure tones characterized the spectral tuning of the cortical sites. Pure tones used to generate the FRFs ranged from 0.15 to 18.0 kHz were 200 ms in duration (including 10 ms linear rise/fall ramps), and were randomly presented at 60 dB SPL with a stimulus onset-to-onset interval of 658 ms. The resolution of frequency response functions was 0.25 octaves or finer across the 0.15–18.0 kHz frequency range tested.
All stimuli were presented via a free-field speaker (Microsatellite, Gallo Acoustics) located 60° off the midline in the field contralateral to the recorded hemisphere and 1 m away from the head of the animal (Crist Instruments). Sound intensity was measured with a sound-level meter (type 2236, Brüel & Kjær) positioned at the location of the ear of the animal. The frequency response of the speaker was flat (within ±5 dB SPL) over the frequency range tested.
The PS model of stream segregation was tested by comparing responses to ALT and SYNC tone sequences. Both sequences were comprised of A and B tones, each 75 ms in duration (including 5 ms ramps) and delivered at 60 dB SPL, the same level used to determine the BF (defined below). A and B tones were presented either in a SYNC or an ALT pattern (i.e., ABAB; Fig. 1). Sequences were presented in a continuous fashion, with breaks occurring only in between stimulus/recording blocks. The ΔF between the tones was 1, 6, or 13 semitones. The PR (1/tone onset-to-onset time in seconds) was 5 or 10 Hz. These stimulus conditions were chosen to encompass the stimulus parameter range tested by Elhilali et al. (2009) as well as the main perceptual regions related to auditory stream segregation in humans (Fig. 3A). Behavioral studies suggest similar perceptual regions in macaques (Christison-Lagay and Cohen, 2014). The order of stimulus conditions was pseudorandomly varied across recording blocks. Sequence duration varied according to PR to collect ∼50 artifact-free responses to each tone stimulus comprising the sequences.
Similar to the study by Elhilali et al. (2009), A and B tones were presented in three configurations in relation to the frequency tuning of the recorded neural populations in A1 (Fig. 3B). In position 1 (“side”), the frequency of A tones was equal to the BF of the recorded neural population, while that of B tones was above the BF. In position 2 (“center”), the frequencies of A and B tones flanked the BF. In position 3 (“side”), the frequency of B tones was equal to the BF, while that of A tones was below the BF. Based on responses in these three configurations, we could infer, and thereby compare, the effective distribution of activity in A1 under ALT and SYNC stimulus conditions (as was done by Elhilali et al., 2009).
Whereas Elhilali et al. (2009) tested five stimulus configurations, due to time constraints of recordings in awake monkeys, we were able to test only three, corresponding to the center and extreme sides tested by Elhilali et al. (2009) (namely, their positions 1, 3, and 5). These configurations were chosen because they are the most relevant for inferring the effective tonotopic separability of A and B tone responses.
Neurophysiological data acquisition was initiated 5 s after the onset of each tone sequence to allow potential “build up” of stream segregation to occur (Anstis and Saida, 1985; Bregman, 1990; Micheyl et al., 2005; Moore and Gockel, 2012; Rankin et al., 2015). ALT and SYNC sequences were presented only at sites with BFs that allowed all stimulus components in the tested conditions to fall within the bandpass of the audio speaker used for sound delivery.
Neurophysiological recordings.
Recordings were conducted in an electrically shielded, sound-attenuated chamber. Monkeys were monitored via video camera throughout each recording session. An investigator periodically entered the recording chamber and delivered preferred treats to the animals in between stimulus blocks to promote alertness.
Local field potentials (LFPs) and multiunit activity (MUA) were recorded using linear-array multicontact electrodes comprised of 16 contacts, evenly spaced at 150 μm intervals (U-Probe, Plexon). Individual contacts were maintained at an impedance of ∼200 kΩ. An epidural stainless steel screw placed over the occipital cortex served as the reference electrode. Neural signals were bandpass filtered from 3 Hz to 3 kHz (roll-off, 48 dB/octave), and digitized at 12.2 kHz using an RA16 PA Medusa 16-channel preamplifier connected via fiber-optic cables to an RX5 Data Acquisition System (Tucker-Davis Technologies). LFPs time locked to the onset of the sounds were averaged on-line by computer to yield auditory evoked potentials (AEPs). CSD analyses of the AEPs characterized the laminar distribution of net current sources and sinks within A1 and were used to identify the laminar location of concurrently recorded AEPs and MUA (Steinschneider et al., 1992; Steinschneider et al., 1994). CSD was calculated using a 3 point algorithm that approximates the second spatial derivative of voltage recorded at each recording contact (Freeman and Nicholson, 1975; Nicholson and Freeman, 1975).
Primary MUA data were derived from the spiking activity of neural ensembles recorded within lower lamina 3 (LL3), as identified by the presence of a large-amplitude initial current sink that is balanced by concurrent superficial sources in mid-upper lamina 3 (Steinschneider et al., 1992; Fishman et al., 2001). This current dipole configuration is consistent with the synchronous activation of pyramidal neurons with cell bodies and basal dendrites in lower lamina 3. Previous studies have localized the initial sink to the thalamorecipient zone layers of A1 (Müller-Preuss and Mitzdorf, 1984; Steinschneider et al., 1992). To derive MUA, filtered neural signals (3 Hz to 3 kHz pass band) were subsequently high-pass filtered at 500 Hz (roll-off, 48 dB/octave), full-wave rectified, and then low-pass filtered at 520 Hz (roll-off, 48 dB/octave) before averaging of single-trial responses (for a methodological review, see Supèr and Roelfsema, 2005). While firing rate measures are typically based on threshold crossings of neural spikes, MUA is an analog measure of spiking activity in units of response amplitude (Kayser et al., 2007). For the purposes of the present study, MUA may be considered a more conservative measure than single-unit activity, given the possibility of effects being partially washed out when multiple units are simultaneously recorded. Synchronized MUA from adjacent cells within the sphere of recording with similar spectral tuning promotes reliable transmission of stimulus information to subsequent cortical areas (Eggermont, 1994; deCharms and Merzenich, 1996; Atencio and Schreiner, 2013). Thus, MUA measures are appropriate for examining the neural representation of spectral cues in A1, which may be used by downstream cortical areas for auditory scene analysis.
Positioning of electrodes was guided by on-line examination of click-evoked AEPs and the derived CSD profile. Pure tone stimuli were delivered when the electrode channels bracketed the inversion of early AEP components and when the largest MUA and initial current sink were situated in middle channels. Evoked responses to ∼40 presentations of each pure tone stimulus were averaged with an analysis time of 500 ms that included a 100 ms prestimulus baseline interval. The BF of each cortical site was defined as the pure tone frequency eliciting the maximal MUA within a time window of 0–75 ms after stimulus onset. This response time window includes the transient “On” response elicited by sound onset and the decay to a plateau of sustained activity in A1 (Fishman and Steinschneider, 2009). Following determination of the BF, ALT and SYNC tone sequences were presented.
At the end of the study period, consisting of recordings conducted several days a week, typically over the course of a year, monkeys were deeply anesthetized with sodium pentobarbital and transcardially perfused with 10% buffered formalin. Tissue was sectioned in the coronal plane (80 μm thickness) and stained for Nissl substance to reconstruct the electrode tracks and to identify A1 according to previously published physiological and histological criteria (Merzenich and Brugge, 1973; Morel et al., 1993; Kaas and Hackett, 1998). Based upon these criteria, all electrode penetrations considered in this report were localized to A1.
In addition to responses in lower lamina 3, responses recorded from two more superficial electrode contacts located 150 and 300 μm, respectively, above the lower lamina 3 contact were also analyzed. BFs of MUA recorded at these three laminar depths were within one-quarter octave of each other. Given this concordance in BFs, it is reasonable to conclude that multicontact electrode penetrations into A1 were approximately orthogonal to the cortical layers (as further confirmed by histological analysis).
Analysis and interpretation of responses to ALT and SYNC sequences.
In accordance with the PS model, we tested the general hypothesis that under stimulus conditions where a single stream is perceived, A tones and B tones activate overlapping neural population in A1, while under stimulus conditions where two streams are perceived, A tones and B tones activate discrete populations. This hypothesis leads to the following predictions. In the case of SYNC sequences, overlapping tonotopic activation patterns evoked by A and B tones will be observed, as SYNC sequences are generally perceived as a single stream given the stimulus parameters considered in the present study. In contrast, in the case of ALT sequences, nonoverlapping tonotopic activation patterns evoked by A and B tones will be observed under ΔF and PR conditions where ALT sequences are perceived as two separate streams (generally when ΔF is large and PR is fast; Fig. 2).
Similar to Elhilali et al. (2009), the degree of overlap, or dip, is quantified by the center/side ratio, henceforth referred to as the “dip ratio.” Here, this ratio is defined as the mean peak amplitude of A tone and B tone responses in position 2 (i.e., when the tones flank the BF and the recording site is thus located at the center) divided by the mean peak amplitude of the A tone response in position 1 (i.e., when the A tone is at the BF and the B tone is above the BF) and the B tone response in position 3 (i.e., when the B tone is at the BF and the A tone is below the BF). Note that in the case of SYNC sequences, A tone and B tone responses cannot be separately analyzed, since they occur simultaneously.
Thus, the dip ratio in the ALT condition is (A position 2 + B position 2)/(A position 1 + B position 3), while that in the SYNC condition is (AB position 2)/(AB position 1 + AB position 3)/2.
As responses at both the A tone BF site and the B tone BF site in A1 were not recorded (only responses at a single site in each recording session), the dip ratio is an indirect (inferred) measure of the degree to which A and B tones activate different neural populations in A1 (for further discussion, see Elhilali et al., 2009).
It should be noted that Elhilali et al. (2009) used a somewhat different ratio to measure (effective) tonotopic separation of A and B tone responses. Specifically, their ratio is the normalized difference between the response amplitudes in the center and side positions, while the ratio computed here is the response amplitude in the center position divided by that in the side position (at the BF of the recording site). Both ratios reflect the proportion by which the response amplitude dips when the BF of the recording site is “in between” the frequencies of the A and B tones (center) compared with when the BF of the recording site matches the frequencies of the A and B tones (sides). In the case of Elhilali et al. (2009), the ratio increases with the size of the dip, whereas our ratio decreases. Although the values will be different between the two studies, the basic interpretations of the ratios as measures of tonotopic separation are comparable. Indeed, application of their ratio to our dataset yields results that are qualitatively similar to those reported here.
Before computing the dip ratio, we subtracted the mean activity in the 5 ms baseline interval immediately before the onset of each tone from the peak response amplitude occurring during the presentation of the tone. This baseline correction provides a measure of how much the response to a given tone rises above the ongoing background neural activity elicited by the tone sequences. Nonetheless, dip ratios based on raw amplitudes or relative (baseline-corrected) amplitudes were within 10% of each other, and main findings did not qualitatively depend on whether or not this correction was performed.
Experimental design and statistical analysis.
For statistical analyses, neurophysiological data were pooled across recording sites examined in the three monkeys for each experimental condition (ALT/SYNC, ΔF, and PR; see Results for explanation of the number of sites included per condition). The overall effect of the ALT/SYNC sequence on dip ratios at a given PR was assessed by fitting linear mixed-effects models to take into account the correlation in repeated measures obtained at the same site. Specifically, the models included fixed effects for sequence type (ALT/SYNC) and degree of frequency separation (ΔF), and a random effect for recording site. Interaction terms between sequence type and degree of separation were also evaluated but were not statistically significant (Table 1); therefore, the results from the model that included the main effects only are reported below. For each sequence type, similar models were fit to the data to evaluate the independent effects of PR and ΔF on dip ratios. Paired t tests were also performed to compare dip ratios between ALT and SYNC conditions at specific magnitudes of ΔF. For these individual comparisons, the Bonferroni method was used to adjust p values (padj) for the multiple tests performed (one for each value of ΔF) and padj < 0.05 was considered statistically significant. All analyses were performed using SAS version 9.4 (SAS Institute).
Detailed results of statistical analysis
Results
Results are based on MUA recorded in 18 multicontact electrode penetrations into A1 of three monkeys. Because of time limitations in recording from awake macaques, it was not possible to test all three ΔF conditions at all sites. The numbers of sites included per condition are indicated in Figure 3A. Specifically, in 9 of the 18 sites, ΔF values of 1 semitone and 6 semitones were tested, whereas in the remaining 9 sites, ΔF values of 6 semitones and 13 semitones were tested.

a, Perceptual boundaries of auditory stream segregation. Slow presentation rates and small frequency separations between A tones and B tones comprising alternating tone sequences promote the perception of a single coherent auditory stream, whereas rapid presentation rates and large frequency separations promote the perceptual segregation of tones into two separate auditory streams. Intermediate values of frequency separation and presentation rate often lead to an ambiguous percept (data based on McAdams and Bregman, 1979). Green discs indicate stimulus conditions tested in the present study and numbers by the discs indicate number of electrode penetrations in which a given stimulus condition was tested. b, Schematic representation of the relationship between the frequencies of A tones and B tones under position 1, 2, and 3 stimulus conditions and the FRFs of neural population responses recorded in each electrode penetration into A1. The BF of the site corresponds to the frequency at which the FRF is maximal. The three tone positions include a key subset of the five tone positions tested by Elhilali et al. (2009). Stimulus configurations are designed to yield data from which tonotopic activation patterns in A1 under SYNC and ALT conditions can be inferred.
Four additional sites were excluded from analysis because they did not respond to any of the stimuli presented, were characterized by “off-dominant” responses, had aberrant CSD profiles that precluded adequate assessment of laminar structure, or displayed FRFs that were too broad to accurately determine a BF (a prerequisite for determining the stimulus frequencies to be used in the ALT and SYNC sequences). Sites that showed broad-frequency tuning were situated along the lateral border of A1.
MUA data presented in this report were simultaneously recorded from three electrode contacts located within supragranular laminae. The deepest of the three electrode contacts was positioned within LL3, the layer typically displaying the largest neural responses in A1. LL3 was physiologically identified by a large-amplitude, short-latency current sink and its characteristic spatiotemporal relationship to deeper and more superficial current sources and sinks typical of CSD profiles in A1 (Müller-Preuss and Mitzdorf, 1984; Steinschneider et al., 1992; Metherate and Cruikshank, 1999; Fishman and Steinschneider, 2012). The more superficial recording sites were located 150 and 300 μm above that of the LL3 electrode contact (henceforth designated as SG150 and SG300, respectively).
For all sites examined, LL3 responses occurring within the “on” response time window (0–75 ms post-stimulus onset) displayed sharp frequency tuning characteristic of small neural populations in A1 (Fishman and Steinschneider, 2009). Mean MUA onset latency and mean bandwidth of MUA frequency response functions at half-maximal response were ∼14 ms and ∼0.6 octaves, respectively. These values are comparable to those reported for single neurons in A1 of awake monkeys (Recanzone et al., 2000). BFs of recording sites examined in the present study ranged from 250 to 11,000 Hz.
Comparison of A1 responses to ALT and SYNC tone sequences
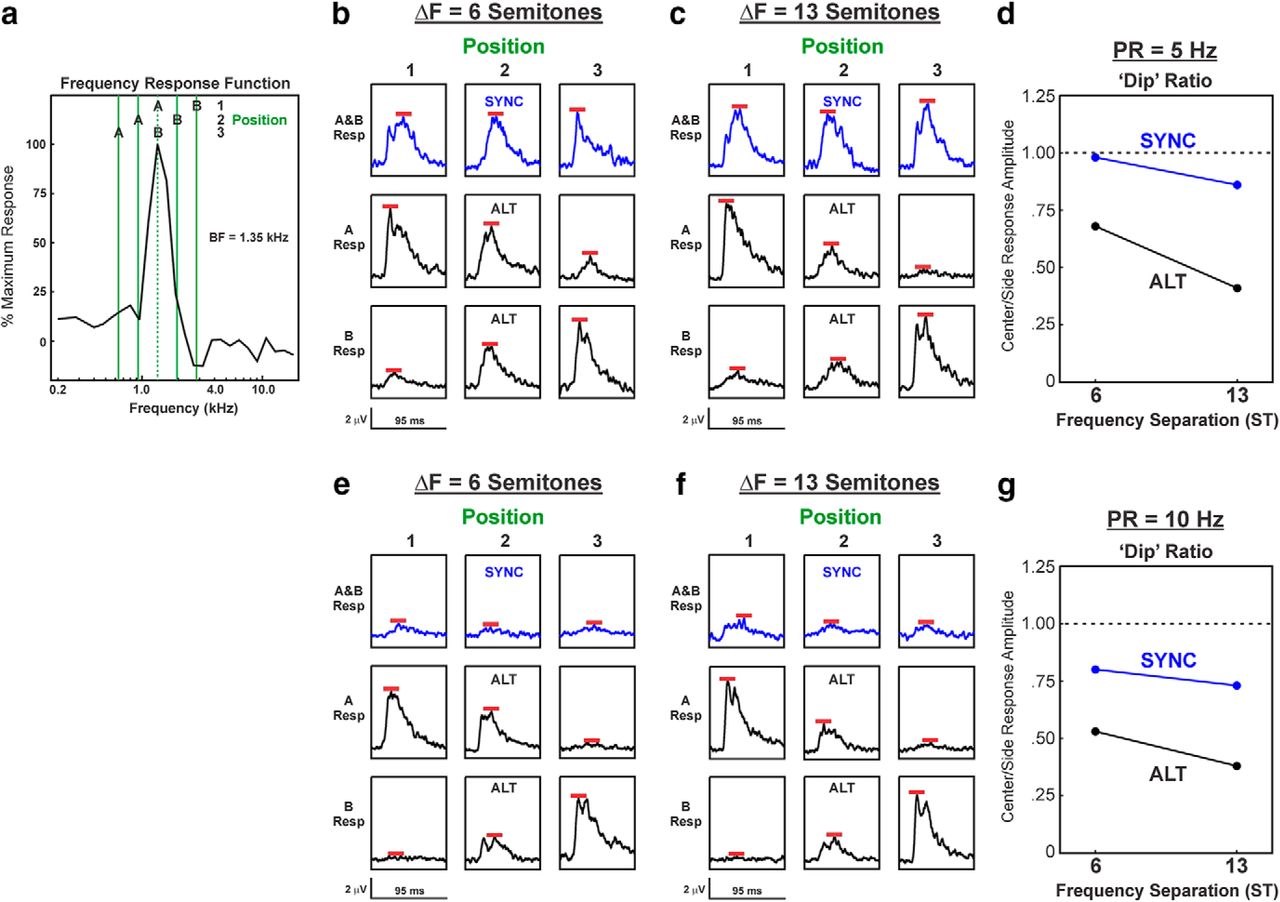
Lower dip ratios were observed for LL3 responses to ALT sequences compared with SYNC sequences, as illustrated by neural data from two example recording sites shown in Figures 4 and 5, wherein ΔF values of 1 and 6 semitones, and 6 and 13 semitones were tested, respectively. Figures 4a and 5a show the relationship between the FRF of the site and the frequencies of the A and B tones when they are presented at positions 1, 2, and 3. Figures 4b–f and 5b–f show responses (not baseline corrected) to the A and B tones under the different ΔF and PR conditions and for SYNC and ALT sequences, as indicated. Peaks of the responses, which are used to calculate the dip ratios, are indicated by the red bars. At both sites, dip ratios tended to decrease with increasing ΔF values and were invariably lower for responses to ALT sequences than for responses to SYNC sequences.

Responses evoked by SYNC and ALT sequences at a representative LL3 site in A1 in which ΔF values of 1 and 6 semitones were tested. a, Relationship between frequencies of A tones and B tones and the FRF of the site (BF = 7.75 kHz, as indicated by the dashed vertical line) under position 1, 2, and 3 conditions when ΔF = 6 semitones. b, c, MUA evoked by SYNC (blue waveforms) and by ALT (black waveforms) sequences with ΔF = 1 and 6 semitones is plotted in b and c, respectively, for each of the 3 tone position conditions (PR = 5 Hz). e, f, MUA evoked by sequences presented at PR = 10 Hz is plotted in e and f, respectively. Responses to A tones and to B tones are plotted separately, as indicated. Red bars mark the peak amplitude of MUA measured within the tone response window (95 ms) that was used to calculate dip ratios. d, g, Dip ratios under the 5 and 10 Hz PR conditions are plotted in d and g, respectively, for responses elicited by SYNC and ALT sequences, as indicated.
Responses evoked by SYNC and ALT sequences at a representative LL3 site in A1 in which ΔF values of 6 and 13 semitones were tested. The same conventions and panel designations were used as in Figure 4.
Data averaged across all recording sites in LL3 displayed similar results (Fig. 6, Table 1). Overall, dip ratios were significantly lower for ALT compared with SYNC after adjusting for the effect of ΔF in linear mixed-effects models (Fig. 6a: F(1,51) = 40.64; p < 0.001; Fig. 6b: F(1,51) = 46.10; p < 0.001). Additional comparisons between mean dip ratios at each value of ΔF tested revealed statistically significant or nearly significant reduced dip ratios for responses to ALT sequences compared with responses to SYNC sequences at all values of ΔF and PR tested, with the exception of ΔF = 1 at 5 Hz (t(8) = 2.21; padj = 0.17) and ΔF = 13 at 5 Hz (t(8) = 2.73; padj = 0.08). At PRs of both 5 and 10 Hz, mean dip ratios for responses to ALT sequences significantly decreased with increasing ΔF (5 Hz: F(1,17) = 13.39; p = 0.002; 10 Hz: F(1,17) = 7.33; p = 0.015). A decreasing but not statistically significant trend was also observed for responses to SYNC sequences (5 Hz: F(1,17) = 4.41; p = 0.05; 10 Hz: F(1,17) = 2.42; p = 0.14). These results parallel psychoacoustic findings in humans, which indicate that ALT sequences tend progressively to be heard as two separate streams as ΔF increases, whereas SYNC sequences tend to be heard as a single stream, even at relatively large ΔF values (Elhilali et al., 2009; Micheyl et al., 2013b).

Dip ratios averaged across recording sites in LL3 as a function of frequency separation. Mean ratios under SYNC and ALT conditions are represented by the blue and black symbols, respectively. Error bars represent the SEM. Mean ratios under the 5 and 10 Hz PR conditions are plotted in a and b. Comparison between mean ratios in the SYNC condition at 5 Hz PR and in the ALT condition at 10 Hz PR is shown in c. Asterisks indicate statistically significant differences (based on Bonferroni-corrected p values) between SYNC and ALT conditions at each value of ΔF tested. See Results for discussion and Table 1 for further details.
Moreover, a significant effect of PR on dip ratios was observed only for responses to ALT sequences, with dip ratios being smaller at 10 Hz than at 5 Hz after adjusting for ΔF (Fig. 6a,b; F(1,51) = 7.96; p = 0.007). These results also parallel psychoacoustic findings in humans, which indicate that ALT sequences are more likely to be heard as separate streams at 10 Hz than at 5 Hz PR (Van Noorden, 1975; McAdams and Bregman, 1979; Bregman, 1990; Bregman et al., 2000).
The individual A and B tones in ALT sequences were presented at double the rate in which they were presented in SYNC sequences (as PR refers to overall tone rate, not the rate of the A or B tones considered separately). To control for this difference, we also compared mean dip ratios for responses to ALT sequences at the 10 Hz PR with those for responses to SYNC sequences at the 5 Hz PR. As shown in Figure 6c, dip ratios were still significantly lower for responses to ALT sequences compared with responses to SYNC sequences (F(1,51) = 71.01; p < 0.001).
To examine whether neural response patterns elicited by ALT and SYNC sequences were similar across superficial laminar depths, we analyzed dip ratios based on responses simultaneously recorded from the two electrode contacts located 150 and 300 μm, respectively, above the contact located in LL3. As shown in Figure 7, we found that differences in dip ratios between responses to ALT and SYNC sequences, while statistically significant (SG150: F(1,51) = 13.18, p < 0.001; SG300: F(1,51) = 4.20, p = 0.046), were smaller than those observed in LL3 (compare with Fig. 6c), and none of the comparisons at specific ΔF values were statistically significant after applying the Bonferroni correction for multiple testing (Table 1).

Dip ratios averaged across two recording sites in mid/upper lamina 3 (SG150 and SG300) as a function of frequency separation. Same conventions were used as in Figure 6. Only mean ratios in the SYNC condition at 5 Hz PR and in the ALT condition at 10 Hz PR are shown. See Table 1 for further details.
We hypothesized that the reduced difference in dip ratios between ALT and SYNC conditions at more superficial laminar depths might be related to an increased bandwidth of frequency tuning relative to that in LL3. Indeed, we found that relative tuning bandwidths (bandwidth at 50% down on the FRF divided by the BF of the recording site) became progressively larger as laminar depth decreased, with LL3 tuning displaying the sharpest tuning and SG300 displaying the broadest tuning (Fig. 8; F(1,35) = 5.96; p = 0.02).

Relative tuning bandwidth as a function of laminar depth. Mean values represent the bandwidth at 50% down on the FRF divided by the BF at each recording site, averaged across sites. Error bars represent the SEM. Tuning bandwidths were measured at the following three laminar depths: LL3, and mid/upper lamina 3 at 150 and 300 μm above the LL3 electrode contact (SG150 and SG300, respectively).
Discussion
We compared A1 responses to ALT and SYNC tone sequences to subject the PS model of auditory stream segregation to a crucial test. A major prediction of the PS model is that, compared with ALT sequences, SYNC sequences will yield reduced tonotopic separation between A and B responses in A1, thus paralleling the tendency to perceive them as a single stream in human listeners.
Consistent with the PS model, we found that the dip ratio, an indirect measure of tonotopic separation of A and B tone responses, was significantly lower for responses to ALT compared with responses to SYNC sequences. Accordingly, ALT sequences yielded greater effective tonotopic separation than SYNC sequences in A1. Moreover, the dip ratio significantly decreased (and, by inference, functional tonotopic separation increased) with increasing ΔF and PR only for ALT sequences, paralleling the greater likelihood of hearing two separate streams when the ΔF and PR of ALT sequences are increased.
Our findings, based on responses in lower lamina 3, do not replicate those of Elhilali et al. (2009), who reported no significant differences in dip ratios between responses to ALT and SYNC sequences in ferret A1. There are several possible explanations for this discrepancy. One is species differences. Behavioral frequency discrimination in ferrets tends to be less sharp than in humans, monkeys, and other mammalian species (Sinnott et al., 1987; Walker et al., 2009; Alves-Pinto et al., 2016). While speculative, this may reflect a reduced level of lateral inhibition in the auditory pathway of ferrets. Given the postulated role of forward suppression in enhancing frequency selectivity in the ALT condition (Fishman et al., 2001, 2004), this potentially reduced lateral inhibition may have contributed to the lack of a significant difference between A1 responses to the ALT and SYNC sequences in ferrets (Elhilali et al., 2009). Ferrets and monkeys might also employ different physiological strategies in the perceptual organization of the sequences.
Another, more likely, explanation is that, whereas data at three different laminar depths were analyzed separately, Elhilali et al. (2009) did not specifically control for this laminar variable. Response properties are known to vary across laminae in A1 (Atencio et al., 2009; Atencio and Schreiner, 2010). Consistent with this explanation, smaller differences in dip ratios between ALT and SYNC conditions were observed in middle and upper lamina 3 compared with lower lamina 3 (Fig. 7). Indeed, dip ratios were larger overall at more superficial depths, perhaps owing to broader frequency tuning bandwidths (Fig. 8).
Finally, the passive paradigms used in both studies may have increased neural variability, leading to disparate results. Indeed, active listening can markedly affect tuning characteristics of neuronal responses in A1 (Fritz et al., 2005; Elhilali et al., 2007). Thus, determining the relative strengths of each model of stream segregation will likely require paradigms wherein animals are actively engaged in behaviors that necessitate auditory stream segregation (Lu et al., 2017).
A key question is why, in the present study, ALT sequences yielded reduced dip ratios (and, by inference, enhanced tonotopic separation) compared with SYNC sequences. Indeed, even at the largest ΔF value tested (13 semitones), responses to A and B tones in SYNC sequences were not as well separated as responses to the same tones in ALT sequences. One plausible explanation is simple response integration, as illustrated in Figure 9. When A and B tones are presented simultaneously in the SYNC condition, responses at the sites in between the tonotopic locations tuned to the A and B tones (as modeled by position 2 responses and represented by the filled purple region in Fig. 9) reflect the summation of the responses to each tone. In contrast, in the ALT condition, the in-between sites respond only to one of the tones at a time and hence show considerably less activity (relative to position 1 and 3 responses) than in the SYNC condition. Consequently, responses along the tonotopic axis would display a dip in between the regions tuned to the A and B tones in the ALT condition. Given this model, the broader neuronal frequency tuning bandwidths observed at more superficial laminar depths in A1 (Fig. 8) may partly explain the reduced difference in dip ratios between ALT and SYNC conditions, compared with the difference in ratios observed in lower lamina 3 wherein tuning is sharper.

Simple model proposed to explain the reduced dip ratios in the ALT condition compared with those in the SYNC condition. Magnitude and extent of tonotopic activity patterns elicited independently by A and B tones in both types of sequences are schematically represented by the blue and red triangles, respectively. Purple region represents the region of their overlap. When activity is averaged across time (green filled regions), ALT sequences produce a dip in between locations tuned to the A and B tones that is absent in the SYNC condition. Effects of PR are not shown.
This integration model may account for the difference in the dip between ALT and SYNC conditions only when there is overlap in neural activity elicited by the A and B tones, which would be small or negligible when ΔF is very large (e.g., 13 semitones). Thus, it is likely that additional mechanisms are involved. These mechanisms may include those contributing to the broader auditory filter bandwidths observed under simultaneous versus forward masking conditions in humans and macaques (Serafin et al., 1982; Glasberg et al., 1984; Oxenham and Shera, 2003). Accordingly, broader filter bandwidths in the SYNC condition may result in reduced tonotopic separation of A and B responses compared with the ALT condition. Indeed, the differences observed between ALT and SYNC conditions at 13 semitones are not altogether surprising given the nonlinear suppressive or facilitative interactions between responses to tones placed well outside the classical receptive field in A1 (Shamma and Symmes, 1985; Calford and Semple, 1995; Brosch and Schreiner, 1997; Sutter et al., 1999; Kadia and Wang, 2003; Metherate et al., 2005; Brosch and Scheich, 2008; Fishman et al., 2012). The effect of laminar depth might be explained by differences in the degree of forward or simultaneous masking/suppression across cortical layers, an issue that will need to be examined in future work.
The present findings lend further support to the idea that auditory stream segregation is initiated by relatively basic neural mechanisms in, or before, A1 (Fishman et al., 2001; Pressnitzer et al., 2008). The effect of ΔF on dip ratios can be explained by the frequency selectivity of neural populations in A1, while the effect of PR in the ALT condition can be explained by forward suppression and neural adaptation (Fishman et al., 2001, 2004; Micheyl et al., 2005). Finally, differences in effective tonotopic separation of A and B responses between ALT and SYNC conditions may be explained by response integration and nonlinear interactions.
A divergence between the present results and psychophysical data on streaming in humans should be noted, however. Whereas the present data show significantly lower dip ratios for ALT sequences than for SYNC sequences when ΔF = 1 semitone (Fig. 6b), ALT sequences are typically perceived as a single stream at this value, and accordingly, the PS model would predict that no difference between the ALT and SYNC conditions should be observed. This discrepancy may be mitigated, however, by assuming that the dip ratio must be below a certain threshold value (e.g., 50%) in order for A and B sounds to be segregated into separate perceptual streams. Indeed, differences in this threshold might contribute to the variability in stream segregation judgments across subjects and varying listening contexts (Micheyl et al., 2013b).
One commonly noted limitation of the PS model of streaming, which was originally based on responses to pure tone sequences, is that it cannot account for stream segregation based on complex spectrotemporal features, such as amplitude modulation, or when A and B sounds activate overlapping frequency channels (Vliegen and Oxenham, 1999; Vliegen et al., 1999; Grimault et al., 2002; Roberts et al., 2002). This shortcoming can be overcome, however, by considering neural populations in A1 or non-primary auditory cortex that selectively respond to complex sound features (Bendor and Wang, 2005; Itatani and Klump, 2009; Itatani and Klump, 2011). Indeed, our previous studies of “rhythmic masking release” (a special case of stream segregation) have shown that, despite spectral overlap, neural responses can be made differentially selective for such features via spectral integration or simultaneous suppression (Fishman et al., 2012). Thus, the PS model requires neither that A and B sounds be pure tones nor that they be represented in a topographic organization, such as tonotopy. All that the PS model requires is that responses to A and B sounds, regardless of the features that distinguish them, be functionally separated in the brain under stimulus conditions where they are heard as comprising two separate streams (see also Elhilali et al., 2009; Itatani and Klump, 2017). Thus, given its generality and explanatory power, PS constitutes a plausible physiological model of stream segregation.
Importantly, while the PS model has survived a crucial test, it in no way should be considered the sole correct model of stream segregation. The “temporal coherence” model, which is not mutually exclusive with the PS model, posits that sounds are segregated from one another when they evoke neural responses that are uncorrelated or anticorrelated with each other, such as in the ALT condition but not in the SYNC condition (Elhilali et al., 2009; Shamma et al., 2011). Indeed, temporal coherence may offer explanatory advantages over the PS model for certain stimulus paradigms (Christiansen and Oxenham, 2014; O'Sullivan et al., 2015; Teki et al., 2016). On the other hand, the PS model may play a greater role in the perceptual segregation of simultaneous sounds based on inharmonicity (Moore et al., 1986; Hartmann et al., 1990; Alain et al., 2002; Micheyl et al., 2013a) and the increased, though comparatively modest, tendency to hear simultaneous tones as separate streams as the frequency separation between them increases (Micheyl et al., 2013b). The present findings, therefore, are broadly supportive of the view that auditory scene analysis involves multiple cues and mechanisms, which may be weighted differently depending upon acoustic and behavioral context (Bregman, 1990; Christison-Lagay et al., 2015; Lu et al., 2017; Snyder and Elhilali, 2017).
Footnotes
This research was supported by National Institutes of Health Grant DC-00657. We thank Jeannie Hutagalung for assistance with animal training, surgery, and data collection. We also thank Drs. Mounya Elhilali, Jonathan Fritz, Naoya Itatani, Georg Klump, Christophe Micheyl, John Rinzel, Shihab Shamma, and Christian Sumner, and three anonymous reviewers for their helpful comments relating to the results presented in this report.
The authors declare no competing interests.
- Correspondence should be addressed to Yonatan I. Fishman, Departments of Neurology and Neuroscience, Albert Einstein College of Medicine, Bronx, NY 10461. yonatan.fishman{at}einstein.yu.edu


