

Article Figures & Data
Figures
- Figure 1.
Small-molecule screen in primary DRG neurons identifies MAP4K4 inhibitors as regulators of JNK signaling. A, Representative immunofluorescence images showing c-Jun phosphorylation in embryonic DRG cultures after NGF withdrawal (2 h). Small-molecule inhibitors targeting MAP4K4 block p-c-Jun upregulation. Green: p-c-Jun; blue: DRAQ5 (nuclei); red: HuD (cytoplasm). Scale bar, 50 μm. IC50 (nm): GNE-495, 2.24; MAP4Ki_10, 1.05; MAP4Ki_29, 14.5; and MAP4Ki_26, 16.0. Concentrations of inhibitors: GNE-495, 200 nm; MAP4Ki_10, 833 nm; MAP4Ki_29, 6.67 μm; and MAP4Ki_26, 3.30 μm. DMSO was used as a control. B, Dose–response curves showing the ratio of p-c-Jun-positive nuclei after 2 h NGF withdrawal treated with varying concentrations of four different MAP4K4 inhibitors to that in cultures treated with vehicle alone (expressed as a percentage). Each concentration was tested in duplicate wells, with both values plotted. EC50 concentrations (μm) calculated from the mean IC50 values of two plate replicates are as follows: GNE-495, 0.0476; MAP4Ki_10, 0.0343; MAP4Ki_29, 1.605; and MAP4Ki_26, 1.027.
- Figure 2.
Inhibitors targeting MAP4K4 reduce DLK/JNK pathway activation after NGF deprivation. A, Western blot analysis of NGF-deprived DRG neuron lysates demonstrate phosphorylation of c-Jun and activation of DLK as measured by increased DLK abundance and a shift in molecular weight after 3 h. Treatment with inhibitors targeting MAP4K4, GNE-495 (800 nm), MAP4Ki_10 (1 μm), and MAP4Ki_29 (10 μm), block p-c-Jun and DLK activation. B, Treatment with GNE-495 (800 nm) blocks phosphorylation of JNK (p-JNK) and DLK (shift in molecular weight) after NGF deprivation. Lambda protein phosphatase (λpp) treatment of DRG samples confirms that the increased molecular weight of DLK is due to phosphorylation. C, Phosphorylation of DLK on T43 detected by an antibody targeting phosphorylated DLK-T43 (p-DLKT43) is induced by NGF withdrawal. Treatment with GNE-495 treatment suppresses p-DLKT43 and downstream p-c-Jun. D, Analysis of DLK protein stability after 4 and 8 h of NGF withdrawal using the protein synthesis inhibitor cycloheximide (5 μm). E, GNE-495 treatment attenuates the increase in DLK protein stability in response to stress, as demonstrated by NGF deprivation 4 and 8 h in the presence of cycloheximide. Relative DLK protein levels were normalized to cycloheximide-treated DRG control lysates in the presence of NGF for each time point. DLK 4 h: p = 0.03, 8 h: p = 0.004. n = 8–10/condition from six independent experiments. Student's t test was used for statistical analysis. Data are represented as mean ± SEM, *p < 0.05, **p < 0.01.
- Figure 3.
Inhibitors targeting MAP4K4 protects from axon degeneration and apoptosis after NGF withdrawal. A, Four different inhibitors targeting MAP4K4 were able to block axon (β-tubulin) degeneration in DRG explants 20 h after NGF withdrawal. B, Quantification of axon degeneration in A using a five-point blinded scoring system (see Materials and Methods), demonstrating significant protection from axon fragmentation with inhibitors targeting MAP4K4: GNE-495, MAP4Ki_10, MAP4Ki_29, and MAP4Ki_26. n = 6/condition from 4–6 explants. C, Treatment with GNE-495 blocks caspase-3 (red) activation in dissociated primary DRG neurons labeled with tubulin (green) 8 h after NGF withdrawal to a similar degree as DLK inhibition via treatment with GNE-3511. n = 6/condition obtained from 4–6 explants. D, Quantification of activated caspase-3 in C calculated as percentage of caspase-3 positive, β-tubulin-colabeled, neurons. n = 4–8 wells per condition from 2 independent experiments (average of 2 fields of view per well, 20×). Scale bars, 100 μm. One-way ANOVA followed by Bonferroni post hoc test was used for statistical comparison. Data are represented as mean ± SEM, ****p < 0.0001.
- Figure 4.
Knock-down of GCK-IV kinases MAP4K4, MINK1, and TNIK blocks JNK pathway driven neurodegeneration. A, MAP4K4-deficient primary DRG neurons display normal activation of DLK and phosphorylation of c-Jun after NGF withdrawal. MAP4K4loxp/loxp; Cre-ERT2 DRG neurons were treated with 4-OHT to delete Map4k4. B, siRNA-mediated knock-down of Tnik or Mink1 or both Tnik and Mink1 does not block activation of DLK or p-c-Jun after NGF deprivation. Nontargeting siRNA was used as a control. C, Primary DRG neurons from MAP4K4loxp/loxp;Cre-ERT2 treated with 4-OHT and siRNAs for Tnik and Mink1 showed effective silencing of the three kinases. C, D, Triple knock-down of Map4k4, Mink1, and Tnik reduces JNK activation and p-c-Jun increase normally seen after NGF withdrawal after 2 h compared with Cre- DRGs electroporated with nontargeting control siRNA. Protein levels were normalized to β-tubulin and +NGF control siRNA samples (arbitrary units a.u.). n = 4–5/condition. E, Representative immunofluorescence images of embryonic DRGs (β-tubulin) after knock-down of all combinations of Map4k4, Mink1, and Tnik (including nontargeting siRNA controls) after 20 h of NGF withdrawal. Scale bar, 50 μm. F, Loss of all three GCK-IV subfamily MAP4Ks results in neuroprotection. Knock-down of both Tnik and Map4k4 results in moderate neuroprotection. Axon fragmentation score was defined as the average number of connected axonal sets detected in each image divided by the mean number of connected axonal sets in the control −NGF condition of MAP4K4loxp/loxp;Cre− with control siRNA (which present degenerated axons). +NGF control: n = 32 images; all other condition: n = 9 images. The −NGF images were obtained from three different wells and the +NGF images were taken from one well of each condition. One-way ANOVA was used for statistical analysis comparing siRNA treatments with −NGF control, followed by a Dunnett's multiple-comparisons test. Data are represented as mean ± SEM, **p < 0.01, ***p < 0.001, ****p < 0.0001.
- Figure 5.
Inhibitors targeting MAP4K4, TNIK, and MINK1 block DLK/JNK pathway activation in axons and induction of DLK and p-JNK in the soma after NGF withdrawal. A, Schematic illustration of experimental setup for isolation of distal axons (lower compartment, orange) from DRG cell bodies/proximal axons (inner compartment, blue) of DRG explants. Western blot analysis of DRG cell bodies/proximal axons (left, blue) and axons (orange, right), demonstrates localization of MAP4K4, MINK1, and TNIK in isolated axons as well as cell bodies. B–G, Immunoblot analysis of isolated DRG axons and cell bodies after NGF-withdrawal at 1, 3, and 6 h in the presence of DMSO or GNE-495. B–D, The presence of MAP4Ki GNE-495 reduced phosphorylation of c-Jun in explants (blue) (C) and JNK in explants and axons (red) (D) after NGF deprivation compared with DMSO control. Immunoblot intensities were normalized to TUJ1 and +NGF control (0 h of NGF withdrawal). p-c-Jun: n = 4–5/condition, p-JNK: n = 8–9/condition. E, Immunoblot analysis of DLK protein levels and p-c-Jun in isolated DRG axons and cell bodies at 1, 3, and 6 h in the presence of DMSO or GNE-495 (top). Illustration at the bottom shows how the activated fraction of DLK was calculated based on the Western blot banding pattern: molecular-weight-shifted DLKshift (red) divided by total DLKtotal (blue) normalized to actin immunoblot band intensity. The dashed line highlights the magnified region of full blot. F, Total DLK protein levels increase in cell bodies/proximal axons over time, but decrease in axons. GNE-495 block DLK induction in explants (n = 7–8/condition). G, Active fraction of DLK protein (DLKactive, see example illustration in E) is increased significantly in axons and cell bodies/proximal axons over time. GNE-495 treatment prevents DLK activation in both axons and explants (n = 7–8/condition). H, Immunofluorescence images demonstrating that both p-JNK (green) and DLK (red) protein is increased in the DRG cell bodies (DAPI: blue, TUJ-1: white) 3 h after NGF withdrawal. MAP4K inhibitors block the somal intensity of DLK and p-JNK. I, Quantification of somal p-JNK intensity relative to NGF p-JNK intensity in experiment H. J, Quantification of somal DLK intensity relative to NGF DLK intensity in experiment H (n = 40 cells/condition, obtained from 4 independent wells). One-way ANOVA followed by Bonferroni post hoc test was used for statistical comparison. Data are represented as mean ± SEM. Statistical significance level between treatment for all time points are displayed above graphs in C, D, F, and G; statistical significance level of individual time points are presented in the graphs. *p < 0.05, **p < 0.01, ***p < 0.001, ****p < 0.0001.
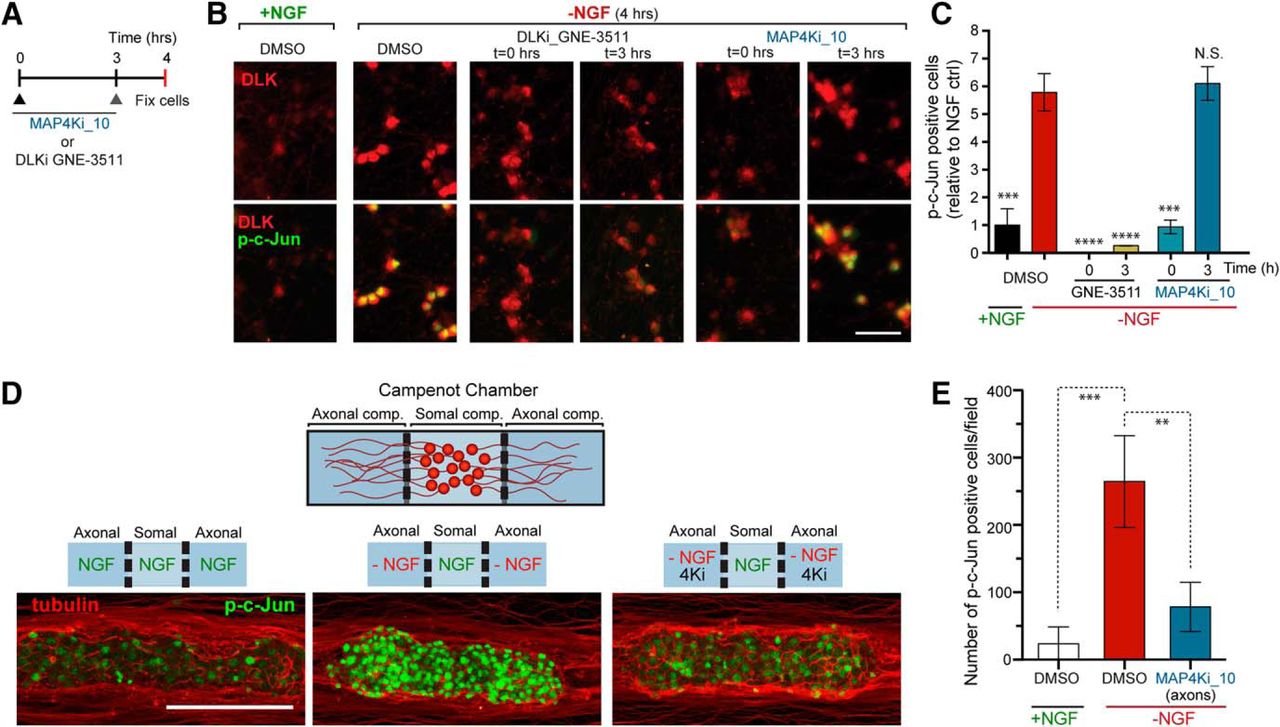
- Figure 6.
MAP4K4, MINK1, and TNIK are critical for retrograde DLK/JNK signaling after NGF deprivation. A, Schematic of NGF withdrawal experiment performed in B. MAP4K inhibitor (MAP4Ki_10, 10 μm) and DLK inhibitor (GNE-3511, 250 nm) were added either at 0 or 3 h after NGF withdrawal from cultured embryonic DRGs. Cells were fixed after 4 h. B, MAP4K inhibition at the time of NGF withdrawal (MAP4Ki, t = 0) reduces c-Jun phosphorylation; DLK inhibition (DLKi-3511) blocks c-Jun phosphorylation regardless of the timing of inhibitor addition. In contrast, inhibition of MAP4K after 3 h of NGF withdrawal (MAP4Ki, t = 3) does not reduce p-c-Jun. Scale bar, 50 μm. C, Quantification of percentage p-c-Jun-positive cells relative to +NGF control. For all conditions, n = 2 images from 2 wells. D, Schematic illustration showing the compartmentalized Campenot chamber experimental layout (top). Dissociated DRGs (red) plated in the central (somal) compartment, is separated from the outer axonal compartment (see Materials and Methods for details). Diagrams of the experimental conditions are shown below: NGF control (left), NGF withdrawn from axons (middle) and NGF withdrawn from axons in the presence of MAP4K4 inhibitor (4Ki) (right). Representative images of somal compartments stained for p-c-Jun (green), as well as tubulin (red) to mark proximal axons are displayed for each condition. Scale bar, 100 μm. D, E, Addition of MAP4Ki_10 to the axonal compartment resulted in suppression of the p-c-Jun signal. E, Quantification of the number of p-c-Jun-positive nuclei (n = 3–4/condition). One-way ANOVA followed by Dunnett's post hoc test was used for statistical comparison. Data are represented as mean ± SEM in C and mean ± SD in E, **p < 0.01, ***p < 0.001, ****p < 0.0001. N.S., Nonsignificant.


