

Article Figures & Data
Figures
- Figure 1.
Sample trial sequence in the present Simon-type manual reaching task. The target was randomly defined by color (red) or shape (square), with the correct motor response (left vs right hand) being defined, independently of the target-defining attribute (color vs shape), by the orientation of the stripes inside the target (vertical vs horizontal). Target positions were selected randomly, on a trial-by-trial basis, from all but the central and the two outer positions.
- Figure 2.
Conflict-related behavioral and neural responses averaged across hands, separately for left-hand and right-hand responses. A, Top, Differences in RTs between congruent (C; no-conflict) and incongruent (I; conflict) trials. Bottom, RTs separately for congruent (red lines) and incongruent trials (green lines) as a function of the S-R compatibility on the previous trial. B, Top, Differences in MFC theta activations between congruent (no-conflict) and incongruent (conflict) trials. Bottom, MFC theta activations separately for congruent (red lines) and incongruent trials (green lines) as a function of the previous S-R compatibility.
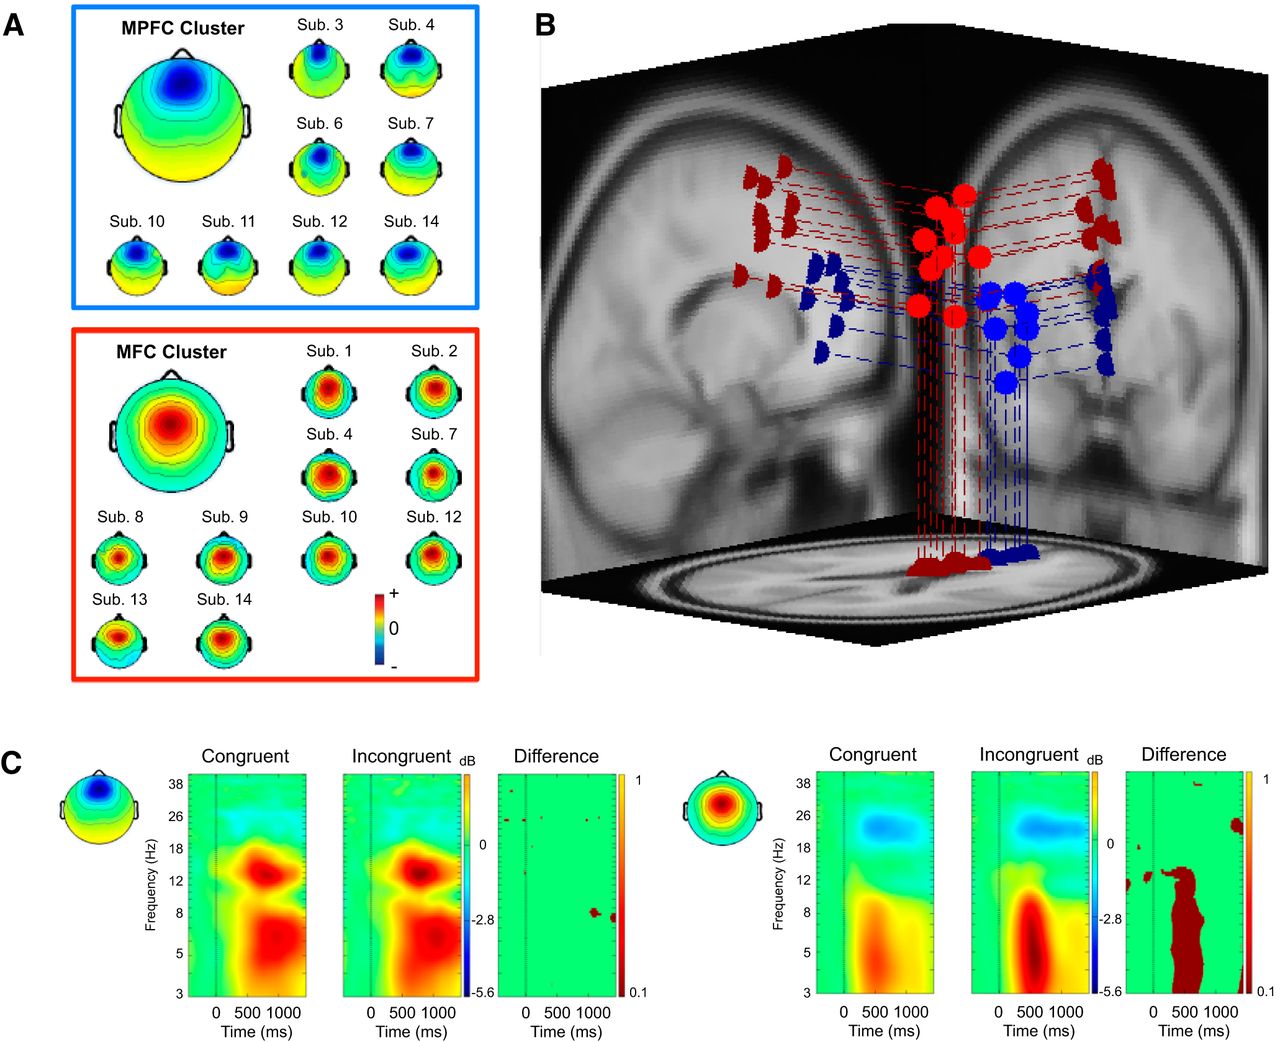
- Figure 3.
Two clusters of IC EEG source processes with equivalent dipole centroids in or near ACC. A, Larger maps, Mean scalp topographies for the MPFC (top) and MFC (bottom) IC clusters. Smaller maps, Topographies of their individual ICs. Map sign orientation (red vs blue) is arbitrary. B, Equivalent dipole locations of individual ICs in the MPFC (blue spheres, lines) and MFC (red spheres, lines) IC clusters projected on horizontal, sagittal, and coronal views of the standard MNI template brain. Cluster centroids of the equivalent dipole locations (data not shown) are as follows: MPFC, BA32, Talairach coordinates, x = 1, y = 38, z = 11 (blue); MFC, BA32, Talairach coordinates, x = 0, y = 9, z = 39 (red). C, Cluster-mean event-related spectral perturbations time-locked to onset of stimuli mandating spatially congruent and incongruent responses, respectively, for the MPFC (left) and MFC (right) IC clusters. Dark red represents significant (p < 0.01 by two-tailed paired t tests) inincongruent-minus-congruent ERSP differences between the two conditions. Note the absence of an fmθ difference for the MPFC cluster.
- Figure 4.
Hypothetical data patterns for MFC theta power. Left panels, Predicted MFC theta increases produced by a pure conflict-related versus a pure RT-related modulation. Right panels, Predicted MFC theta increases produced by a combination of both conflict- and RT-related modulations, determining MFC theta power either independently of one another or interactively. In all hypothetical scenarios, each RT quartile is assumed to correspond to the same bounds for congruent (red lines) and incongruent trials (blue lines).
- Figure 5.
fmθ power changes across congruent and incongruent trials sorted by RT and synchronized to stimulus onsets (at time 0). A, Spectrographic images of all trials sorted by RT for each of the 8 participants contributing to the MPFC cluster. B, MPFC ERSPs for trials in four RT-sorted groups (fastest, faster, slower, slowest). C, Spectrographic images of all trials sorted by RT for each of the 10 participants contributing to the MFC cluster. Note the higher mean theta power before slower responses (top traces in each panel). D, MFC ERSPs for trials in four RT-sorted groups (very fast, fast, slow, very slow). Note, again, that the theta power increase is larger in slower RT trials.
- Figure 6.
fmθ activity separately for each response speed quartile (fastest, faster, slower, slowest). A, RT quartile-dependent MPFC theta power synchronized to response (left) and stimulus onset (right). B, MPFC theta power separately for congruent (red) and incongruent trials (blue) as a function of RT quartile. C, RT quartile-dependent MFC theta power synchronized to response (left) and stimulus onset (right). D, MFC theta power separately for congruent (red) and incongruent trials (blue) as a function of RT quartile. Theta power was extracted from the 200 ms time window ending at the mean trial-subset RT, with theta increases estimated by subtracting mean baseline power in the (−1000 ms to −750 ms) time window before response onset.
- Figure 7.
fmθ activity (averaging ERSP values in the 200 ms window preceding the motor response) separately for congruent (C) and incongruent (I) trials. A, MPFC theta averaged across hands. B, MPFC theta for left-hand responses. C, MPFC theta for right-hand responses. D, MFC theta averaged across hands. E, MFC theta for left-hand responses. F, MFC theta for right-hand responses. Each subfigure, Left, C-I differences reflecting the “combined effects” of conflict and RT-related processes. Middle, C-I differences reflecting the isolated conflict effects. Right, C-I differences reflecting the isolated effect of conflict-unrelated processes. Significant and nonsignificant differences between congruent and incongruent conditions are indicated by the respective p values. **p < 0.01; ***p < 0.001.


