

Abstract
Acute influenza infection has been reported to be associated with neurological symptoms. However, the long-term consequences of an infection with neurotropic and non-neurotropic influenza A virus (IAV) variants for the CNS remain elusive. We can show that spine loss in the hippocampus after infection with neurotropic H7N7 (rSC35M) and non-neurotropic H3N2 (maHK68) in female C57BL/6 mice persists well beyond the acute phase of the disease. Although spine number was significantly reduced at 30 d postinfection (dpi) with H7N7 or H3N2, full recovery could only be observed much later at 120 dpi. Infection with H1N1 virus, which was shown previously to affect spine number and hippocampus-dependent learning acutely, had no significant long-term effects. Spine loss was associated with an increase in the number of activated microglia, reduced long-term potentiation in the hippocampus, and impairment in spatial memory formation, indicating that IAV-associated inflammation induced functional and structural alterations in hippocampal networks. Transcriptome analyses revealed regulation of many inflammatory and neuron- and glia-specific genes in H3N2- and H7N7-infected mice at day 18 and in H7N7-infected mice at day 30 pi that related to the structural and functional alterations. Our data provide evidence that neuroinflammation induced by neurotropic H7N7 and infection of the lung with a non-neurotropic H3N2 IAV result in long-term impairments in the CNS. IAV infection in humans may therefore not only lead to short-term responses in infected organs, but may also trigger neuroinflammation and associated chronic alterations in the CNS.
SIGNIFICANCE STATEMENT In the acute phase of influenza infection, neuroinflammation can lead to alterations in hippocampal neuronal morphology and cognitive deficits. The results of this study now also provide evidence that neuroinflammation induced by influenza A virus (IAV) infection can induce longer-lasting, virus-specific alterations in neuronal connectivity that are still detectable 1 month after infection and are associated with impairments in spatial memory formation. IAV infection in humans may therefore not only lead to short-term responses in infected organs, but may also trigger neuroinflammation and associated chronic alterations in the CNS.
Introduction
Influenza is a highly contagious disease caused by RNA viruses affecting birds and mammals, with a high risk of serious illness and death worldwide. Although the primary target of influenza viruses in mammals is the lung, neurological complications have also been reported (Ekstrand, 2012; Shah et al., 2014). However, the mechanisms and consequences of neuroinflammation caused by influenza A virus (IAV) are only partly understood. Neurotropic IAV strains are indeed able to enter the CNS through the blood–brain barrier (BBB) or microvascular endothelial cells (Tomonaga, 2004). For instance, the highly pathogenic avian influenza virus (H5N1) can infect the CNS and subsequently lead to neuronal cell death in the substantia nigra pars compacta (Kristensson, 2006; Jang et al., 2012) induced by neuroinflammation through the activation of glial cells and altered proinflammatory/inflammatory cytokine expression (Jang et al., 2009, 2012). Interestingly, neuropsychiatric complications were not only reported after infection with neurotropic IAV variants, but also after non-neurotropic H1N1 virus infection, especially in children (Surana et al., 2011). Neurodevelopmental problems were shown to be a risk factor for a severe outcome after influenza infection, including death in children (CDC, 2012; Ekstrand, 2012). In this scenario, activation of the peripheral innate immune system can induce the production of proinflammatory/inflammatory cytokines such as interleukin-1β (IL-1β), IL-6, and tumor necrosis factor-α (TNF-α) within the brain (Thomson et al., 2014; Riazi et al., 2015), thereby severely affecting cognition and emotional behavior (Raison et al., 2006; Camara et al., 2015).
The hippocampus, a brain region involved in learning and memory processes (Korte and Schmitz, 2016), is especially sensitive to neuroinflammation (Vitkovic et al., 2000; Lynch, 2002; Heneka et al., 2014). Inflammatory cytokines can impair hippocampal long-term potentiation (LTP) (Pickering and O'Connor, 2007; Riazi et al., 2015) and inhibit neurotrophic factor signaling, thereby negatively influencing synaptic plasticity and memory formation (Tong et al., 2008, 2012). Furthermore, a decrease in hippocampal dendritic spine density and impairment in synaptic plasticity could be observed after activation of peripheral and central immune responses (Jurgens et al., 2012; Vasek et al., 2016). Indeed, it is now well established that a peripheral immune stimulation can affect the intact CNS (Richwine et al., 2008) via the activation of microglia during a secondary, mirror inflammatory response in the brain (Riazi et al., 2015). Microglia, CNS-resident macrophages, are usually the first to be activated in response to brain infections or damage. In contrast to this, nonactivated or “resting” microglia perform housekeeping functions within the healthy CNS, including synapse turnover and synaptic plasticity. Therefore, long-term microglial activation might interfere with these processes (Nimmerjahn et al., 2005; Yirmiya and Goshen, 2011; Hristovska and Pascual, 2015).
Whereas a short-term influence of IAV infection on hippocampal neuron morphology and cognition was shown recently in mice for non-neurotropic PR8 (H1N1) IAV (Jurgens et al., 2012), long-term effects have not been studied so far. Here, we investigated the impact of three different IAV variants on hippocampal neuron morphology and hippocampus-dependent behavior. First, we used the well characterized PR8 (A/PuertoRico/8/34) non-neurotropic virus (Majde et al., 2007; Hodgson et al., 2012). The second non-neurotropic virus belonged to the H3N2 subtype, maHK68 (mouse-adapted A/Hong-Kong/1/68) (Haller et al., 1979). As a model for neurotropic IAV infection, the polybasic rSC35M (recombinant A/Seal/Mass/1/80 mouse-adapted, H7N7) was used (Gabriel et al., 2005). The long-term consequences of infections with these viruses on CNS function and morphology have not been investigated in detail.
Here, we describe impairments in spatial learning associated with alterations in hippocampal structure and function and an increased number of activated microglia as long-term consequences of IAV infection. These findings point toward long-term hippocampal neuroinflammation as the cause of the neurological symptoms that lasted for 1 month after the infection.
Materials and Methods
Ethics statement.
The experiments performed with mice were approved according to the animal welfare law in Germany. All protocols used in this project have been reviewed and approved by the local committees at the Helmholtz Centre for Infection Research and TU Braunschweig and the authorities (LAVES, Oldenburg, Germany; permit number: 3392 42502-04-13/1234) according to the national guidelines of the animal welfare law in Germany (Tierschutzgesetz in der Fassung der Bekanntmachung vom 18, Mai 2006, BGBl. I S. 1206, 1313; das zuletzt durch Artikel 20 des Gesetzes vom 9, Dezember 201, BGBl. I S. 1934 geändert worden ist). The virus was prepared by infection of 10-d-old embryonated chicken eggs obtained from a commercial vendor (Charles River Laboratories).
Viruses and mice.
Stocks of viruses were obtained from Stefan Ludwig, University of Münster [PR8M, A/PuertoRico/8/34 (H1N1), Münster variant (Blazejewska et al., 2011)], Georg Kochs, University of Freiburg [maHK68, mouse-adapted A/Hong-Kong/1/68 (H3N2); Haller et al., 1979], and from Gülsah Gabriel, Heinrich-Pette Institute, Hamburg [rSC35M, mouse-adapted A/Seal/Mass/1/80 (H7N7); Gabriel et al., 2005]. Virus stocks were propagated by infection of 10-d-old embryonated chicken eggs (PR8M, maHK68) or in MDCK (Madin–Darby Canine Kidney) cell culture (rSC35M) as described previously (Wilk and Schughart, 2012). Female inbred mice of the strain C57BL/6J were obtained from Janvier and maintained under specific pathogen-free conditions according to the German animal welfare law.
Mouse infections.
Female C57BL/6J mice (Janvier) at the age of 8–10 weeks were anesthetized by intraperitoneal injection of 0.9% (w/v) NaCl (Merck) ketamine–xylazine solution [85% NaCl (0.9%), 10% ketamine (100 mg/ml), 5% xylazine (20 mg/ml); 10 ml per 1 kg body weight] and then infected intranasally with a dose of 10 (H3N2 and H7N7) or 2 × 10³ (H1N1) focus forming units (FFUs) of the respective virus in 20 μl of sterile phosphate buffered saline (PBS). Body weight was monitored for 2 weeks after infection. Mice showing >30% of body weight loss were killed.
Viral load in the brain.
To detect low amounts of virus in brain of infected mice, egg infection was used as a more sensitive method to determine viral load. For this purpose, brains were homogenized in PBS with 0.1% bovine serum albumin (BSA) using the Fast Prep instrument. Debris was removed by centrifugation for 10 min at 1000 rpm. The samples were stored in aliquots at −70°C. In a first test, 50 μl of undiluted samples were given per embryonated egg (three replicates per sample). After 48 h of incubation at 37°C, allantoic fluid was harvested and tested using the hemagglutination assay (Wilk and Schughart, 2012) for virus positivity. Samples identified to be positive for the virus were further quantified by the 50% egg infectious dose assay as described previously (Szretter et al., 2006). Titers were calculated using the Reed–Muench method.
Histology.
Brains from infected mice on indicated days after infection were extracted in toto and immersion fixed for 24–72 h in 4% buffered formaldehyde solution, pH 7.4. After fixation and before embedding, the brains were separated in transverse sections using a coronal matrix system following standard guidelines (Morawietz et al., 2004). In addition to the recommended planes, the nasal part was divided within the sagittal median to include the olfactory bulbs (OBs) in the histological analysis. Sections of brains (0.5 μm) were cut with the microtome and stained with H&E or immunostained with mouse-anti-IAV nucleoprotein (NP), clone Hb65, mouse lgG2a (Kerafast, catalog #FCG013, RRID:AB_2716646). Inflammation in the infected brain was evaluated using a semiquantitative scoring system for perivascular mononuclear cuffing (0 = normal, + = single inflammatory cells, ++ = 2–3 layers of infiltrates, and +++ = >3 layers of infiltrates). In addition, immunohistochemistry for the virus was analyzed using a semiquantitative scoring system from 0 = no, 1 = few, 2 = multiple, to 3 = numerous infected cells (Gerhauser et al., 2007). Several brain regions, including the OB, cerebral cortex, corpus striatum/basal ganglia, thalamus/hypothalamus, hippocampus, mesencephalon, cerebellum, and medulla oblongata, were evaluated separately and a mean value determined for each animal.
Behavioral assays.
For behavioral evaluation, 4 groups of 8- to 10-week-old female C57BL/6J mice were treated intranasally with PBS as control and H1N1, H3N2, and H7N7 IAV strains and then assigned to two different time points of the experiment, including 30 and 120 dpi (n = 7–10). All behavioral experiments were performed the same time of day during the light period by an experimenter blinded to all types of treatment groups.
Open-field test.
To investigate influenza-induced illness behavior and willingness of the mice to explore, the open-field test was performed as described previously (Walsh and Cummins, 1976). Briefly, mice were placed along one side of a white PVC open-field apparatus (40 × 40 × 40 cm) for 5 min. The central area of the arena was specified as the center part (30 × 30 cm). Between each session of experiments, the apparatus was cleaned with Bacillol. Movement data, including total distance traveled, average speed, and percentage of activity in the periphery and in the center part of the arena, were collected by ANY-maze behavioral tracking software (Stoelting, RRID:SCR_014289).
Elevated plus maze test.
To investigate influenza-induced anxiety-like behavior, the elevated plus maze test was performed as described previously (Hogg, 1996). In this test, the apparatus is composed of a cross with two opposed open arms (25 × 5 cm) and two opposed closed arms (25 × 5 cm, surrounded by 20-cm-high walls). The arena was made of white PVC and was elevated 50 cm above the floor. Mice were placed in the central part of the arena (5 cm × 5 cm) facing toward an open arm and permitted to move freely in the arena for 5 min. Locomotion data, including the percentage of time spent in open and closed arms, were collected by ANY-maze behavioral tracking software (Stoelting, RRID:SCR_014289).
Morris water maze test.
To investigate the effects of IAV infection on cognitive function, spatial learning and memory formation were assessed using the initial training and the reversal learning phase of the Morris water maze paradigm (Morris, 1984; Vorhees and Williams, 2006). The maze is comprised of a circular pool 150 cm in diameter and 19–20°C water temperature. The platform was 10 cm in diameter and hidden 1 cm underneath the surface of the opaque water (Titaandioxide; Euro OTC Pharma). Before the training, a visible platform task was performed as a pretraining and was used to ensure that swimming ability and visual acuity were intact in control and treated animals. During this phase, the animals had two trials (maximum of 60 s each) per day for 3 consecutive days to reach the visible platform; the position was altered during the trials (data are not shown). Subsequently, training in the Morris water maze test was performed for 8 d with the invisible platform located in the NE quadrant. Each day, animals were placed in the water for four trials with different starting points (SE, S, W, and NW) randomly. The animals were permitted to swim freely for 60 s or until the platform was reached. Otherwise, they were guided to the platform and allowed to sit on it for 20 s. A detailed analysis of the swimming path allows for a qualitative assessment of learning in mice. Progressively, over time, healthy animals switch from egocentric (hippocampus-independent: chaining, scanning and random swimming) to allocentric (hippocampus-dependent: directed search) strategies to navigate to the hidden platform while a spatial map of the maze is formed (Garthe et al., 2009; Garthe and Kempermann, 2013). The pathway map to find the platform was analyzed as follows: searching strategies including scanning characterized by <60% and >10% surface coverage, chaining characterized by >80% time in a doughnut-shaped annulus zone, and random swimming characterized by >60% surface coverage of the whole pool area in a directed search characterized by >80% time in Wishaw's corridor (Whishaw, 2004; Garthe et al., 2009; Garthe and Kempermann, 2013).
To evaluate memory retrieval, two probe trial tests were performed at the third and sixth day of the acquisition training before starting the four trials of training at that day. Another reference memory test was performed 24 h after the last day of acquisition training. During the probe trial, the platform was removed and the animals were allowed to swim freely for 45 s. After the third probe trial test, the platform was moved to the opposite quadrant of the pool (SW) to test the ability of the animals to form a new memory. The task consisted of 3 training days. On the fourth day, one single probe trial was performed (D'Hooge and De Deyn, 2001). All data, including the escape latency (time to reach the platform), percentage of searching time spent in the four quadrants of the pool, percentage time spent in the border (thigmotaxis), annulus (chaining), central circle (scanning) zones, and Whishaw's corridor (directed search) of the pool, and occupancy plots of the presence in the quadrants for the animals groups were collected by ANY-maze behavioral tracking software (Stoelting, RRID:SCR_014289).
Electrophysiological experiments.
To investigate the function of CA1 hippocampal neurons, electrophysiological recording experiments were performed at 30 and 120 dpi. At 30 dpi, a total number of 45, and at 120 dpi, a total of 38 acute hippocampal slices were prepared from 14 and 12 female mice in three groups which were inoculated by PBS as control and H3N2 and H7N7 influenza virus 8–10 weeks after birth. Briefly, mice were deeply anesthetized with 100% CO2, killed, and then brains were quickly removed and transferred into ice-cold carbogenated (95% O2 and 5% CO2) artificial CSF (ACSF) containing the following (in mm): 124 NaCl, 4.9 KCl, 1.2 KH2PO4, 2.0 MgSO4, 2.0 CaCl2, 24.6 NaHCO3, and 10 d-glucose, pH 7.4. Afterward, the hippocampus was dissected and transverse hippocampal slices (400 μm) were obtained using a manual tissue chopper. The whole procedure was done in 2–3 min. The hippocampal slices were transferred to an interface recording chamber (Scientific System Design), where they were incubated at 32°C with a constant flow rate (0.5 ml/min) of carbogenated ACSF for 2 h before the start of recordings. Field EPSPs (fEPSPs) were recorded in the stratum radiatum of the CA1 region in hippocampal slices. Responses were evoked by stimulation of the Schaffer collateral pathway using two monopolar, lacquer-coated stainless-steel electrodes (5 MΩ; AM Systems). These stimulation electrodes (S1 and S2) were positioned equidistantly on both sides of the recording electrode and, by this means, two independent stimulation pathways could be used for the same CA1 recording region. For recording fEPSPs (measured as the first slope function), the recording electrode (5 MΩ; AM Systems) was placed in the CA1 apical dendritic layer (at least 20 μm away from the stratum pyramidale) and signals were amplified by a differential amplifier (Model 1700; AM Systems). The signals were digitized using a CED 1401 analog-to-digital converter (Cambridge Electronic Design). An input–output curve (afferent stimulation vs fEPSP slope) for assessment of basal synaptic transmission was generated after the preincubation period. Test stimulation intensity was modified to be adjusted to extract fEPSP slope as 40% of the maximal fEPSP response for both synaptic inputs S1 and S2. To investigate short-term plasticity, a paired-pulse stimulation protocol was used with two consecutive stimuli with equal intensity from one of the stimulating electrodes in each hippocampal slice. Paired-pulse facilitation (PPF) could be extracted from the fEPSP slopes as a response to the second stimulation over the first one at different interpulse intervals of 10, 20, 40, 60, 80, and 100 ms. To investigate LTP, 20 min after baseline recording, LTP was induced by theta-burst stimulation (TBS) including four bursts at 100 Hz repeated 10 times in a 200 ms interval. This stimulation was repeated three times in a 10 s interval. Only healthy sections with a stable baseline were included in the electrophysiological data analysis. The slope of fEPSPs was measured over time and normalized to the baseline. Data acquisition and offline analysis were performed using IntraCell software (version 1.5, LIN).
Golgi–Cox staining.
To investigate the long-term effects of IAV infection on hippocampal neuron morphology, 4 groups of 2-month-old female C57BL/6J mice were inoculated intranasally with PBS as control and the H1N1, H3N2, and H7N7 IAV strains. Mice were deeply anesthetized with CO2 and killed via decapitation at 30, 60, and 120 dpi (n = 4–5). The whole brain was removed rapidly. The left hemisphere was prepared for further immunohistochemical experiments, whereas the right one was incubated in FD rapid Golgi stain kit (FD NeuroTechnologies) according to the manufacturer's protocol. Afterward, hemispheres were blocked in 2% agar and 200-μm-thick coronal sections were cut with a vibratome (Leica, VT 1000 S) and mounted on gelatin-coated glass slides. Subsequently, the sections were processed for signal development before being dehydrated through graded alcohols and mounted using Permount (Thermo Fisher Scientific).
Immunohistochemistry.
To determine the inflammatory response in the hippocampus after influenza infection, the left hemisphere was isolated and fixed in 4% paraformaldehyde (PFA) for 24 h and then cryoprotected in 30% sucrose solution in 0.1 m phosphate buffer (PB) for 24 h and stored in Tissue-Tek optimum cutting temperature compound (Hartenstein Laborversand) at −70°C. For fluorescence immunostaining, 30 μm sections were cut using a freezing microtome (Frigomobil; R. Jung). Afterward, 10 successive sections (5 for IBA-1 staining and 5 for GFAP staining) were washed with PBS 1× and blocked in PBS 1× solution containing 0.2% Triton X-100, 10% goat serum, and 1% BSA for 1 h at room temperature. Sections were incubated overnight at 4°C with the following primary antibodies: anti-ionized calcium-binding adaptor molecule 1 (IBA-1) (1:1000; rabbit polyclonal; Synaptic Systems, catalog #234 003, RRID:AB_10641962) and anti-glial fibrillary acidic protein (GFAP) (1:1000; mouse monoclonal; Sigma-Aldrich, catalog #G3893, RRID:AB_477010) were diluted in PBS 1×, 0.2% Triton X-100, and 10% goat serum. Secondary antibodies were Cy3-conjugated AffiPure goat anti-rabbit IgG (H+L) (1:500; Jackson ImmunoResearch Laboratories, catalog #111-165-144, RRID:AB_2338006) and Cy3-conjugated AffiPure goat anti-mouse IgG (H+L) (1:500; Jackson ImmunoResearch Laboratories, catalog #115-165-068, RRID:AB_2338686), which were diluted in PBS 1×. Sections were mounted using Fluoro-gel mounting medium (Electron Microscopy Sciences).
Imaging and image analysis.
To survey the hippocampal neuron morphology, second- or third-order branches of apical dendrites within the CA1 and CA3 and dendrites within the dentate gyrus (DG) superior and inferior subregions of the hippocampus (10 cells per animal, 40–50 dendrites per group) were imaged in 3D (z-stack thickness of 0.5 μm) using an Axioplan 2 imaging microscope (Zeiss) equipped with an ApoTome module (Zeiss) with a 63× [numerical aperture (NA), 1] oil objective and a digital camera (AxioCam MRm; Zeiss). In all selected neurons, spine density per micrometer dendrite was calculated using Fiji software (BioVoxxel, RRID:SCR_015825) on the segments of dendritic branches with a length of >60–70 μm located at least 50 μm away from the soma. The total number of spines along the segments of dendritic branches was determined manually by an investigator blinded to the type of treatment.
The IBA-1- and GFAP-stained images from hippocampal subregions including CA1, CA3, and superior and inferior blade of DG (n = 2–5 mice per each group and 5 frames per each animal, 10–25 frames per group) were taken in 3D (z-stack thickness of 1 μm) using an Axioplan 2 imaging microscope (Zeiss) microscope equipped with a 20× objective (NA, 0.8) and a digital camera (AxioCam MRm; Zeiss). To quantify the density of microglia and astrocytes, a region of interest (ROI) was drawn in each frame of the hippocampal subregions, the total number of IBA-1- and GFAP-positive cells with clearly visible nuclei by DAPI were determined manually with Fiji software (BioVoxxel, RRID:SCR_015825), and the sampled volume was calculated. Results are expressed as the number of cells per cubic millimeter of tissues and then normalized to control. For morphometric analysis of IBA-1 positive cells, at least 30 microglial cells (6 cells per each ROI) were randomly selected per hippocampal subregions of IBA-1 stained images from each animal (n = 4–5 per group, 120–200 microglial cells per each group). The total primary microglial cell processes were counted using Fiji software (BioVoxxel, RRID:SCR_015825). For the immunohistochemical experiments, all slides were coded and analysis was performed blindly.
Evaluation of BBB permeability.
To determine BBB integrity after IAV infection, spectrophotometry was used. Eight-week-old female C57BL/6J mice (n = 3–4 per each group) were infected by H3N2 and H7N7 IAV; then, at 4, 8, and 10 dpi, they were injected with a 2% Evans blue solution (Sigma-Aldrich) in normal saline (4 ml/kg body weight) intraperitoneally. The dye was allowed to distribute by the circulatory system for 5 h (4 and 8 dpi) to 20 h (10 dpi). Afterward, the mice were killed and the brain was isolated, frozen in liquid nitrogen, and stored at −70°C until further use. The preparation of tissue for assessing the presence of Evans blue stain in the brain as an indicator of a compromised BBB was performed as described previously (Manaenko et al., 2011). Evans blue absorbance was detected at 610 nm using a spectrophotometer (Denovix, DS-11 fx).
ELISA.
To quantify the presence of proinflammatory cytokines, including IFN-γ and TNF-α, in the blood serum and supernatant of homogenized hippocampi or brain hemispheres of influenza-infected mice, an ELISA experiment was performed. For this purpose, 8-week-old female C57BL/6J mice (n = 3–4 per each group) were inoculated with IAV strains and PBS as a control. Body weight was monitored and the samples were collected at 8 dpi (before, the maximum body weight loss was observed at this time). Mice were deeply anesthetized with CO2 and killed via decapitation. Blood was collected using a pipette and incubated for at least 30 min at room temperature. To separate the serum from the cellular blood components, the samples were centrifuged at 2000 × g for 20 min at room temperature. The supernatant was immediately frozen in liquid nitrogen. For protein isolation, the tissue was homogenized using an Eppendorf-fitting pestle in 400 μl of STKM lysis buffer containing the following (in mm): 250 sucrose, 50 Tris-HCl, 25 KCl, and 5 MgCl2, along with a protease inhibitor mixture (cOmplete). The samples were centrifuged at 4°C for 10 min at 13,000 × g. The supernatant was collected and stored at −70°C. To determine cytokine level, a mouse IFN-γ and TNF-α ELISA kits (R&D Systems) were used according to the manufacturer's recommendations. Absorbance at 450 nm was measured with a Tecan Sunrise microplate reader with a wavelength correction at 680 nm connected to Magellan software. Finally, the measured optical density of the reaction was compared with the optical density of the known standard samples to determine protein concentration in the samples.
RNA isolation and gene expression analysis by microarray.
At 18 and 30 dpi, mice were killed by CO2 asphyxiation and the hippocampus was removed. Immediately after dissection, the tissue was placed into RNAlater solution (Qiagen), incubated overnight at 4°C, and stored at −20°C. For each group, hippocampi from at least three mice were prepared as independent biological replicates. Tissues were homogenized with FastPrep-24 instrument placing them in a 2 ml of lysing matrix tube (MP Biomedicals) containing 1 ml of QIAzol lysis reagent. Homogenization was performed with 6.0 m/s speed for 1 min. Isolation of RNA was performed with the Rneasy Lipid Tissue Mini Kit (Qiagen). The quality and integrity of the RNA was controlled on the 2100 Bioanalyzer (Agilent Technologies). For DNA microarray hybridization, 100 ng of total RNA was applied for the Cy3-labeling reaction using the one color Quick Amp Labeling protocol (Agilent Technologies). Labeled cRNA was hybridized to Agilent Technologies mouse 4x44k microarrays for 16 h at 68°C and scanned using the Agilent Technologies DNA Microarray Scanner.
Microarray data were analyzed using the R software package (R Core Team, 2013; R Project for Statistical Computing, RRID:SCR_001905). Preprocessing steps included background correction, quantile normalization, and annotation using the MmAgilentDesign026655.db (Carlson, 2014), LIMMA (Smyth, 2004) and Agi4x44PreProcess (Gentleman et al., 2004) packages. Multigroup comparisons and identification of differentially expressed probesets (DEPs) were performed with the LIMMA package (Smyth, 2004) using Benjamini–Hochberg correction for multiple testing (Benjamini and Hochberg, 1995). DEPs between two groups were identified based on an adjusted p-value of <0.1 and exhibiting more than a 1.4-fold (log2 of 0.5) difference in expression levels. KEGG pathway enrichment analysis and cluster profiling was performed with the package clusterProfiler (Yu et al., 2012). The raw data have been deposited in the GEO expression database (http://www.ncbi.nlm.nih.gov/geo/) under the accession number GSE106620.
Experimental design and statistical analyses.
All experimental designs were explained in the respective parts of Materials and Methods section. Data were analyzed and plotted by GraphPad Prism 6 software (RRID:SCR_002798) and are presented as mean ± SEM. Statistical analyses for each experiment are indicated in the Results section and figure legends, including number of animals (n); numbers of brain slices, cells, and samples; statistical test used (one-way and two-way ANOVA and repeated-measures ANOVA or unpaired two-tailed t test) and post hoc analysis (Bonferroni's and Benjamini–Hochberg test). Unless specified otherwise, the minimum significance value was considered p < 0.05. All experiments were analyzed in a strictly blind fashion.
Results
Infection of C57BL/6J mice with different IAV variants: establishing mouse models to study the long-term effects of influenza infection on CNS function
Female C57BL/6J mice at the age of 8–10 weeks were infected with IAV by intranasal instillation with three different mouse-adapted viruses. Earlier studies demonstrated that female mice are more susceptible and produce more neutralizing antibodies and higher levels of chemokines and cytokines than males during infection with influenza viruses (Geurs et al., 2012), so only female mice were used in this study. Here, we investigated three different IAVs. We chose the well characterized non-neurotropic mouse-adapted human PR8 (H1N1) virus (Blazejewska et al., 2011), which is known to enter the olfactory nerves and the glomerular layer of the OB within 4 h after intranasal infection, but without further replicating in the brain or inducing neuropathology (Majde et al., 2007; Hodgson et al., 2012). This specific IAV variant was also used by Jurgens et al. (2012) to demonstrate altered hippocampal neuron morphology and impaired cognition during the acute phase of the infection (7 dpi). In addition, we included another non-neurotropic mouse-adapted human IAV strain, the maHK68 (H3N2) (Haller et al., 1979) in our studies, for which we established a well characterized mouse model (Leist et al., 2016). Furthermore, we included the neurotropic virus rSC35M (H7N7), which was isolated from seals and adapted to mouse (Gabriel et al., 2005). The advantage of using this virus is that most infected mice survive the infection. This allowed us to study the long-term effects of a neurological IAV infection. Such studies cannot be performed with the highly pathogenic H5N1 virus that is often used as model for neurotropic IAV infections because all infected mice will die within 5–10 dpi. Avian H7N7 viruses are able to infect humans and represent a potential future pandemic threat (Lang et al., 1981; Banks et al., 1998; Fouchier et al., 2004; Shinya et al., 2005).
The infection doses for all three viruses were adjusted to sublethal concentrations, allowing us to study long-term effects of IAV infections. Using these doses, 100% of H1N1- (100 ± 0%, n = 37), 84% of H3N2- (84.12 ± 4.60%, n = 63), and 76% of H7N7 (76.34 ± 4.40%, n = 93)-infected mice survived the infection. Infection with all three viruses resulted in comparable body weight losses (Fig. 1A). The maximum weight loss in H3N2- (n = 13) and H7N7 (n = 18)-infected mice occurred at 9 dpi and in H1N1-infected animals (n = 11) at 8 dpi.

Female C57BL/6J mice were infected intranasally with the indicated viruses and dosages. A, Body weight loss depicted as percentage of the starting weight of mice during the acute phase of IAV infection (n = 10–18 in each group). B, Brains of infected mice were tested for the presence of infectious virus in embryonated eggs. Positivity in a hemagglutination assay is displayed as number of positive samples/number of tested samples. Positive samples from the indicated days were titrated by determining EID50 (egg infectious dose 50)/ml. C, Representative sections from the immunohistochemical analysis, hippocampus (left), and medulla oblongata (right) of mice 7 d after intranasal infection with H3N2 (maHK68) (top row) and H7N7 (rSC35M) (bottom row) IAV subtypes. Immunohistochemistry did not reveal influenza NP in the hippocampus and medulla oblongata of H3N2-infected mice and hippocampus of H7N7-infected mice, whereas high numbers of virus infected cells in the medulla oblongata of H7N7-infected mice were detected. Scale bars, 200 μm. Sections were counterstained with Mayer's hematoxylin. Inserts, Higher magnifications of the respective images. Scale bars, 33 μm. D, In the medulla oblongata of a mouse at 9 d after intranasal H7N7 infection, severe lymphohistiocytic meningitis, few numbers of inflammatory cells in the parenchyma, and a moderate gliosis (center of the image) were observed. Scale bars, 80 μm. Top insert, Degenerating cells in higher magnification (arrow). Bottom insert, Viral antigen was found in one cell (arrow) using immunohistochemistry for influenza nucleoprotein and Mayer's hematoxylin as counterstaining. Scale bars, 33 μm. E, H&E staining from brains of H3N2- and H7N7-infected mice were scored semiquantitatively for signs of inflammation at the respective days (n = 3–5). F, Immunohistochemistry of viral NP was scored semiquantitatively (n = 4–5). Data are presented as mean ± SEM.
First, the brains of IAV-infected mice were analyzed for the presence of infectious virus particles (Fig. 1B). For this, we used the highly sensitive egg-infectious dose assay. Consistent with previous studies, we did not detect any infectious virus particles in the brains of H1N1-infected mice, whereas infectious particles were found in different regions of the brain (mesencephalon, thalamus, medulla oblongata, cerebellum, cortex, OB, and hippocampus) after H7N7 infection. In the brains of H3N2-infected mice, no or only very low amounts of infectious virus particles could be detected, confirming that it is not able to replicate efficiently in the CNS (Fig. 1B).
To investigate in detail the pathological alterations caused by infections with the three viruses, histological sections of the brain were analyzed. In the brains of H7N7-infected mice, many cells stained positive for viral NP. Moderate infiltration of meningeal and perivascular immune cells (B cells, T cells, and macrophages) and several foci of gliosis (astrocytes and microglia) were also detected (Fig. 1C–F). However, no lesions and only few single NP-positive cells were observed after H3N2 infection (Fig. 1C,E,F). In the case of H1N1, we did not observe any pathological changes. Additional analysis of other organs by PCR and immunohistochemistry verified that H3N2 was detectable, but did not replicate in organs other than the lung.
IAV infection causes cognitive impairment
Because influenza infection can be accompanied by neurological symptoms (Ekstrand, 2012), we were interested in determining whether infection with different virus strains would affect mouse behavior in a virus-specific manner. We chose the well established Morris water maze task as a paradigm to investigate the long-term consequences of IAV infection influence on learning and spatial memory formation (Morris, 1984; Vorhees and Williams, 2006). Before the learning paradigm, general locomotor activity and exploratory behavior were tested in the open-field test to exclude that phenotypes observed in the water maze task would be purely attributable to hyperactivity in infected individuals. Neither control nor IAV-infected mice showed any sickness behavior or deficits in locomotors activity (Fig. 2A–D). Conversely, the outcome of the Morris water maze task can be influenced by anxiety; for example, when the animals avoid the open water part of the maze and rather show thigmotaxis behavior, staying close to the pool walls. We therefore tested for a potential increase in anxiety-related behavior at 30 and 120 dpi using the elevated plus maze test. Neither control nor infected mice revealed significantly elevated anxiety levels (Fig. 2E,F).

Long-term effect of IAV infection on general locomotion and willingness to explore in the open-field test and anxiety-like behavior in the elevated plus maze test. A, B, At 30 and 120 dpi, a total distance traveled [one-way ANOVA 30 dpi (n = 7–10): F(3,29) = 2.12, p = 0.11, and 120 dpi (n = 7–8): F(2,19) = 6.19, p = 0.08), average speed (one-way ANOVA - 30 dpi (n = 7–10): F(3,29) = 2.86, p = 0.054 and 120 dpi (n = 7–8): F(2,19) = 6.24, p = 0.08] and representative tracks of movement patterns of mice in an open-field box are presented. There was no significant difference between all tested groups. C, D, Activity percentage of mice in the periphery [one-way ANOVA 30 dpi (n = 7–10): F(3,29) = 2.15, p = 0.11 and 120 dpi (n = 7–8): F(2,19) = 2.73, p = 0.09] and center part [one-way ANOVA 30 dpi (n = 7–10): F(3,29) = 2.14, p = 0.11 and 120 dpi (n = 7–8): F(2,19) = 2.73, p = 0.09] of open-field arena and not show any significant changes. Therefore, no sickness behavior, locomotors deficiency or anxiety-like behavior was detectable in infected mice. E, F, Percentage of time spent in the open [one-way ANOVA 30 dpi (n = 7–10): F(3,29) = 3.80, p = 0.20 and 120 dpi (n = 7–8): F(2,19) = 1.00, p = 0.38), and closed arms (One-way ANOVA - 30 dpi (n = 7–10): F(3,29) = 1.61, p = 0.20 and 120 dpi (n = 7–8): F(2,19) = 0.18, p = 0.83] of elevated plus maze were similar in all groups tested at 30 and 120 dpi. Mice did not indicate elevated anxiety levels. Data are presented as mean ± SEM; ordinary one-way ANOVA of data and post hoc Bonferroni's multiple-comparisons test were performed.
To investigate the effects of IAV infection on cognitive function, training in the Morris water maze task was performed starting at 30 and 120 dpi (Figs. 3, 4, 5). During 8 d of acquisition training, the escape latency reduced significantly in control and in infected mice (Fig. 3A,B), thereby indicating that all groups showed hippocampus-dependent spatial learning and memory formation [repeated-measures one-way ANOVA: FControl-30dpi(7,49) = 11.21, p = 0.000 (n = 8), FH1N1-30dpi(7,63) = 12.99, p = 0.000 (n = 10), FH3N2-30dpi(7,42) = 9.50, p = 0.000 (n = 7), FH7N7-30dapi(7,49) = 7.19, p = 0.000 (n = 8), FControl-120dpi(7,42) = 18.11, p = 0.000 (n = 7), FH3N2-120dpi(7,42) = 5.61, p = 0.000 (n = 7), and FH7N7-120dpi(7,49) = 10.11, p = 0.000 (n = 8)]. However, the escape latency in H7N7-infected mice at 30 dpi was significantly increased compared with control, non-neurotropic H1N1- and H3N2 IAV-infected mice (Fig. 3A), pointing out an impairment in memory formation after infection with this neurotropic virus (two-way ANOVA FTreatment(3,1024) = 57.85, p < 0.0001, both factors fixed). Three months later, at 120 dpi, analysis of the escape latency in control and IAV-infected mice during the training did not reveal any significant differences (two-way ANOVA FTreatment(2,680) = 0.35, p = 0.70, both factors fixed; Fig. 3B). To assess memory retrieval, reference memory tests (probe trials) were performed at days 3, 6, and 9 of the training phase (Fig. 3C,D). The results revealed that the percentage of time spent in the target quadrant by H1N1 and H3N2-infected mice at 30 dpi increased over the training time similar to control mice (one-way ANOVA: FDay3(2,22) = 2.48, p = 0.10; FDay6(2,22) = 1.04, p = 0.37; and FDay9(2,22) = 3.23, p = 0.058). H7N7-infected mice showed an impairment in memory retrieval indicated by a significantly reduced preference for the target quadrant on day 6 and 9 compared with the other groups tested (one-way ANOVA: FDay3(3,29) = 3.22, p = 0.03; FDay6(3,29) = 5.78, p = 0.003; and FDay9(3,29) = 3.91, p = 0.01; Fig. 3C). At 120 dpi, the quadrant preference was comparable between all groups regardless of the previous infection (FDay3(2,19) = 0.27, p = 0.76; FDay6(2,19) = 1.38, p = 0.274; FDay9(2,19) = 0.20, p = 0.81; Fig. 3D).

Long-term effect of IAV infection on hippocampus-dependent spatial learning. A, During 8 d of acquisition training, the escape latency reduced significantly in each group of control and infected mice, at 30 dpi, the escape latency in H7N7-infected mice was significantly increased compared with control and non-neurotropic H1N1- and H3N2-infected mice. B, At 120 dpi, the escape latency in all control and IAV-infected mice did not reveal any significant differences. One single probe trial was performed after day 3, 6, and 9 of the training period. C, Percentage of time spent in the target quadrant (NE) by H1N1- and H3N2-infected mice at 30 dpi was increased similarly to control mice, whereas H7N7-infected mice showed a significantly reduce target quadrant preference on day 6 and 9 compared with the other groups tested. D, Quadrant preference during the probe trials 120 dpi was similar in all groups. Data are presented as mean ± SEM (n = 7–10), one-way and two-way ANOVA of data and post hoc Bonferroni's multiple-comparisons test were performed. *p < 0.05 and ***p < 0.001 compared with control. ++p < 0.01 and +++p < 0.001 compared with H1N1; ∧p < 0.05, ∧∧p < 0.01, and ∧∧∧p < 0.001 compared with H3N2.

Analysis of learning strategies reveals a spatial learning impairment for both neurotropic and non-neurotropic virus subtypes. With regard to the different searching strategies to locate the hidden platform during the acquisition phase of the Morris water maze experiment, hippocampus-independent searching strategies including random swimming, chaining, and scanning decreased over time, whereas the hippocampus-dependent strategy-directed search increased. The searching strategies (directed search, chaining, scanning, and random swimming) were color coded and the relative contribution of the respective strategy is presented for each day of the Morris water maze task. A, Hippocampus-dependent strategy was decreased after H7N7 infection compared with the other groups and H3N2-infected mice showed a reduction in the usage of direct search at 30 dpi. B, No significant differences in searching strategies between IAV-infected and control mice were observed at 120 dpi. Data are presented as mean ± SEM (n = 7–10), two-way ANOVA of data and post hoc Bonferroni's multiple-comparisons test were performed. *p < 0.05 and **p < 0.01 compared with control; +p < 0.05 compared with H1N1.

Infection with neurotropic and non-neurotropic virus subtypes impairs memory formation for a new platform position. A, During 3 d of training, the escape latency to a new position of the hidden platform (SW) decreased significantly in control, H1N1-infected, and H7N7-infected mice over days, however, not in H3N2-infected mice. H7N7-infected mice had a significantly elevated escape latency compared with control and H1N1-infected mice. B, At 120 dpi, the IAV-infected group did not show any significant differences in the escape latency compared with the control. A single probe trial test 24 h after the last day of reversal training was performed. C, Only control and H1N1-infected mice spent significantly more time in the new target quadrant (T) in comparison with the average time spent in nontarget quadrants (NT). D, All tested groups spent more time in T compared with NT at 120 dpi. Data are presented as mean ± SEM (n = 7–10). In A and B, repeated-measures one-way and two-way ANOVA of data and post hoc Bonferroni's multiple-comparisons test were used; in C and D, unpaired t test was used. **p < 0.01 compared with control; +p < 0.05 and +++p < 0.001 compared with H1N1; #p < 0.05, ##p < 0.01, and ###p < 0.001 compared with NT.
A detailed analysis of the swimming path allows for a qualitative assessment of learning in mice (Fig. 4). All groups of control and IAV-infected mice showed an augmentation of hippocampus-dependent searching during the training. However, this progression was clearly decreased for IAV H3N2- and H7N7-infected animals 30 dpi (day 4: control: 40.62 ± 8.09%; H1N1: 42.50 ± 8.37%; H3N2: 21.42 ± 6.52%; and H7N7: 18.75 ± 4.09%; two-way ANOVA FTreatment(3,232) = 11.29, p < 0.0001, both factors fixed; Fig. 4A). No significant differences in the relative percentage of strategies used between IAV-infected and control mice were observed during the training at 120 dpi (two-way ANOVA FTreatment(2,152) = 1.32, p = 0.26, both factors fixed; Fig. 4B).
In the reversal Morris water maze paradigm, which is dependent on cognitive flexibility, the hidden platform was moved to the opposite quadrant (SW) (Fig. 5). During 3 d of training, the escape latency to the new platform position decreased significantly in control (repeated-measures one-way ANOVA FControl-30dpi-R(2,14) = 16.15, p = 0.000), H1N1-infected (FH1N1-30dpi-R(2,18) = 42.28, p = 0.000), and H7N7-infected (FH7N7-30dpi-R(2,14) = 8.75, p = 0.003) mice, but not in H3N2-infected mice, at 30 dpi (FH3N2-30dpi-R(2,12) = 2.59, p = 0.08, Fig. 5A). H7N7-infected mice showed a significantly increased escape latency compared with control and H1N1-infected mice. Therefore, both the H3N2 and H7N7 viruses led to a reduced ability to memorize the new location of the hidden platform 30 dpi (two-way ANOVA FTreatment(3,384) = 9.30, p < 0.0001, both factors fixed; Fig. 5A). IAV-infected mice tested at 120 dpi revealed no significant differences in escape latency compared with control animals (two-way ANOVA FTreatment(2,255) = 2.85, p = 0.059, both factors fixed; Fig. 5B). Subsequently, a single probe trial 24 h after the last day of reversal training was performed (Fig. 5C,D). At 30 dpi, both control and H1N1-infected mice spent significantly more time in the new target quadrant (T) in comparison with the average time spent in nontarget quadrants (control: unpaired t test p < 0.0001, df = 30 and H1N1: unpaired t test p < 0.0001, df = 38), whereas H3N2-infected (unpaired t test p = 0.062, df = 26) and H7N7-infected (unpaired t test p = 0.79, df = 30) animals showed no preference for the new target quadrant (Fig. 5C). No differences between tested groups were detected at 120 dpi (control: unpaired t test p = 0.004, df = 26, H3N2: unpaired t test p < 0.0001, df = 26, H7N7: unpaired t test p = 0.048, df = 30; Fig. 5D).
IAV infection leads to long-term alterations in the function and morphology of hippocampal neurons
Given the observed impairment in cognitive function after H3N2 and H7N7 influenza infection, we were interested in determining whether hippocampal network function would be compromised on a long-term timescale by the IAV infection. For this purpose, we analyzed synaptic plasticity at the Schaffer collateral pathway connecting the CA3 with the CA1 subfield, one of the most extensively studied synapses in the CNS (Fig. 6). First, the dependence of the fEPSP slope on stimulation intensity was assessed from input–output curves. Similar input–output relations of CA1 neurons in hippocampal slices from control and IAV-infected mice were found for both time points after infection (two-way ANOVA F30dpi(2,27) = 2.53, p = 0.09, and F120dpi(2,27) = 0.40, p = 0.66, both factors fixed, number of brain slices in each group = 10; Fig. 6A). In addition, the potential effects of IAV infection on short-term synaptic potentiation of CA1 neurons were investigated at 30 and 120 dpi (Fig. 6B). IAV infection did not alter PPF because fEPSP2/fEPSP1 in hippocampal slices at 30 and 120 dpi were not significantly different between control and infected animals (two-way ANOVA F30dpi(2,30) = 0.06, p = 0.93, and F120dpi(2,28) = 1.48, p = 0.24, both factors fixed, number of brain slices in each group = 9–11; Fig. 6B). These results indicate that basal synaptic transmission at individual synapses and short-term synaptic plasticity in the CA1 region were not affected by IAV infection.

Long-term effect of IAV infection on the function of CA1 hippocampal neurons. A, Input–output curves of fEPSP slopes in hippocampal slices (n = 10) of control and infected mice at 30 and 120 dpi do not show any significant differences between groups. B, PPF of fEPSP slopes depicted as response to the second stimulation over the first at different interpulse intervals (10, 20, 40, 60, 80, and 100 ms) in hippocampal slices (n = 9–11) do not show any differences between the groups at 30 and 120 dpi. C, Hippocampal slices from H7N7-infected mice (n = 15) exhibit significantly lower induction and maintenance of LTP compared with control, whereas H3N2-infected mice (n = 13) showed a reduced maintenance of LTP compared with control (n = 17) at 30 dpi. D, At the induction phase of LTP (T 20–25), only hippocampal slices from H7N7-infected mice had a significantly reduced LTP; however, at the stable phase of LTP (T 75–80), both groups of slices from H3N2 and H7N7 influenza virus-infected mice revealed a significant reduction in LTP compared with control hippocampal slices. E, F, At 120 dpi, the induction and maintenance phases of LTP did not show any differences in control and infected groups (n = 11–15). Data are presented as mean ± SEM (n = 4–5). In A, B, C, and E, two-way ANOVA was used; in D and F, one-way ANOVA and post hoc Bonferroni's multiple-comparisons test were used. *p < 0.05 and **p < 0.01 compared with control; ∧p < 0.05 compared with H3N2. N, Number of mice; n, number of hippocampal slices in each group.
In addition, long-term synaptic plasticity was investigated. LTP at the Schaffer collateral CA3 to CA1 pathway was induced by TBS after 20 min of baseline recording (Fig. 6C–F). At 30 dpi, the induction phase of LTP (T 0–5 min after TBS) was significantly reduced only in hippocampal slices derived from H7N7-infected mice (one-way ANOVA F(2,42) = 3.92, p = 0.02, number of brain slices in each group = 13–17). However, the stable phase of LTP (T 55–60 min after TBS) was significantly decreased in both slices from H3N2- and H7N7-infected mice, thereby revealing a significant impairment in synaptic plasticity compared with control hippocampal slices (one-way ANOVA F(2,42) = 5.74, p = 0.006; Fig. 6C,D). At 120 dpi, the induction (one-way ANOVA F(2,35) = 0.30, p = 0.74, number of brain slices in each group = 11–15) and maintenance phase of LTP in both H3N2 and H7N7 were comparable to control slices (one-way ANOVA F(2,35) = 0.84, p = 0.43; Fig. 6E,F).
As a next step to investigate the potential cellular basis underlying the reduction in LTP and memory impairment, hippocampal neuronal morphology was analyzed at 30, 60, and 120 dpi (Fig. 7). Spines are tiny, dendritic protrusions that carry the majority of excitatory synapses in the hippocampus and changes in spine density can provide information about alterations in the connectivity of hippocampal subregions. Spines were therefore counted separately on apical dendrites of CA1 and CA3 pyramidal neurons and on dentate granule cells located in the superior and inferior blade of the granule cell layer in the hippocampus (Fig. 7A). A significant reduction in dendritic spine density was found in H3N2-infected (CA1: Δ17.08%, CA3: Δ19.24%) and H7N7-infected (CA1: Δ22.13%, CA3: Δ15.02%) mice 30 dpi, whereas H1N1 infection had no significant effect compared with control (CA1: Δ2.28%, CA3: Δ3.46%) (one-way ANOVA FCA1(3,186) = 18.97, p < 0.0001, and FCA3(3,196) = 16.40, p < 0.0001; Fig. 7A–C). The extent of the phenotype differed between the hippocampal subregions as both in the superior and inferior DG; only infection with H7N7 IAV led to a significant reduction in dendritic spine density (DG-superior: Δ17.08%, DG-inferior: Δ21.95%) (one-way ANOVA FDG-superior(3,186) = 18.15, p < 0.0001, and FDG-inferior(3,184) = 33.65, p < 0.0001; Fig. 7D,E). Further assessment of H3N2- and H7N7-infected animals showeda partial recovery of the reduced spine density at 60 dpi predominantly for the DG and CA3 subregions and more pronounced for H3N2-infected animals (CA1: H3N2, Δ10.59%; H7N7, Δ15.16%; CA3: H3N2, Δ7.12%; H7N7, Δ15.66%; DG-superior: H7N7, Δ3.78%; DG-inferior: H7N7, Δ4.88%; Fig. 7B–E). At 120 dpi, spine density in H7N7- and H3N2-infected mice was indistinguishable from control animals in all subregions of the hippocampus (p < 0.0001 vs 30 dpi; Fig. 7B–E).

Long-term effect of IAV infection on dendritic spine density of hippocampal neurons. A, Representative images of Golgi-stained hippocampus sections. Scale bars, 200 μm, 2.5× hippocampal neurons; 20 μm, 20× and dendritic spines in hippocampal CA1 apical neurons after infection with IAV; 2 μm, 63×. B–E, After infection with H3N2 and H7N7 IAV, the spine density of apical dendrites of CA1 (B) and CA3 (C) hippocampal neurons decreased at 30 dpi; only H7N7 IAV infection reduced dendritic spine density of dentate granule cells located in the superior (D) and inferior (E) blade of the granule cell layer. At 60 dpi, a partial recovery occurred in the DG and CA3 hippocampal subregions of infected animals and, at 120 dpi, the dendritic spine density fully recovered in all regions of the hippocampus. Data are presented as mean ± SEM (n = 4–5 and number of dendrites in each group = 40–50), one-way ANOVA of data and post hoc Bonferroni's multiple-comparisons test were performed. *p < 0.05 and ***p < 0.001 compared with control; ##p < 0.01 and ###p < 0.001 compared with 30 dpi time point.
IAV infection enhances glial cell density and activation status within the hippocampus
Because processes of prolonged neuroinflammation after IAV infection might be the underlying cause for the alterations observed in this study ranging from single synapses to neuronal plasticity and eventually affecting mouse behavior, the effects of IAV on microglia density and activation status in the hippocampus were analyzed. For this purpose, IBA-1 staining was performed (Fig. 8A–C). IBA-1-positive cells were counted and analyzed separately in the CA1, CA3, and DG superior and inferior blade of the granule cell layer in the hippocampus. Whereas microglia density was not affected 30 dpi with H1N1 (CA1: Δ4.55%, CA3: Δ7.67%), microglia density in the CA3 region (Δ30.25%) and inferior blade of the DG (Δ27.40%) was increased after H3N2 infection (Fig. 8B). The neurotropic H7N7 IAV infection induced a robust increase in microglia density for all hippocampal subfields analyzed (CA1: Δ24.67%, CA3: 32.08%, DG-superior: 49.18%, DG-inferior: 55.96%) (one-way ANOVA FCA1(3,76) = 5.13, p = 0.002, FCA3(3,76) = 9.90, p < 0.0001, FDG-superior(3,76) = 17.57, p < 0.0001, and FDG-inferior(3,76) = 22.16, p < 0.0001; Fig. 8B).

Long-term effect of IAV infection on glial cell density and activation status within the hippocampal subregions. A, Representative examples of IBA-1 immunostaining at 30 dpi. Scale bar, 100 μm. Inserts, Higher magnifications of the respective images. Scale bar, 10 μm. B, After infection with H3N2 IAV, microglia density in the CA3 region and inferior blade of the DG was increased significantly, whereas the neurotropic H7N7 IAV infection induced an increased microglia density in all hippocampal subregions at 30 dpi. At 60 dpi, a partial recovery occurred in the CA3 and DG regions of infected mice and, at 120 dpi, microglia density was fully recovered in all subregions of the hippocampus (n = 4 and number of ROIs in each group = 20). The activation status of microglia was assessed by counting the number of primary processes. C, After infection with H3N2 and H7N7 IAV, the number of primary processes of microglia in all subregions of the hippocampus decreased at 30 dpi, however, upon H7N7 infection, the strongest reduction became visible in the superior and inferior blade of the granule cell layer. Conversely, at 60 dpi, a partial recovery occurred in the CA3 and DG regions of infected mice and, at 120 dpi, microglia activation status was fully recovered in all subregions of the hippocampus (n = 4 and number of selected microglia in each group = 120–200). D, Representative examples of GFAP immunostaining at 30 dpi. Scale bar, 50 μm. Inserts, Higher magnifications of the respective images. Scale bar, 10 μm. E, Astrocyte density in all hippocampal subregions was increased at 30 dpi with H7N7 IAV, whereas only CA1 and CA3 were affected after H3N2 IAV infection. Interestingly, at 60 dpi and 120 dpi, a reduction of GFAP-positive cells to the level of controls was observed (n = 2–4 and number of ROIs in each group = 5–20). Data are presented as mean ± SEM, one-way ANOVA of data and post hoc Bonferroni's multiple-comparisons test were performed. *p < 0.05 and ***p < 0.001 compared with control; ∧∧∧p < 0.001 compared with H3N2; #p < 0.05, ## p < 0.01, and ### p < 0.001 compared with the 30 dpi time point.
To determine the activation status of microglia cells in infected individuals compared with control animals, the number of primary processes per cell was quantified (Fig. 8C). For both the H3N2 and H7N7 virus types, the number of primary processes per cell decreased in all subregions of the hippocampus 30 dpi (one-way ANOVA FCA1(3,636) = 178.90, p < 0.0001, FCA3(3,701) = 259.00, p < 0.0001, FDG-superior(3,706) = 155.5, p < 0.0001, and FDG-inferior(3,641) = 203.20, p < 0.0001; Fig. 8C), indicating increased activation levels. The strongest reduction was found in the superior and inferior blade of the DG upon H7N7 infection (p < 0.001 vs control and H3N2-infected mice). A partial recovery of microglia density (CA3: H3N2, Δ4.80% and H7N7, Δ12.32%; DG-superior: H7N7, Δ18.14%; DG-inferior: H3N2, Δ10.30%; H7N7, Δ24.27%; Fig. 8B) and activation status occurred in the DG and CA3 subregions at 60 dpi, especially in H3N2-infected animals (Fig. 8C). At 120 dpi, microglia cell density and activation status in infected mice were comparable to control levels (p < 0.001 vs 30 dpi; Fig. 8B,C).
In addition to the effect of IAV infection on microglia, we investigated the density of astrocytes in hippocampal subregions using GFAP staining (Fig. 8D,E). Astrocyte density in all subregions of the hippocampus was increased 30 d after infection with H7N7 (CA1: Δ44.87%, CA3: Δ45.78%, DG-superior: Δ14.90%, DG-inferior: Δ22.60%), whereas only the CA1 (Δ29.47%) and CA3 (Δ29.29%) subregion were affected in H3N2-infected animals (Fig. 8E). As was the case for spine density and microglia, H1N1 did not affect astrocyte number in the hippocampus (CA1: Δ2.73%, CA3: Δ−7.42%) (one-way ANOVA FCA1(3,36) = 16.07, p < 0.0001, FCA3(3,36) = 14.10, p < 0.0001; FDG-superior(3,35) = 3.31, p = 0.03; and FDG-inferior(3,36) = 3.31, p = 0.03; Fig. 8E). As was the case for microglia, on the level of astrocytes, a partial and a full recovery comparable to control numbers could be found at 60 dpi (H7N7: CA1, Δ8.19%; CA3, Δ−7.45%; DG-superior, Δ−7.42%; DG-inferior, Δ−1.80%) and 120 dpi, respectively (p < 0.05 vs 30 dpi; Fig. 8E).
IAV infection increases BBB permeability and cytokine level
As a next step, we examined the integrity of the BBB after H3N2 and H7N7 infection (Fig. 9). For this purpose, animals were injected with 2% (w/v) Evans blue intraperitoneally at 4, 8, and 10 dpi. The results of spectrophotometry showed that, upon infection with H3N2 and H7N7 IAV, an increased Evans blue absorbance and therefore a compromised BBB could be detected on 8 dpi with H3N2 and H7N7 (one-way ANOVA F(2,19) = 8.67, p = 0.002, Fig. 9A). At 10 dpi, only H7N7-infected mice showed an Evans blue staining visible already macroscopically in the brain, whereas in the CNS of H3N2-infected mice, it was only weakly visible around the ventricles (Fig. 9B).

Effect of IAV infection on BBB permeability and cytokine level. A, Injection of Evans blue dye for assessment of the BBB integrity upon infection with H3N2 and H7N7 IAV showed an increased Evans blue absorbance on 8 dpi in both H3N2- and H7N7-infected mice (n = 3–4 and number of samples in each group = 6–8). B, On 10 dpi, Evans blue dye was well visible macroscopically only in H7N7-infected mice, whereas in H3N2-infected mice, it was only weakly visible around the ventricle (black arrow). C–H, Levels of IFN-γ and TNF-α were significantly elevated in the blood serum, brain, and hippocampus of H7N7-infected mice. H, H1N1 and H3N2 non-neurotropic IAV infection led to significantly increased TNF-α level within the hippocampus of infected mice (n = 2–4 and number of samples in each group = 3–8). Data are presented as mean ± SEM, one-way ANOVA of data and post hoc Bonferroni's multiple-comparisons test were performed. *p < 0.05, **p < 0.01, and ***p < 0.001 compared with control.
We were furthermore interested whether the cytokine level would be increased as well in the periphery and especially also in the CNS. Therefore, TNF-α and IFN-γ levels were assessed in the periphery and the CNS via ELISA at 8 dpi (Fig. 9C–H). An earlier study suggested that IFNs and TNF-α have a significant role in priming immune cells for higher cytokine and chemokine production during IAV infection (Veckman et al., 2006). Cytokine levels were quantified in the blood serum, CNS in general, and hippocampus of IAV-infected mice. Our data revealed that the levels of IFN-γ and TNF-α were significantly elevated in the all three areas in H7N7-infected mice (Fig. 9C–H). Interestingly, infection with the two non-neurotropic influenza virus subtypes also led to significantly increased levels of TNF-α in the hippocampus of infected mice compared with control (IFN-γ: one-way ANOVA FSerum(3,10) = 22.37, p < 0.0001, FBrain(3,24) = 14.96, p < 0.0001, FHippocampus(3,23) = 9.76, p = 0.0002, and TNF-α: one-way ANOVA FSerum(3,10) = 5.49, p = 0.017, FBrain(3,26) = 5.07, p = 0.006, FHippocampus(3,22) = 9.67, p = 0.0003; Fig. 9H).
IAV infection affects gene expression differentially in the hippocampus
We performed whole genome expression analysis at 18 and 30 dpi to study changes in gene expression in the hippocampus after IAV infection. Because we did not detect long-term alterations in brain morphology, function, or cognitive behavior after H1N1 infection, we performed these studies only in H3N2- and H7N7-infected mice. Furthermore, we focused our analysis on the hippocampus, where we described functional and morphological alterations (see above). Mock-infected mice (PBS), killed at the same days after treatment, were used as controls. We identified 487 differentially expressed probe sets (DEPs) in the hippocampus of animals at 18 dpi with H3N2 virus compared with mock-treated animals. However, no DEPs were found at 30 d after H3N2 infection. After infection with H7N7, 174 DEPs were observed at 18 dpi and also 250 DEPs at 30 dpi compared with mock controls (Fig. 10A). Most of the H3N2-induced differentially expressed genes (DEGs, 342) did not overlap with H7N7-induced DEGs, indicating a virus-specific response in the hippocampus (Fig. 10B).

Whole genome microarray analysis from hippocampus of influenza-infected mice at 18 and 30 dpi. DEPs were identified based on an adjusted p-value of < 0.1 and exhibiting more than a 1.4-fold (log2 of 0.5) difference in expression levels. A, At 18 dpi, 487 and 174 DEPs were detected in the hippocampus of H3N2- and H7N7-infected mice respectively. However, at 30 dpi, DEPs (250) were only found in H7N7-infected mice. B, Overlap of differentially expressed genes (DEGs) that are represented by the DEPs is presented as Venn diagram. C, KEGG pathway analysis of DEGs after H3N2 and H7N7 IAV infection revealed significant pathways involved in local immune responses and cell adhesion molecules in the hippocampus of H3N2- and H7N7-infected mice at 18 dpi, which are more pronounced and continued until 30 dpi for H7N7 IAV infection. The diameter of the dots indicates the gene ratio; range of 0.05 (smallest dot) to 0.20 (biggest dot), colors show significance of DEG representation for each pathway. D, Relative changes (with reference to mock-infected mice) in expression levels of microglia signature and activation genes in the hippocampus after IAV infection. Data are presented as LogFC (fold change) mean in each groups compared with control group (n = 3–4 ad independent biological replicates). p-value is adjusted using Benjamini–Hochberg correction for multiple testing.
Kyoto Encyclopedia of Genes and Genomes (KEGG) pathway analysis of DEGs revealed a significant induction of immune responses and inflammatory processes at 18 d after H7N7 IAV infection, which continued until 30 dpi, and at 18 d after H3N2 IAV infection (Fig. 10C). In particular, genes involved in antigen processing and presentation were found to be among the most strongly upregulated genes after H3N2 and H7N7 IAV infection, indicating activation of an immune response in the CNS. Furthermore, KEGG analysis of DEGs in both H3N2- and H7N7-infected mice compared with mock-infected controls (Fig. 10C) revealed DEGs belonging to cell adhesion molecule (CAM) pathways that play a critical role in a wide array of biological processes including hemostasis, the immune response, inflammation, and development of neuronal tissue (Joseph-Silverstein and Silverstein, 1998). Moreover, cell–cell adhesions are important for synaptic function (Bailey et al., 2015).
Our analysis also revealed a significant adverse regulation of microglia-related genes after IAV infection. For instance, an increased expression of microglia signature genes such as Olfml3 (H3N2: t = 3.60, p = 0.04 and H7N7: t = 5.42, p = 0.03) and Tmem119 (H3N2: t = 2.49, p = 0.1 and H7N7: t = 3.44, p = 0.09) and downregulation of the microglia-neuron crosstalk gene (Cx3cr1) (H3N2: t = −4.39, p = 0.02 and H7N7: t = −2.04, p = 0.1) were observed after both H3N2 and H7N7 IAV infection (Fig. 10D). Furthermore, the analysis of genes reflecting microglia activation and in particular the major histocompatibility class 2 family (MHCII) family (antigen processing and presentation), microglial-mediated phagocytosis (Fcgr4, Dap12 and Ctsz) (Fcgr4: t = 4.68, p = 0.05, Dap12: 4.54, p = 0.05 and Ctsz: t = 4.73, p = 0.04), and complement system genes (C1qa, C1qb, C1qc, and Vwf) (C1qa: t = 6.31, p = 0.03, C1qb: 5.16, p = 0.04, C1qc: t = 3.28, p = 0.1, and Vwf: t = 4.27, p = 0.06), revealed a significant upregulation especially in the group of H7N7-infected animals (Fig. 10D). In addition to microglia, an increased expression of astrocyte signature and activation genes such as Gfap (H3N2: t = 2.94, p = 0.08, and H7N7: t = 3.16, p = 0.1) and Psmb8 (H3N2: t = 3.65, p = 0.04, and H7N7: t = 4.44, p = 0.05) (Table 1) was observed in the hippocampus of H3N2- and H7N7-infected mice.
Relative changes in expression levels of candidate genes in the hippocampus of IAV-infected mice
Rbfox3 (NeuN) (H3N2: t = −4.07, p = 0.03 and H7N7: t = −3.94, p = 0.07), Nrcam (neuronal cell adhesion molecule) (H3N2: t = −5.99, p = 0.01 and H7N7: t = −4.98, p = 0.04), and Cacna1c (voltage-dependent calcium channel) (H3N2: t = −3.75, p = 0.04 and H7N7: t = −6.61, p = 0.03) were diminished similarly in the H3N2- and H7N7-infected groups at 18 dpi (Table 1). Dysfunction of these genes has been identified in several neurodevelopmental and neuropsychiatric disorders such as autism, schizophrenia, and cognitive impairments (Demyanenko et al., 2014; Lee et al., 2016; Lin et al., 2016). In addition, Rbfox3 knock-out mice show deficits in synaptic transmission and plasticity in the DG (Wang et al., 2015). Moreover, downregulation of the neurotrophic factors Bdnf (H3N2: t = −3.52, p = 0.05 and H7N7: t = −3.66, p = 0.08) and Ntf3 (H3N2: t = −6.88, p = 0.009 and H7N7: t = −3.91, p = 0.07) and a number of important solute carriers such as Slc4a7 (bicarbonate cotransporter, H3N2: t = −4.87, p = 0.02, and H7N7: t = −5.03, p = 0.04), Slc30a5 (zinc transporter, H3N2: t = −4.78, p = 0.02, and H7N7: t = −3.56, p = 0.09), Slc2a1 (glucose transporter, GLUT-1, H3N2: t = −3.27, p = 0.06 and H7N7: t = −3.69, p = 0.08) and Slc1a2 (glutamate transporter, H3N2: t = −4.70, p = 0.02 and H7N7: t = −3.43, p = 0.05), and synapse-associated protein genes including Grm5 (glutamate receptor, H3N2: t = −3.87, p = 0.03, and H7N7: t = −2.49, p = 0.1) and Dlg3 (SAP102, H3N2: t = −4.79, p = 0.02, and H7N7: t = −3.67, p = 0.08) were observed regardless of the virus subtype (Table 1). It is known that SAP102-null mice exhibit impaired spatial learning along with defects in synaptic plasticity (Cuthbert et al., 2007). It is also worth noting that after both H3N2 and H7N7 IAV infection, upregulation of interferon-response related genes including Psmb9 (H3N2: t = 3.04, p = 0.08 and H7N7: t = 4.62, p = 0.05), Lgals3bp (H3N2: t = 3.67, p = 0.04 and H7N7: t = 4.51, p = 0.05), Oas2 (H3N2: t = 6.24, p = 0.01 and H7N7: t = 5.28, p = 0.04), and especially Ccl5 (H3N2: t = 4.46, p = 0.02 and H7N7: t = 3.93, p = 0.07) were observed; the latter has been associated previously with cognitive decline (Laurent et al., 2017) (Table 1).
Discussion
Influenza is primarily considered as a respiratory disease. However, evidence accumulates that an infection with IAV may also be associated with neurological complications in humans (Surana et al., 2011; Ekstrand, 2012; Shah et al., 2014). Because influenza viruses can be either neurotropic or non-neurotropic, it is important to discriminate between alterations mediated directly by the fact that the virus is actually able to replicate in the brain and, conversely, CNS complications as a result of the host immune response in the periphery. Here, we investigated the long-term neurological impact of an infection with either neurotropic or non-neurotropic IAV subtypes. The long-lasting consequences of an influenza infection on the brain have not been studied before. Our findings provide evidence that neuroinflammation caused by non-neurotropic and neurotropic influenza viruses induces long-lasting impairments in hippocampal neuronal morphology and synaptic properties and cognitive function in adult animals.
A comparison of the two non-neurotropic viruses, H1N1 and H3N2, revealed that infection with H1N1 did not lead to any long-term alterations in spatial memory formation and neuron morphology. In a previous study, H1N1-infected mice showed impairment in the reversal task in the Morris water maze, suggesting influenza-induced cognitive deficits during the acute phase of the infection (Jurgens et al., 2012). Although our results showed that recovery from the infection with this variant seems to be fast, the infection with the non-neurotropic H3N2 subtype and neurotropic H7N7 caused long-lasting cognitive deficits in infected animals. We therefore concentrated on a detailed comparison between infection with H3N2, which is not able to replicate in the brain, and H7N7, in which we indeed could detect replicating virus in the CNS.
Infection with both virus subtypes led to a compromised BBB 8 dpi. This is consistent with an elevation of cytokine levels in the CNS detected here. Although the concentration of IFN-γ and TNF-α was highest in the case of H7N7 infection both in the serum and in the CNS, infection with H3N2 also led to significantly elevated levels of TNF-α in the hippocampus. Indeed, several studies indicate that, after different types of infection in the periphery or the brain, an increased inflammatory gene expression (e.g., IL-1β, IL-6, TNF-α, and IFN-γ) can be observed across multiple brain regions, including the hippocampus (Howe et al., 2012; Elmore et al., 2014; Heneka et al., 2014; Klein et al., 2017). The cytokines generated during peripheral inflammation can activate a secondary, mirror inflammatory response (indirect, immune response-mediated pathways) in the brain that is characterized by activation of microglia and production of proinflammatory cytokines, most importantly, TNF-α, IL-1, and IL-6 (Riazi et al., 2015). Indeed, we were able to detect an increase in the number of microglia in the hippocampus of H3N2- and H7N7-infected mice that could at least in part be attributable to the leaky BBB after influenza infection. Although activated microglia are crucial for the host defense against pathogens, prolonged or aberrant activation can have damaging effects on neurons and can adversely affect synaptic transmission and structure (Hanisch, 2002; Block et al., 2007; Pickering and O'Connor, 2007; Riazi et al., 2015). It was shown previously that microglia can also play a role in synaptic remodeling and plasticity in the healthy brain (Nimmerjahn et al., 2005; Parkhurst et al., 2013), for example, via neuron–microglia crosstalk through the Cx3cr1 signaling axis, which we found to be downregulated independently of the virus subtype. The observed long-term alterations in spine number, synaptic plasticity, and cognitive function after IAV infection might therefore indeed result in part from a general virus-subtype-independent hyperactivation of microglia cells in the hippocampus triggered through the immune response to the influenza virus in the periphery. It was shown previously that proinflammatory mediators produced during the infection affected neuronal morphology, synaptic structure, and function (Yirmiya and Goshen, 2011; Estes and McAllister, 2015). In particular, chronic inflammation in vivo and exposure of cultured brain cells to lipopolysaccharide (LPS) in vitro led to a loss of spines reminiscent to changes found in many neurological diseases (Chang et al., 2015). Furthermore, manipulation of individual cytokines can modulate learning, memory formation, and synaptic plasticity (Marin and Kipnis, 2013; Donzis and Tronson, 2014). The increased production of inflammatory mediators from brain immune cells might indeed disrupt the delicate balance in the neuro–microglia crosstalk (Tanaka et al., 2006; Yirmiya and Goshen, 2011).
The number of astrocytes was increased as well after infection with neurotropic and non-neurotropic IAV subtypes. We detected a downregulation in the levels of the astrocyte-specific glutamate transporter Slc1a2, which plays an essential role in the maintenance of normal excitatory synaptic transmission, protection of neurons from the excitotoxicity of excessive glutamate, and regulation of glutamate-mediated neuroplasticity (David et al., 2009). Interestingly, in both H3N2- and H7N7-infected mice, elevated numbers of astrocytes recovered faster than the number and activation status of microglia cells, suggesting that an astrocyte–microglial interaction might be a key mechanism for the regulation of brain inflammation during influenza infection. Previous findings suggest that astrocytes can regulate microglial activity by stimulating their antioxidant gene expression, perhaps providing a negative feedback response to titrate the inflammatory reaction induced by proinflammatory mechanisms, thus modulating microglial resting status versus activation state (Shih et al., 2006).
In addition to the striking similarity of the phenotypes on the general level of glial cell and synapse number and the gene expression profiles after infection with non-neurotropic and neurotropic IAV subtypes pointing toward immune response-mediated indirect pathways, we were able to reveal also characteristic differences in the long-lasting outcome after infection with these two viruses. Infection with the neurotropic virus led to synapse loss in all three hippocampal subregions together with a robust impairment in spatial map formation, whereas H3N2 infection was associated with synapse loss only in the cornu ammonis region and a reduced ability to update the new platform position in the reversal phase, but almost normal learning in the initial water maze task. It was indeed shown previously that the progressive nature of neurotropic virus-induced damage in the dentate gyrus (DG), such as during Borna virus infection, is associated with impaired performance in the Morris water maze (Rubin et al., 1999). Moreover, there is evidence that the plain water maze task can be solved efficiently despite LTP impairments in either the CA1 or the CA3 region (Nakazawa et al., 2002; Bannerman et al., 2012). Our data therefore show that hippocampal subregions might indeed exhibit a different sensitivity to inflammation-induced damage, with the DG being more resilient. Moreover, our results indicate that the neuronal representation of behavioral flexibility to decide between competing memories in the reversal task may reside more in the CA1 and CA3 subfield than in the DG.
In case of the neurotropic virus H7N7, we observed a much stronger reaction that was consistent throughout all hippocampal subregions, including the DG. It is interesting that the interferon-responsive gene Ifit3, which is reported to be involved in cognitive decline in aged mice (Bordner et al., 2011), was specifically upregulated in the hippocampus of H7N7-infected mice and is mainly expressed in granule cells (Cho et al., 2013). This indicates that the direct presence of the virus in the brain leads to even more detrimental effects (direct, virus-mediated pathways). The gene expression profile analysis revealed that the increase in microglia activation markers was even stronger in H7N7-infected individuals compared with H3N2-infected mice. In particular, the levels of genes belonging to the MHC II were strongly increased, indicating direct contact of microglia and the IAV.
Evidence now accumulates that chronic neuroinflammation may be a central mechanism contributing to the generation and progression of a number of neuropsychiatric and neurodegenerative disorders including Alzheimer's disease (Frank-Cannon et al., 2009; Heneka et al., 2014). Interestingly, the dopamine neurotransmitter transporter gene Slc6a3, which has been associated with depression and other neuropsychiatric disorders (Sinanan and Hillary, 1981; Uddin et al., 2011), was among the most strongly upregulated genes especially after H7N7 infection.
Therefore, our findings have significant implications for the clinical consequences of IAV infections. An influenza infection with neurotropic viruses, but also infections with a non-neurotropic virus, can initiate inflammatory cascades via microglia and astrocyte activation in the brain and therefore increase the likelihood to develop neuropsychiatric and neurodegenerative disorders. The host immune response triggered by a lung infection with H3N2 was able to impair hippocampal function. More strikingly, replication of an influenza virus in the brain resulted in a stronger and more prolonged activation of microglia with detrimental outcome for cognitive functions. In our study, we only worked with younger animals. It will thus be important to study whether similar or even more pronounced impairments would be observed in aged mice and if the developing brains in newborn and juvenile individuals could also be affected. Approaches to regulate glial cell activity may provide a future strategy to prevent deleterious long-term effects on the brain, especially in highly vulnerable patient groups.
Footnotes
This work was supported by the Niedersachsen-Research Network on Neuroinfectiology (N-RENNT) of the Ministry of Science and Culture of Lower Saxony (K.S. and M.K.), the Deutsche Forschungsgemeinschaft Grant SFB854 (M.K.), and the Helmholtz-Association (Program Infection and Immunity Intramural Grants to KS). We thank Christin Kurch for excellent technical assistance and Marta Zagrebelsky and Ab Osterhaus for comments on the paper.
The authors declare no competing financial interests.
- Correspondence should be addressed to Dr. Martin Korte, Division of Cellular Neurobiology, Zoological Institute, TU Braunschweig, Spielmannstr 7, 38106 Braunschweig, Germany. m.korte{at}tu-bs.de


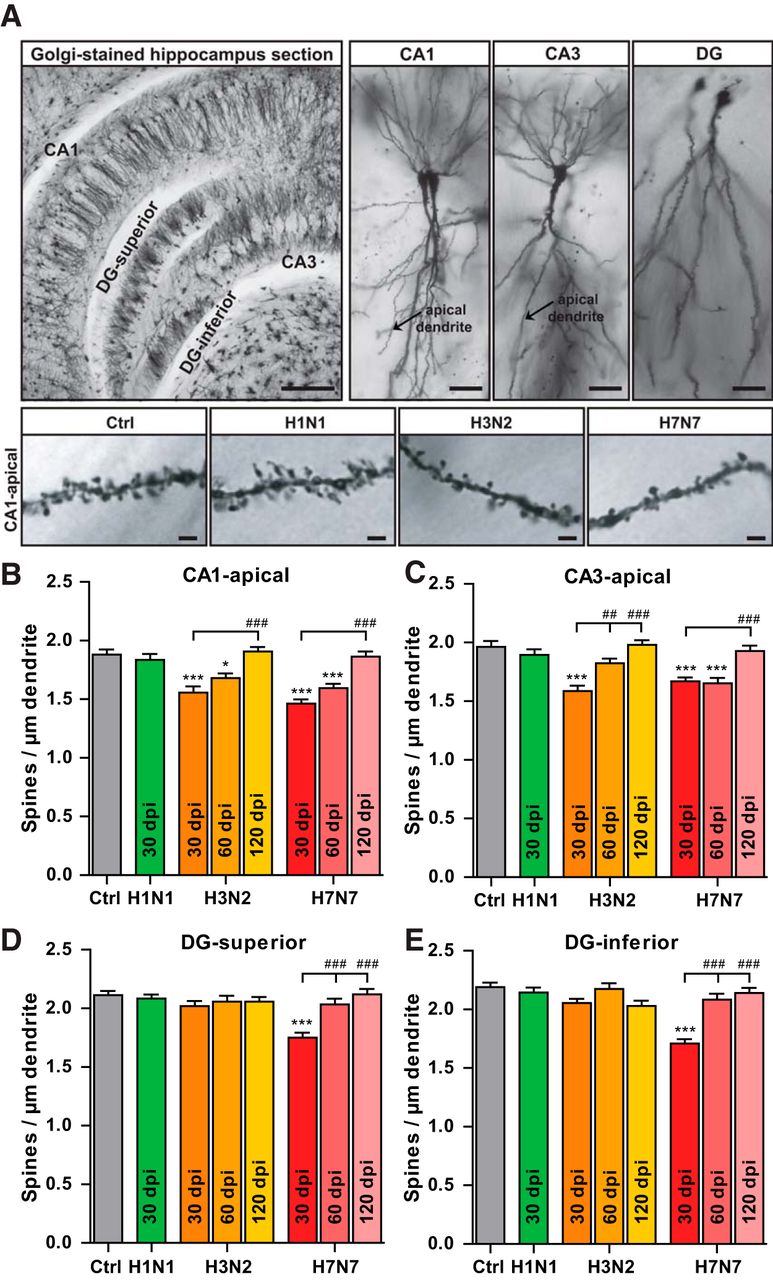