

Article Figures & Data
Figures
- Figure 1.
High-density surface EEG, intracortical and combined intracortical-surface recordings in awake epileptic animals. A, Mouse with 31 surface EEG electrodes during an awake recording session. B, Topography of electrodes over the mouse dorsal skull surface. C, Scheme of the multisite intracortical montage. The noninjected right hippocampus is highlighted in black. D, Illustration of a high-density surface recording combined with bihippocampal intracortical recording.
- Figure 2.
Illustrative cresyl violet and Luxol fast blue section of the brain showing the morphology of both hippocampi 28 d following intrahippocampal kainate injection in the left hippocampus. The pyramidal layer in the noninjected (a) and injected (b) hippocampi as well as the granule cells layer in the noninjected (c) and injected (d) hippocampi are magnified.
- Figure 3.
Large-scale structural analysis during the latent phase. A, Representative Fluoro-jade-stained sections at the level of the dorsal hippocampus 2 d after kainate injection. Fluoro-jade-labeled neurons are visible in the pyramidal layer of CA1 and CA3 and in the DG of the injected LH (right), whereas no labeled cells are observed in the contralateral noninjected RH (left). B, Representative Fluoro-jade-stained sections at the level of the dorsal hippocampus 2 d after kainate injection. Fluoro-jade staining is less strong than at D2 because the process of cell death has decreased 7 d after kainate injection. C, D, Fluoro-jade-stained sections at the level of the frontal motor cortex in the same animals as in A and B, respectively (i.e., at D2 and D7). No Fluoro-jade-labeled neurons are visible in the right and left frontal cortices. Similar observations were made in other neocortical regions in all kainate-injected animals animals at D2 and D7 (n = 6 at both ages).
- Figure 4.
Operational definition of paroxysmal HPDs. A, Example of a whole train of paroxysmal hippocampal discharges, reminiscent of an epileptic seizure, recorded with surface EEG, beginning around the green vertical line and lasting ∼41 s as indicated by the green dashed lines. Raw signals are shown from simultaneous recordings from an electrode located over the injected hippocampus (electrode e19, see Fig. 1, top, red) and an electrode over the contralateral noninjected hippocampus (electrode e5, see Fig. 1, black). Bottom, Corresponding time-frequency plots across the 0–550 Hz spectrum (top) and centered on the frequency of epileptic spikes (i.e., 0–60 Hz), which corresponds to the red square in the above time-frequency decomposition. Note the increased activity in the frequency band of epileptic spikes (15–30 Hz) and FRs (200–550 Hz). Right, Blue rectangle represents an expanded view of a 4 s period of the seizure to better illustrate its structure. Top, Red rectangles represent a 1 s magnification of the raw signal for both electrodes with 3 spikes and superimposed FRs (highlighted in red) visible on the injected hippocampus signal, while at the same time no spikes are observed on the noninjected hippocampus signal. Bottom, Expanded views for both electrodes at the onset of the paroxysmal discharges (5 s window, corresponding to the green rectangles on the traces); raw signal is presented above, the FRs range below. Green represents the first epileptic spikes over the injected hippocampus. Note the lack of ictal discharges (and a preserved theta-rhythm) over the noninjected hippocampus. Calibration: 0.1 mV. B, Intracerebral recording showing an example of a HPD that lasted 41 s in the injected hippocampus. Green line indicates onset. Discharges show clear phase inversions at the level of the molecular layer of the dentate gyrus (MoDG) in the injected hippocampus. No ictal discharges are seen in the opposite hippocampus recorded simultaneously. C, Illustrative example of a HPD recorded in the injected hippocampus that lasted 36 s. Blue rectangle represents the period of postictal suppression that follows. Time and voltage scale bars as in B. D, Example of a HPD recorded 4 weeks after kainate injection simultaneously at the surface and within both hippocampi with combined EEG-iEEG that lasted 44 s. Traces are filtered with a low pass at 30 Hz, to highlight the positive spikes on surface traces (bold segments). These surface epileptic discharges are synchronized with an intra-LH epileptic dipole at the level of the MoDG. No epileptic activity can be observed in the contralateral noninjected hippocampus. Pyr, Pyramidal layer; MoDG, molecular layer of the dentate gyrus; PoDG, polymorph layer of the dentate gyrus.
- Figure 5.
Epileptic phenotype of the kainate mouse model of TLE. A, Occurrence per minute of HPDs reminiscent of epileptic seizures in control animals (n = 23), 7 d after kainate injection (n = 12), 14 d after kainate injection (n = 12), and 28 d after kainate injection (n = 21). The increase is significant across the disease (control: median = 0, 25–75 percentile = 0–0, D7: 0, 0–0, D14: 0, 0–0, D28: 0.05, 0–0.26, **p < 0.01, ***p < 0.001). Although 1 animal presented a 0.14/min occurrence of seizures at D14, the 75th percentile remains equal to 0. B, E, Occurrence per minute of GS (B) and FRs (E) in the longitudinal paired group (n = 12 recordings at each time point for GS; n = 10 for FRs). FRs were not analyzed in 2 animals because of a small sampling rate. The increase is significant across the disease in GS (control: mean = 0, SEM = 0, D7: 0.39, 0.12, D14: 1.51, 0.34, D28: 1.59, 0.29) and FRs (control: median = 0.11, 25–75 percentile = 0–0.38, D7: 0.1, 0.04–0.29, D14: 0.62, 0.3–2, D28: 5.8, 3.58–12.54). C, F, Number of GSs (C) and FRs (F) in control preinjected animals (n = 23) and an unpaired group of 21 animals recorded at D28. The difference is statistically significant in GS (control: mean = 0, SEM = 0, D28: 1.68, 0.31) and FRs (control: median = 0.29, 25–75 percentile = 0.12–0.75, D28: 6.53, 3.65–17.39). D, G, Number of GS (D) and FRs (G) in control animals (n = 4) recorded 28 d after saline injection and an unpaired group of animals (n = 4) recorded 28 d after kainate injection. The difference is statistically significant in GSs (saline: mean = 0, SEM = 0, D28: 2.86, 0.98) and FRs (saline: 0.71, 25–75 percentile: 0.27–0.98, D28: 20.11, 11.65–58.28). *p < 0.05, **p < 0.01, ***p < 0.001, ****p < 0.0001. For the statistical tests used, see Materials and Methods.
- Figure 6.
Development of GS as indicator of the epileptic network. A, Representative GSs (EEG, raw local field potential [LFP]). Two peaks are separated by a period of low-amplitude activity. Red line indicates GS onset. For electrode locations, see Figure 1B. B, Superimposed average traces of the first peak of GS (663 GS, 21 animals at D28). C, The spatiotemporal propagation pattern of GS is highly stable and characterized by a sequence of 4 consecutive stable topographies (for cluster analysis, see Materials and Methods). Normalized voltage values are color-coded from negative blue to positive red values. White and black arrowheads indicate position of the focal negative and positive maxima of the hippocampal dipoles, respectively. Black dashed line indicates position of the injected hippocampus. White dashed line indicates position of the left primary motor cortex. D, Combined EEG-iEEG. Top, Representative average GS (n = 30) in 1 animal, with blue and green squares indicating the first and second peaks, respectively. Bottom, Average current-source density in the LH and RH during the first peak of GS showing a bihippocampal activation at GS onset. Current-source density traces are superimposed on color-coded plots of the interpolated current-source density values. Sink sources are organized similarly in LH and RH with notable differences in the kinetics of the slopes. E, Localization of GS onsets as the disease progresses (surface EEG, n = 12 animals at each time points). The larger the dot, the higher the proportion of GS showing a statistical onset at the electrode. Above 10% and 20%, the color changes with the proportion of onset.
- Figure 7.
GSs are associated with increased motor activity. A, One frame from a video recorded during a surface EEG session. B, The difference of pixel luminosity from one frame to another provides a quantitative unit to estimate movements: the warmer colored regions represent where the animal has moved more (for a detailed description of the process, see Materials and Methods). C, VMI along time, calculated by averaging luminosity differences of all pixels at each time point around one GS. Blue arrowhead indicates the onset of the GS. The motor reaction goes beyond the duration of GS. D, VMI ratios are calculated by dividing the period during and after GS (−20 to 800 ms) by the period before GS, and compared with VMI ratios calculated around random markers in the EEG (baseline, see Materials and Methods). The difference was significant, revealing an evoked motor response (median, 25–75 percentile, week 4, n = 15 animals, ****p < 0.0001, Wilcoxon test).
- Figure 8.
FRs increase as the disease progresses in the EF and in the epileptic network. A, Example of an FR recorded with surface EEG. Black represents raw LFP. Gray represents filtered 200–550 Hz. B, Color code for C. C, Distribution of FRs in the longitudinal group recorded over the somatosensory cortex (orange), the injected hippocampus (green), and all other contacts (black), as a function of their duration and intrinsic frequency in control and as the disease progresses.
- Figure 9.
Epileptic FRs are generated in the EF as well as in the epileptic network. A, Example of an FR recorded in the injected hippocampus during a combined EEG-iEEG recording session. Top, Surface electrode located over the injected hippocampus. Gray represents raw LFP. Black represents filtered 200–550 Hz. Bottom, Signals recorded simultaneously in the injected hippocampus with five selected electrode traces located around the intrahippocampal generator of the FR. Note the inversion of potentials (black arrowheads), which indicates that the generator is at the level of the molecular layer of the dentate gyrus (MoDG). Note also the lack of phase lag (see the black dotted bars on the peak and trough of the FR) between the surface- and depth-recorded FR, which indicates that surface and depth electrodes record the same event. LMol, Lacunosum molecular layer; GrDG, granulosum layer of the dentate gyrus. Bottom, Histogram of FRs recorded with intracortical electrodes in the injected hippocampus. FRs per minute are significantly higher in the injected hippocampus of kainite-injected animals than in saline-injected animals (median, 25–75 percentile: saline: 0.46, 0.09–0.81, kainate: 50.35, 33.92–56.25, Mann–Whitney test: **p = 0.004, 8 kainate + 4 saline mice with intracerebral EEG, D28). B, Example of a left primary motor cortex FR recorded with intracortical EEG (left: raw LFP, right: filtered, 200–550 Hz), which is most clearly seen in the middle layers II/III (blue). Bottom, Histogram of FRs recorded with intracortical electrodes in the left motor cortex. FRs per minute are significantly higher in the frontal cortex of kainate-injected than in saline-injected mice 28 d after injection (saline: 0.07, 25–75 percentile: 0.06–0.11, kainate: 1.05, 0.7–2.62, Mann–Whitney test: **p = 0.0061, 7 kainate + 4 saline mice with intracerebral EEG, D28; same animals as in A). Because of technical issues, only 7 recordings from the frontal cortex could be included.
- Figure 10.
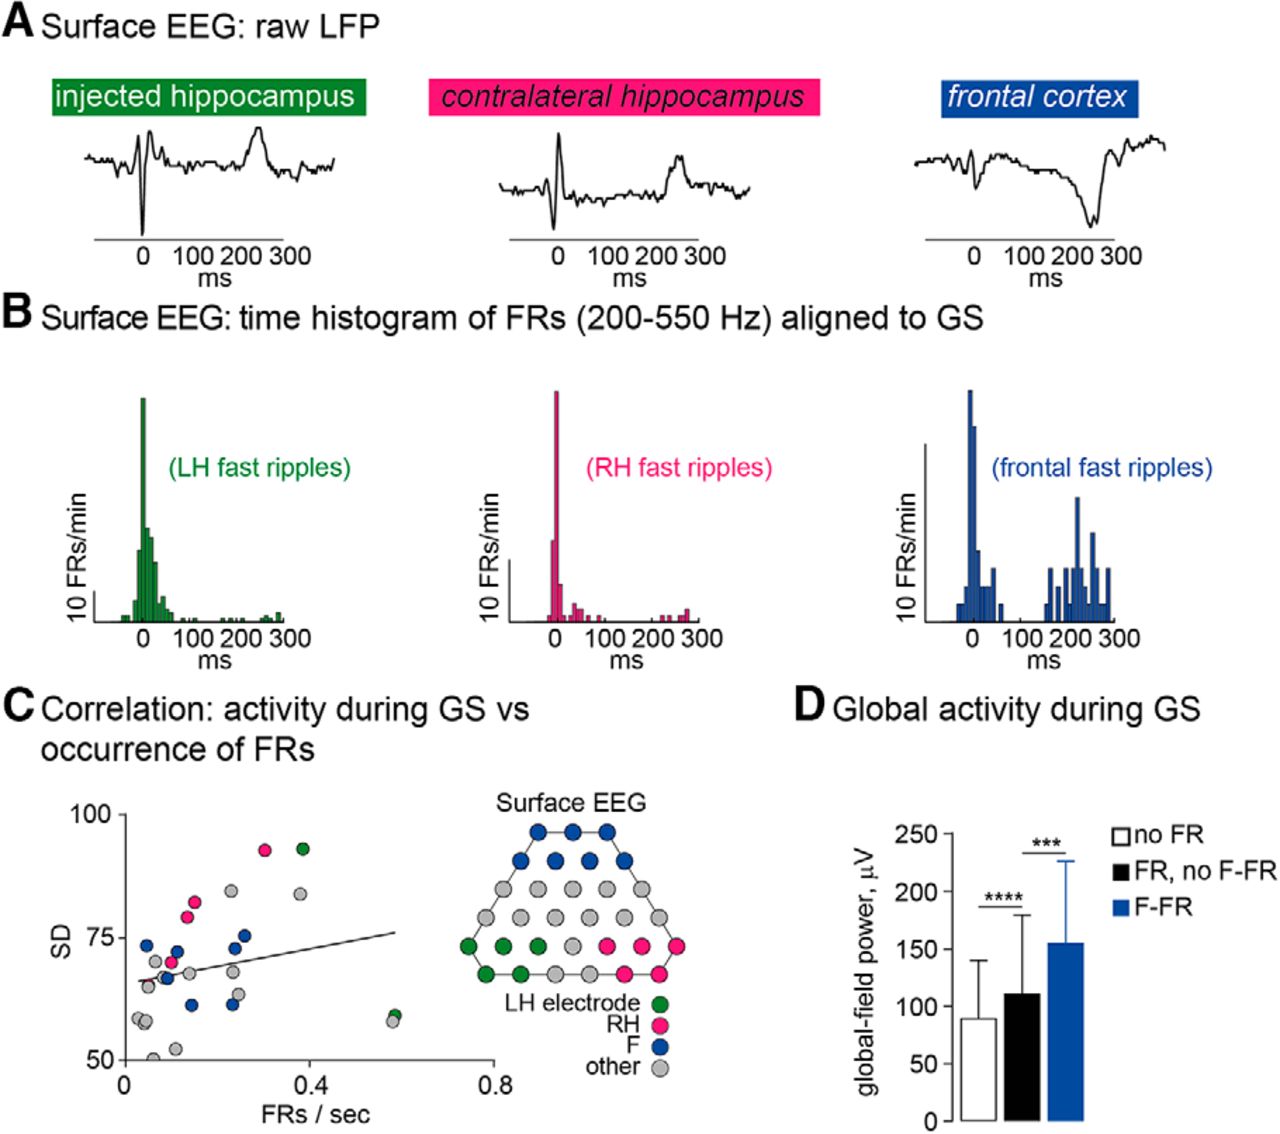
FRs are associated with the propagation of GSs or can be generated spontaneously in the EF and in the epileptic network. A, Average LFP across 663 GS from 21 animals at D28 in three regions of interest: using a surface electrode located above the injected hippocampus (e19), contralateral hippocampus (e5), and frontal cortex (e29). All contacts show two peaks of activity corresponding to the first and second peaks of GS. B, Temporally aligned to A, time histograms of FRs recorded in surface EEG at D28 (n = 21 animals). The 0 time point corresponds to the statistical onset of GSs. In both hippocampi, FRs are time-locked mainly to the first peak, whereas in the frontal cortex, they are time-locked to either the first or second peak of GS. C, Correlation between activity during GSs estimated by the SD of each electrode (0.1–200 Hz) and FR rate (200–550 Hz) during GSs recorded by each surface electrode at week 4 (r2 = 0.24, p = 0.0049, Spearman correlation, n = 21 animals at D28, 2 outsiders are not shown). GS and FR are events occurring at two different frequency bands, which excludes the possibility that the correlation is merely an effect of FR activity. D, Mean global field power amplitudes of surface-recorded GS at the EEG timeframe best correlated with map 4 (frontal component) in the absence of FR (“no FR”) and GS during which FRs were detected but not in frontal regions (“FR, no F-FR”) and GS with at least one F-FR (“F-FR”). Global field power of GS with F-FR was significantly higher than all other GS (F-FR vs FR, no F-FR: ***p < 0.001, FR, no F-FR vs no FR: ****p < 0.0001, Kruskal–Wallis test + post hoc).
- Figure 11.
Silencing of the left hippocampus activity by TTX. A, The 2 s windows recordings in the pyramidal layer (top) and dentate gyrus (bottom) of the hippocampus before (black) and during silencing (orange). B, Neuronal firing per minute before (black) and during (orange) TTX silencing in the injected hippocampus of 1 representative animal. The decrease during TTX silencing is significant for both the pyramidal layer (pyr, before: median = 10, 25–75 percentile = 2–25, during TTX: 2, 1–2) and dentate gyrus (DG, before: median = 11, 25–75 percentile = 1, 1–3). ****p < 0.0001. C, Example of a typical focal epileptic spike recorded with surface EEG showing a positive wave in the raw LFP (in black at the center of the 250 ms window) with the superimposed FR (filtered at 200–550 Hz, in gray).
- Figure 12.
The epileptic network becomes independent of the epileptic focus at week 4. A, Occurrence of focal spikes, HPDs reminiscent of seizures, remote FRs and GSs in mice without TTX (black, 2 control-epileptic recording sessions at D27 and D28) and during TTX silencing of the injected hippocampus (orange, 1 recording session at D29) in the same 6 epileptic animals. FRs of the injected hippocampus are absent in the TTX condition. B, Quantitative localization of FRs before (left) and during (right) TTX silencing. There is a considerable decrease of FRs of the injected hippocampus during silencing but not remote FRs (n = 6 animals). C, Example of a GS recorded during TTX silencing and the concomitant quantification of movements with the VMI. D, Topographical analysis of the first 20 ms of GSs recorded during TTX silencing showing that, as expected, the injected hippocampus dipole is absent (white arrowhead) in the TTX condition (n = 6 animals). There is a significant decrease of activity of the injected hippocampus at GS onset (p < 0.05, see Materials and Methods). Maps represent normalized voltage values with the same color code as in Figure 6. E, Left, At D7, occurrence of GS decreased significantly during TTX silencing (mean ± SD, *p < 0.05, n = 3; 2 recording sessions at D6 and D7 vs 1 at D8). Right, Ratio of GS occurrence during TTX silencing divided by GS occurrence before TTX silencing, at D7 versus D28 after kainate injection. At D7, TTX silencing was able to decrease GS occurrence, but not at D28 (mean ± SEM, difference of ratio: Mann–Whitney test, *p = 0.0238).


Tables
Electrophysiological groups Surface EEG recordings from preinjection (control) to D7, D14, and D28
Longitudinal recordings prekainate and postkainate: 30 animals 12 animals recorded at every time point + 18 animals recorded prekainate and/or at D28 postkainate. N recordings for:
- Unpaired analyses: 23 preinjection controls, 12 D7, 12 D14, 21 D28
- Paired analyses: 12 at every time points
Sham experiments: 4 kainate-injected (included in a) and 4 saline-injected animals
Silencing of the EF
3 animals at D7 and 6 at D28 postkainate (4 animals from group 1.a + 5 additional animals)
Intracerebral EEG recordings (iEEG) at D28
8 kainate-injected animals (2 animals from group 1.a + 6 additional animals)
4 saline-injected animals (from 1.b)
Combined surface-intracerebral EEG recordings (EEG-iEEG) at D28
6 kainate-injected animals (from 1.a)
Surface EEG recordings with video monitoring at D28
15 kainate-injected animals (from 1.a)
Histopathology groups
Analyses during the latent phase at D2 and D7
12 kainate-injected animals: 6 analyzed at D2 and 6 at D7
8 saline-injected animals: 4 analyzed at D2 and 4 at D7
Analyses during the chronic phase (D28)
21 kainate- and 4 saline-injected animals (from 1)


