

Abstract
Metaplasticity is the regulation of synaptic plasticity based on the history of previous synaptic activation. This concept was formulated after observing that synaptic changes in the visual cortex are not fixed, but dynamic and dependent on the history of visual information flux. In visual cortical neurons, sustained synaptic stimulation activate the enzymatic complex NOX2, resulting in the generation of reactive oxygen species (ROS). NOX2 is the main molecular structure responsible for translating neural activity into redox modulation of intracellular signaling pathways involved in plastic changes. Here, we studied the interaction between NOX2 and visual experience as metaplastic factors regulating synaptic plasticity at the supergranular layers of the mouse visual cortex. We found that genetic inhibition of NOX2 reverses the polarizing effects of dark rearing from LTP to LTD. In addition, we demonstrate that this process relies on changes in the NMDA receptor functioning. Altogether, this work indicates a role of ROS in the activity-dependent regulation of cortical synaptic plasticity.
SIGNIFICANCE STATEMENT Synaptic plasticity in the visual cortex is modulated by the history of sensory experience and this modulation has been defined as metaplasticity. Dark rearing facilitates synaptic potentiation as a mechanism optimizing the range of synaptic modification. This process requires the production of reactive oxygen species mediated by the enzymatic complex NOX2. If the activity of NOX2 is inhibited, then visual deprivation results in synaptic depression. These findings increase our knowledge about metaplasticity and help in our understanding of how neural activity modulates cellular mechanisms of synaptic change.
Introduction
Metaplasticity is the modification in the properties of synaptic plasticity as a function of previous history of neural and synaptic activity (Abraham and Bear, 1996). This concept comprehends physiological factors that are capable of modulating the induction of synaptic changes. One of the most studied phenomena of metaplasticity is the effect of visual experience on LTP and LTD in the visual cortex (Kirkwood et al., 1996; Philpot et al., 2003). Reduction of synaptic activity due to dark rearing facilitates LTP and reduces LTD, by increasing NMDA receptor (NMDAR) functioning (Czepita et al., 1994). These findings have been interpreted by means of a model theorizing the existence of a synaptic modification threshold (Bienenstock et al., 1982), which is modulated as a function of the average activity in the neuronal network. This process maintains synaptic changes within a proper dynamic range, allowing the stimulus-driven strengthening of neural connections (Bear, 2003).
Because metaplasticity adjusts the threshold according to the recent level of global activity, any cellular factor resulting from prolonged synaptic stimulation is a potential metaplastic mediator (Girouard et al., 2009). In the brain, sustained neuronal activity leads to considerable production of reactive oxygen species (ROS) (Halliwell, 1992), suggesting the intriguing possibility that these molecules have a metaplastic function in synaptic transmission.
The idea that ROS function purely in a harmful manner has given way to a different view that these molecules can modulate specifically various pathways that are relevant for synaptic plasticity (Atkins and Sweatt, 1999; Yermolaieva et al., 2000; Massaad and Klann, 2011; Beckhauser et al., 2016). Similarly to phosphorylation and dephosphorylation, the oxidation of cysteine and methionine residues provides a mechanism to alter the function of several proteins rapidly and reversibly (Chiarugi, 2005). Proteins with activity that responds to redox changes include tyrosine phosphatases, membrane receptors, transcription factors, kinases, and ion channels (Choi and Lipton, 2000; Hidalgo and Donoso, 2008; Bodhinathan et al., 2010; Yang et al., 2010; Calero et al., 2011; Massaad and Klann, 2011; Rodríguez-Muñoz and Garzón, 2013; Beckhauser et al., 2016).
Among all of the cellular structures involved in redox signaling, the enzymatic complexes of the NOX family are those that generate ROS more directly after intense synaptic stimulation (Massaad and Klann, 2011). In the hippocampus and cerebral cortex, NOX enzymes are highly expressed in dendritic synaptic sites and participate in postsynaptic intracellular pathways important for plasticity (Serrano et al., 2003; Kim et al., 2005; Tejada-Simon et al., 2005; Massaad and Klann, 2011). The NOX2 isoform is stimulated by NMDAR activation and this event produces large and controlled amounts of superoxide in a rapid process that links extracellular stimuli to subsequent signaling processes (Bindokas et al., 1996; Kishida et al., 2005; Brennan et al., 2009; Girouard et al., 2009; Guemez-Gamboa et al., 2011; Reyes et al., 2012; De Pasquale et al., 2014). Although the physiological roles of NOX2 in the brain are only partially understood, it has been proposed that one of its functions could be the redox modulation of neurotransmission and plasticity at glutamatergic synapses (Sorce and Krause, 2009; Sorce et al., 2010). Considering ROS as highly reactive and diffusible molecules, NOX2 activation could be involved in the metaplastic regulation of synaptic changes. In agreement with this idea, previous studies demonstrated that nonfunctional NOX2 impairs synaptic plasticity in the hippocampus and visual cortex (Kishida et al., 2006; De Pasquale et al., 2014).
In the present study, we introduce the possibility that NOX2 does not have a mere permissive role in synaptic modification, but rather could have a metaplastic function in the regulation of experience-dependent synaptic plasticity. To test this hypothesis, we performed LTP and LTD experiments using the dark-rearing protocol and knock-out mice for the catalytic subunit of NOX2 (gp91phox−/−). Our results indicate that the loss of functional NOX2 overturns the effects of dark rearing by changing the polarization of synaptic plasticity from potentiation to depression.
Materials and Methods
Animals.
Wild-type (C57BL/6) and gp91phox−/− mice of either sex (The Jackson Laboratory) were used throughout this work. All animals used in our experiments were at the age of postnatal day 20 (P20) to P24 and were kept in an animal facility at 23 ± 2°C with ad libitum access to food and water at all times. Mice were divided into four experimental groups: normally reared wild-type (NW), dark-reared wild-type (DW), normally reared gp91phox−/− (NK), and dark-reared gp91phox−/− (DK). Normally reared animals were maintained on a 12/12 h light/dark cycle and dark-reared animals were deprived from light exposure from birth to the beginning of experimental procedures. All procedures were approved by the Institutional Animal Care Committee of the Institute of Biomedical Sciences, University of São Paulo, Brazil (CEUA ICB/USP #090, fls. 1°).
Preparation and maintenance of brain slices.
Animals were deeply anesthetized thought isoflurane inhalation (AErrane; Baxter Pharmaceuticals) and then decapitated. The brain was quickly removed and submerged in cooled (0°C) oxygenated (5% CO2–95% O2) dissection buffer containing the following (in mm): 206 sucrose, 25 NaHCO3, 2.5 KCl, 10 MgSO4, 1.25 NaH2PO4, 0.5 CaCl2, and 11 d-glucose). Brains were glued to an iron platform and sectioned by vibratome. Visual coronal slices (∼300 μm thick) were prepared and rapidly transferred to a holding chamber containing artificial CSF (ACSF) containing the following (in mm): 125 NaCl, 25 NaHCO3, 3 KCl, 1.25 NaH2PO4, 1 MgCl2, 2 CaCl2, and 25 d-glucose. Slices were kept oxygenated at room temperature (20–25°) for at least 1 h before proceeding with electrophysiological recordings.
Pharmacology.
In some electrophysiological experiments, the NMDAR blockers MK-801 (50 or 100 μm; Tocris Bioscience) and CP-101,606 (20 μm; Sigma-Aldrich) were used. In experiments to isolate NMDAR responses, we prepared a magnesium-free ACSF containing the AMPA receptor (AMPAR) blocker DNQX (50 μm; Tocris Bioscience) and the GABA receptor (GABAR) blocker picrotoxin (50 μm; Tocris Bioscience). MK-801 stock solutions were prepared in warm distilled water. DNQX, picrotoxin, and CP-101,606 stock solutions were prepared in DMSO (0.1%). All drugs were diluted in ACSF to their final concentration before use.
Electrophysiological recordings.
Cortical slices containing the visual cortex were placed in a submersion-type recording chamber upon a modified microscope stage and maintained at 30°C with constant perfusion of oxygenated ACSF (5% CO2–95% O2). Whole-cell recordings were made from layer 2/3 of primary visual cortex (V1). Layer 2/3 was identified by differential interference contrast microscopy: layer 1 was typically thin and aneuronal, whereas layer 4 showed a dense packing of cell bodies. Layers 2/3 can be recognized as being located between layers 1 and 4. All recordings were obtained from regular spiking pyramidal-shaped cells. Recording pipettes were fabricated from borosilicate glass (Garner Glass) with input resistances of ∼4–6 MΩ and were filled with intracellular solution containing the following (in mm): 135 K-gluconate, 7 NaCl, 10 HEPES, 2 Na2ATP, 0.3 Na3GTP, 2 MgCl2, and 0.1–0.5% biocytin, pH 7.3 with KOH, and osmolality 290 mOsm. All experiments were performed using a visualized slice setup under a differential interference contrast-equipped Nikon Eclipse E600FN microscope. Recordings were made using a Multiclamp 700B amplifier and pClamp software (Molecular Devices). Only recordings from cells with membrane potentials <−65 mV, access resistance <20 MΩ, and input resistance >100 MΩ and <1000 MΩ were included in our data. Cells were discarded if any of these values changed >20% during the experiment. Postsynaptic responses were recorded in current-clamp mode.
Electrical stimulation.
Synaptic responses were evoked by electrically stimulating inputs to neurons of layer 2/3 (0.1 Hz; 0.2 ms). Stimulation was delivered through a concentric bipolar electrode (125 μm diameter; FHC) placed in the middle of the cortical thickness of layer 4. The role of ROS on experience-dependent synaptic plasticity was investigated using knock-out animals for the catalytic subunit of NOX2 (gp91phox−/−). Only responses that we determined to be monosynaptic were included in the data based on the following criteria: latencies <3 ms, latency jitter <1 ms, and no failures for stimulation levels above threshold. For LTP/LTD experiments, the intensity of stimulation was increased gradually from a subthreshold level by steps of 5 μA until a response was evoked. The intensity was then adjusted to evoke 2–5 mV responses.
To induce synaptic plasticity, a pairing protocol in which presynaptic stimulation was coupled with postsynaptic depolarization was used. Three different values of voltage membrane potential were used (0, −20, or −40 mV) to allow differential NMDAR recruitment during the induction, thus leading to different synaptic plasticity expression (LTP, no plasticity, LTD). To this end, the recording mode was switched from current-clamp to voltage-clamp mode. The induction consisted in a pairing protocol of 200 epochs (1 Hz) during which the voltage membrane was kept at 0, −20, or −40 mV. Changes in synaptic strength were quantified as changes in the initial amplitude of the postsynaptic potential normalized by the mean baseline response obtained during the first 10 min of stable recordings. In all graphs showing the LTP or LTD time course, the EPSP amplitude was normalized with respect to the averaged EPSP value of the last 5 min of baseline. The LTP and LTD magnitudes were analyzed by calculating the average EPSP value of the last 5 min (35–40 min) of the postsynaptic period. This value was normalized and the baseline was subtracted to obtain the relative increase or decrease of EPSP.
In some experiments, we aimed to determine the relationship between stimulation intensity and the evoked synaptic responses. In these experiments, the intensity stimulation values were normalized with respect to the “minimal stimulation” intensity, which is defined as follows: stimulation level was increased from subthreshold in 5 μA steps until a reliable response was triggered; intensity was then further increased by 5 μA from this point and this was the minimum level of intensity stimulation.
Immunohistochemistry.
Animals were anesthetized with ketamine (10 mg/kg) and xylazine (0.5 mg/kg) and then submitted to transcardiac perfusion with PBS solution (0.9% NaCl on 0.2 m PB, pH 7.4), followed by PB paraformaldehyde at 2% (2% PFA on 0.1 m PB, pH 7.4) for fixation. Brains were removed and postfixed for 4 h in the same solution and subsequently transferred to a 30% sucrose PB solution (30% sucrose on 0.1 m PB, pH 7.4) for cryoprotection and stored at 4°C until further processing.
Coronal sections (30 μm) were obtained on a freezing microtome. The slices were washed for 10 min 3 times in PB 0.1 m and incubated in a solution containing the primary antibody anti-NR2A (NMDAε1 antibody; C-17, sc-1468; Santa Cruz Biotechnology) or anti-NR2B (NMDAε2 antibody; C-20, sc-1469; Santa Cruz Biotechnology) for 24 h at 1:250 dilution, containing 50 μl of normal donkey serum diluted in 0.3% Triton X-100. After incubation with primary antibodies, sections were washed for 10 min 3 times in PB 0.1 m and then incubated for 2 h with 1:200 dilution of biotinylated secondary antibody (donkey anti-goat IgG; Jackson ImmunoResearch). Next, slices were washed as described previously here and then incubated with avidin–biotin complex (1:100; ABC Elite Kit; Vector Laboratories) for 2 h. After washing, visualization was done using a mixture of 0.05% diaminobenzidine and 0.01% hydrogen peroxide. The slices were washed in PB and mounted on slides with glycerol-based mounting medium, dried at room temperature, dehydrated with graded solutions of ethanol followed by xylol, and then covered with Perm (Fisher Scientific) and coverslips for permanent storage.
Neurons that were NR2A-positive or NR2B-positive were counted in the layer 2/3 of the V1. Each slice was photographed with a 20× magnification using a photomicroscope coupled to a digital camera and photographs were stored in a computer for later digital analysis. Data analysis was made by manual counting of positive neurons performed by an investigator blinded to conditions. A contrast threshold was set to ensure the inclusion of only neurons that could be easily distinguished from the background, excluding false positives. A size threshold was also set to eliminate points too large or too small to be considered as neurons. For each group, slices were counted, generating an average of positive neurons for each group, for further statistical analysis.
Western blots.
Tissue samples were obtained from acute cortical slices, which were dissected under an optic microscope to isolate and select the layer 2/3 of the visual cortex. For this purpose, brain slices were prepared as described above for electrophysiology experiments. Immunoblots were performed as described previously (Hernandes et al., 2013). The membranes were incubated for 24 h with the same antibodies used in immunohistochemistry experiments: goat polyclonal anti-NR2A (NMDAε1 antibody; C-17, sc-1468; Santa Cruz Biotechnology) or anti-NR2B (NMDAε2 antibody; C-20, sc-1469; Santa Cruz Biotechnology) at 1:500 dilution and a mouse monoclonal anti-β-actin (1:1000; Sigma-Aldrich) for 2 h. The probed proteins were developed using a chemiluminescent kit (ECL; GE Healthcare). Bands were captured with the scanner C-digit (LI-COR) and images were quantified with ImageJ. Data were always plotted in relation to controls (NW animals).
Statistical analysis.
LTP and LTD were assessed by means of a paired t test. We compared the synaptic response of the baseline with that of the postinduction period. For both periods, synaptic response was calculated by averaging the last 5 min EPSP values. Differences of synaptic change between 2 experimental groups were assessed by comparing the average EPSP recorded during the last 5 min (35–40 min) with an unpaired t test.
A χ2 was applied to study differences among groups in the distribution probability of inducing plasticity. In such analysis, cells were classified as LTP or LTD when the induction protocol causes significant change in the EPSP according to the Wilcoxon test (p < 0.05).
Some analysis that summarized the combined action of two or three factors on plasticity were performed by using a two-ways or a three-ways ANOVA respectively. Intensity/response curves of our four experimental groups were analyzed by means of a three-way ANOVA. Finally, a two-way ANOVA analyzed the effects of genotype and rearing condition on NR2A and NR2B subunit expression.
The effects of CP-101,606 (20 μm) or vehicle were assessed by means of a paired t test. The average NMDAR-mediated EPSP of the 5 min baseline was compared with the averaged synaptic response of the last 5 min of drug application (15–20 min). Differences of CP-101,606 effect between experimental groups were analyzed by comparing the average NMDAR-mediated EPSP recorded during the last 5 min (15–20 min) by means of a two-way ANOVA.
Results
The goal of the present work was to study the interaction between two metaplastic factors: visual experience and of ROS. The first step was to evaluate how dark rearing and genetic suppression of NOX2 modulate the plasticity curve, in which synaptic change is expressed as a function of the postsynaptic depolarization applied during the induction protocol. In our previous study, we found that, in knock-out animals for the NOX2 enzyme (gp91phox−/−), the induction of LTP and LTD was impaired through inhibition of NMDAR activity (De Pasquale et al., 2014). Because deprivation of experience potentiates the NMDAR function (Yoshimura et al., 2003; Guo et al., 2012), we hypothesized that dark exposure could rescue the deficit in plasticity caused by the lack of functional NOX2.
NOX2 and dark rearing modulate synaptic plasticity
−40 mV pairing protocol
We first examined how visual experience together with ROS production would affect the LTD of layer 2/3 cells. As described in the Materials and Methods, we evaluated LTP by analyzing the EPSPs obtained from the last 5 min of the postsynaptic recording. The results shown in Figure 1 indicate that, in NW animals, presynaptic stimulation paired with −40 mV voltage clamp induces significant reduction of synaptic strength (Fig. 1A; 10 cells, 10 slices, 7 animals, p < 0.01 on a paired t test), but the same induction protocol does not cause significant variation of EPSPs in DW mice (Fig. 1A; 10 cells, 10 slices, 7 animals; p > 0.1 on a paired t test). In the visual cortex, deprivation of visual experience shifts the plasticity induction threshold by increasing the probability of inducing LTP (Kirkwood et al., 1995; Guo et al., 2012). Consistently, our results showed that pairing at −40 mV fails to trigger LTD in DW animals and this depends on the increased probability of obtaining LTP after the induction, as shown in Figure 1C (p < 0.05, χ2 test).

In wild-type animals, visual deprivation suppresses LTD induced through pairing at −40 mV. A, Magnitude of EPSPs before and after the induction of plasticity through the −40 mV conditioning protocol in wild-type animals. EPSP values are normalized with respect to the baseline. Slices obtained from NW mice are compared with slices obtained from DW mice. LTD was successfully induced in normally reared (10 cells, 10 slices, 7 animals, p < 0.01, paired t test), but not in dark-reared animals (10 cells, 10 slices, 7 animals, p > 0.1, paired t test). Examples of EPSP traces show the amplitude before (black trace) and after (gray trace) the induction. B, Magnitude of EPSPs before and after the induction of plasticity through the −40 mV conditioning protocol in gp91phox−/− animals. EPSP values are normalized with respect to the baseline. Slices obtained from NK mice are compared with slices obtained from DK mice. The protocol failed to induce synaptic change both in normally reared (10 cells, 10 slices, 7 animals, p > 0.1, paired t test) and dark-reared animals (10 cells, 10 slices, 7 animals, p > 0.1, paired t test). Examples of EPSP traces show the amplitude before (black trace) and after (gray trace) induction. C, Percentage of cells exhibiting LTP, LTD, or no variation in wild-type animals after induction with the −40 mV pairing protocol. The normal rearing condition is compared with dark rearing. Dark rearing increases significantly the probability of inducing LTP (p < 0.05, χ2 test). D, Percentage of cells exhibiting LTP, LTD, or no variation in gp91phox−/− animals after induction with the −40 mV pairing protocol. The normal rearing condition is compared with dark rearing. Dark rearing significantly increases the probability of inducing LTP (p < 0.05, χ2 test), but does not significantly modify the probability distribution (p > 0.1, χ2 test). In C and D, cells are classified as LTP or LTD when the induction causes significant change in the postsynaptic response according to the Wilcoxon test (p < 0.05).
Conversely, in knock-out mice, the LTD induced by pairing at −40 mV is abolished, regardless of rearing condition (Fig. 1B; NK: 10 cells, 10 slices, 7 animals, p > 0.1 on a paired t test; DK: 10 cells, 10 slices, 7 animals; p > 0.1 on a paired t test). Figure 1D shows that NK animals respond to pairing at −40 mV by expressing similar probability values for LTP, LTD, or no effect and dark exposure does not alter this profile significantly (Fig. 1D; p > 0.1, χ2 test).
Therefore, genetic ablation of NOX2 impairs the LTD induced through −40 mV paired conditioning and visual deprivation is not able to rescue the knock-out phenotype. However, wild-type animals did not exhibit the typical depression induced by this protocol because dark rearing is capable of increasing the probability of inducing LTP.
−20 mV pairing protocol
Pairing presynaptic stimulation with postsynaptic depolarization at −20 mV is not effective at inducing either LTP or LTD (Fig. 2A; NW: 10 cells, 10 slices, 6 animals, p > 0.1, paired t test; DW: 9 cells, 9 slices, 6 animals, p > 0.1, paired t test). In fact, as shown in Figure 2C, pairing at −20 mV results in the same probability of inducing LTP or LTD, so the resulting average does not differ from baseline. In wild-type animals, dark rearing fails to promote significant change in the relative distribution of probability (p > 0.1 on a χ2 test), so pairing at −20 mV does not produce relevant effects in the average of postsynaptic responses.

In gp91phox−/− animals, visual deprivation promotes LTD through pairing at −20 mV. A, Magnitude of EPSPs before and after the induction of plasticity through the −20 mV conditioning protocol in wild-type animals. EPSP values are normalized with respect to the baseline Slices obtained from NW mice are compared with slices obtained from DW mice. No synaptic change was observed in normally reared animals (10 cells, 10 slices, 6 animals, p > 0.1, paired t test) and dark-reared animals (9 cells, 9 slices, 6 animals, p > 0.1, paired t test). Examples of EPSP traces show the amplitude before (black trace) and after (gray trace) induction. B, Magnitude of EPSPs before and after induction of plasticity through the −20 mV conditioning protocol in gp91phox−/− animals. EPSP values are normalized with respect to the baseline Slices obtained from normally reared mice are compared with slices obtained from dark-reared mice. LTD was successfully induced in DK (9 cells, 9 slices, 6 animals, p < 0.01, paired t test), but not in NK animals (10 cells, 10 slices, 7 animals, p > 0.1, paired t test). Examples of EPSP traces show the amplitude before (black trace) and after (gray trace) induction. C, Percentage of cells exhibiting LTP, LTD, or no variation in wild-type animals after induction with the −20 mV pairing protocol. The normal rearing condition is compared with dark rearing. Dark rearing does not significantly modify the probability distribution (p > 0.1, χ2 test). D, Percentage of cells exhibiting LTP, LTD, or no variation in gp91phox−/− animals after induction with the −20 mV pairing protocol. The normal rearing condition is compared with dark rearing. Dark rearing significantly increases the probability of inducing LTD (p < 0.05, χ2 test). In C and D, cells are classified as LTP or LTD when induction causes significant change in the postsynaptic response according to the Wilcoxon test (p < 0.05).
However, in cells from knock-out mice, the situation is different: in NK mice, the amplitude of EPSP does not change after pairing at −20 mV (Fig. 2B; NK: 10 cells, 10 slices 7 animals, p > 0.1, paired t test); nevertheless, in DK animals, the average magnitude of synaptic responses is significantly decreased under the same induction protocol (Fig. 2B; DK: 9 cells, 9 slices 6 animals, p < 0.01, paired t test), showing that dark exposure increases the chance of inducing LTD in cells derived from gp91phox−/− mice (Fig. 2D: p < 0.05, χ2 test).
Together, these results indicate that the −20 mV protocol promotes synaptic depression in knock-out animals reared in dark conditions.
0 mV pairing protocol
In layer 2/3 neurons derived from wild-type animals, the 0 mV pairing paradigm induced robust, homosynaptic LTP (Fig. 3A; NW: 11 cells, 11 slices, 8 animals, p < 0.05, paired t test; DW: 10 cells, 10 slices, 8 animals; p < 0.01, paired t test). No statistical difference was observed comparing the potentiation of NW and DW mice. Figure 3C shows that pairing at 0 mV correlated with a high probability of inducing LTP both under normal conditions and dark rearing. No significant difference was found when comparing the distribution of probability of the two wild-type groups (p > 0.1, χ2 test).

In gp91phox−/− animals, visual deprivation promotes LTD through pairing at 0 mV. A, Magnitude of EPSPs before and after induction of plasticity through the 0 mV conditioning protocol in wild-type animals. EPSP values are normalized with respect to the baseline Slices obtained from normally reared mice are compared with slices obtained from dark-reared mice. LTP was successfully induced in NW animals (11 cells, 11 slices, 8 animals, p < 0.05, paired t test) and DW animals (10 cells, 10 slices, 8 animals; p < 0.01, paired t test). Examples of EPSP traces show the amplitude before (black trace) and after (gray trace) induction. B, Magnitude of EPSPs before and after induction of plasticity through the 0 mV conditioning protocol in gp91phox−/− animals. EPSP values are normalized with respect to the baseline Slices obtained from normally reared mice are compared with slices obtained from dark-reared mice. LTD was observed in DR-gp91phox−/− mice (9 cells, 9 slices, 6 animals, p < 0.01, paired t test), whereas no significant effect on synaptic response was induced in NK animals (9 cells, 9 slices, 6 animals, p > 0.1, paired t test). Examples of EPSP traces show the amplitude before (black trace) and after (gray trace) induction. C, Percentage of cells exhibiting LTP, LTD, or no variation in wild-type animals after induction with the 0 mV pairing protocol. The normal rearing condition is compared with dark rearing. Dark rearing does not significantly modify the probability distribution (p > 0.1, χ2 test). D, Percentage of cells exhibiting LTP, LTD, or no variation in gp91phox−/− animals after induction with 0 mV pairing protocol. The normal rearing condition is compared with dark rearing. Dark rearing significantly increases the probability of inducing LTD (p < 0.05, χ2 test). In C and D, cells are classified as LTP or LTD when induction causes significant change in the postsynaptic response according to the Wilcoxon test (p < 0.05).
As described previously (De Pasquale et al., 2014), pairing at 0 mV induces no net change in EPSP amplitude of slices obtained from NK animals (Fig. 3B; 9 cells, 9 slices, 6 animals, p > 0.1, paired t test). However, cells recorded from DK mice respond to the 0 mV induction protocol undergoing remarkable postsynaptic depression (Fig. 3B; 9 cells, 9 slices, 6 animals, p < 0.01, paired t test). Dark rearing greatly increases the probability of inducing LTD in this protocol when ROS production is low (Fig. 3D, p < 0.05, χ2 test). These results demonstrated that dark exposure restores synaptic plasticity in gp91phox−/− animals, yet such recovery is not bidirectional because it only allows the expression of LTD.
The results of this experiment suggest that ROS production could have metaplastic effects allowing the expression of LTD in dark-reared knock-out animals. Figure 6A summarizes the results shown so far. In conclusion, the effects of the visual deprivation depend on NOX2 activity: under normal conditions, dark exposure favors the induction of LTP; nevertheless, when dark rearing is combined with genetic ablation of NOX2, neurons undergo LTD. The analysis performed with a three-way ANOVA (genotype, rearing, and conditioning as factors) indicates that there is a significant difference between wild-type and gp91phox−/− animals (p < 0.001) and this difference depends on rearing condition (p < 0.01) and voltage-clamp value (p < 0.05).
Synaptic plasticity requires the activation of NMDARs
The LTP and LTD of visual cortical supragranular layers require the activation of NMDARs (Kirkwood and Bear, 1995; Philpot et al., 2003, 2007; Yoshimura et al., 2003; Jiang et al., 2007; Smith et al., 2009; Li and Wang, 2013; De Pasquale et al., 2014). Therefore, NOX2 inhibition and visual deprivation may interact to alter the profile of NMDAR-dependent plasticity to favor LTD over LTP according to our hypothesis. Alternatively, another form of LTD based on different mechanisms might be recruited under these conditions. To address this issue, the NMDAR function was suppressed by treating the slices with the NMDAR blocker MK-801 and the results are presented in this section.
Synaptic plasticity and NMDA blocking in wild-type animals
In normally reared wild-type mice, LTP can be induced by pairing presynaptic stimulation with 0 mV postsynaptic voltage (Fig. 4A; 11 cells, 11 slices, 8 animals; p < 0.05, paired t test) and potentiation is prevented when the slices are incubated with MK-801 at 50 μm (Fig. 4A; 9 cells, 9 slices, 7 animals; p > 0.1, paired t test). Pairing presynaptic stimulation with −40 mV postsynaptic voltage induces LTD in the same animals (Fig. 4B,C; 10 cells, 10 slices, 7 animals; p < 0,01, paired t test) and blockage of NMDARs with the same concentration of MK-801 does not abolish the LTD (Fig. 4B; 12 cells, 12 slices, 8 animals; p < 0.05, paired t test). However, in the presence of MK-801, the LTD was significantly reduced compared with untreated slices (p < 0.05, t test).

LTP and LTD of wild-type animals require the activation of the NMDAR. A, Magnitude of EPSPs before and after induction of plasticity through the 0 mV conditioning protocol in NW animals. EPSP values are normalized with respect to the baseline. Slices treated with MK-801 (50 μm) are compared with untreated slices. LTP was successfully induced in untreated slices (11 cells, 11 slices, 8 animals, p < 0.05, paired t test), but not in slices treated with MK-801 (9 cells, 9 slices, 7 animals; p > 0. 1, paired t test). Examples of EPSP traces show the amplitude before (black trace) and after (gray trace) induction. B, Magnitude of EPSPs before and after induction of plasticity through the −40 mV conditioning protocol in NW animals. EPSP values are normalized with respect to the baseline. Slices treated with MK-801 (50 μm) are compared with untreated slices. LTD was successfully induced in untreated (10 cells, 10 slices, 7 animals, p < 0.01, paired t test) and treated slices (12 cells, 12 slices, 8 animals; p < 0.01, paired t test). The LTD of treated slices is significantly lower compared with untreated (p < 0,05, t test). Examples of EPSP traces show the amplitude before (black trace) and after (gray trace) induction. C, Magnitude of EPSPs before and after induction of plasticity through the −40 mV conditioning protocol in NW animals. EPSP values are normalized with respect to the baseline. Slices treated with MK-801 (100 μm) are compared with untreated slices. LTD was successfully induced in untreated (10 cells, 10 slices, 7 animals, p < 0.01, paired t test), but not in treated slices (10 cells, 10 slices, 6 animals; p > 0. 1, paired t test). Examples of EPSP traces show the amplitude before (black trace) and after (gray trace) induction.
During the induction of NMDAR-dependent synaptic plasticity, the correlation of presynaptic and postsynaptic activity is converted by the voltage-dependent NMDAR into postsynaptic Ca2+ influx (Kirkwood and Bear, 1995). In this way, mild increases of postsynaptic Ca2+ can trigger LTD, whereas larger elevations of intracellular Ca2+ would elicit LTP. This model indicates that LTD can be induced by relying on important but limited NMDAR contribution, compared with LTP, which might be more sensitive to pharmacological receptor blockage.
To test this hypothesis, we applied MK-801 at a higher concentration (100 μm) when inducing synaptic depression in slices from our NW animals. Neuronal EPSPs recorded in these conditions do exhibit complete blockage of LTD (Fig. 4C; 10 cells, 10 slices, 6 animals; p > 0.1, paired t test). Therefore, our results confirmed our hypothesis, suggesting that synaptic depression mechanisms are based on lower levels of NMDAR activity compared with mechanisms of synaptic potentiation.
Synaptic plasticity and NMDA blocking in gp91phox−/− animals
We have demonstrated previously that it is possible to induce LTD in gp91phox−/− animals when they are reared in the dark. It remains to be seen whether this form of LTD requires the involvement of NMDAR. To study this possibility, we used the pairing at 0 mV in slices obtained from DK animals while blocking NMDAR with MK-801.
In untreated slices from DK animals, pairing presynaptic stimulation with 0 mV postsynaptic voltage results in depression of EPSPs (Fig. 5A,B; 9 cells, 9 slices, 6 animals; p < 0.05, paired t test). NMDAR blockage with MK-801 at 50 μm does not change this result, as shown in Figure 5A (p > 0.1, t test). However, depression of EPSPs with this protocol can be abolished when the slices are treated with MK-801 at 100 μm (Fig. 5B; 9 cells, 9 slices, 6 animals; p > 0.1, paired t test), confirming our previous assumption that LTD would be more resilient to NMDAR blockage. Therefore, our findings pointed out that dark-reared gp91phox−/− animals were capable of expressing a NMDAR-dependent form of LTD, suggesting that low ROS might affect plasticity through modulation of NMDAR activity.

LTD of gp91phox−/− animals requires the activation of the NMDAR. A, Magnitude of EPSPs before and after induction of plasticity through the 0 mV conditioning protocol in DK animals. EPSP values are normalized with respect to the baseline. Slices treated with MK-801 (50 μm) are compared with untreated slices. LTD was successfully induced in untreated slices (9 cells, 9 slices, 6 animals, p < 0.05, paired t test) and treated slices (9 cells, 9 slices, 6 animals; p < 0.05, paired t test). The LTD of treated slices is not significantly different from that of untreated slices (p > 0.05, t test). Examples of EPSP traces show the amplitude before (black trace) and after (gray trace) induction. B, Magnitude of EPSPs before and after induction of plasticity through the 0 mV conditioning protocol in DK animals. EPSP values are normalized with respect to the baseline. Slices treated with MK-801 (100 μm) are compared with untreated slices. LTD was successfully induced in untreated slices (9 cells, 9 slices, 6 animals, p < 0.05, paired t test), but not in treated slices (9 cells, 9 slices, 6 animals; p > 0.1, paired t test). Examples of EPSP traces show the amplitude before (black trace) and after (gray trace) induction. C, Graph summarizing the effects of MK-801 on LTD in wild-type and gp91phox−/− animals. Synaptic changes are plotted against the MK-801concentration values. MK-801 significantly impairs induction of synaptic depression and this effect is similar in NW and DK (p < 0.001 and p > 0.1, respectively, two-way ANOVA).
Figure 5C summarizes all results obtained from the LTD experiments that adopted the NMDAR blocker. LTD sensitivity to different MK-801 concentration values is shown for NW and DK mice. NMDAR involvement is similar in both cases: a 100 μm concentration of MK-801 was needed to induce blockage of synaptic depression. We analyzed the two types of LTD by performing an analysis with a two-way ANOVA. The application of MK-801 affects the possibility of inducing synaptic depression significantly (p < 0.001), with no significant difference between the NW and DK groups (p > 0.1).
NOX2 and dark rearing modulate the activity of NMDARs
In a previous work, it was shown that synaptic plasticity is impaired in gp91phox−/− mice and that this is due to a deficiency in NMDAR functioning (De Pasquale et al., 2014). However, here, we demonstrated that plasticity “reopens” in the direction of LTD when gp91phox−/− animals are reared in the dark. It is known that dark rearing increases the efficacy of the NMDAR in layer 2/3 neurons (Yoshimura et al., 2003; Guo et al., 2012). This evidence suggests that dark exposure might allow partial recovery of NMDAR activity in gp91phox−/− animals. Such recovery would be sufficient to induce LTD. To test this hypothesis, a magnesium-free ACSF solution with an AMPAR blocker (DNQX, 50 μm) and a GABAR blocker (picrotoxin, 50 μm) were used to isolate the evoked EPSPs mediated by NMDAR activation (NMDAR-EPSPs). Under these conditions, NMDAR-EPSPs were recorded in NW (21 cells, 7 animals), DW (13 cells, 6 animals), NK (24 cells, 7 animals), and DK (21 cells, 7 animals) mice.
In all groups, postsynaptic responses disappeared after the application of MK-801 (100 μm). Figure 6B shows the results: in wild-type animals, dark rearing increases the NMDAR-EPSPs. NK mice instead appeared as the group exhibiting the lowest amplitudes of NMDAR-EPSPs. Dark exposure increases the responses of gp91phox−/− animals, but such an increase does not reach the same level of NW animals. A three-way ANOVA was realized (genotype, rearing condition, and intensity of stimulation as factors) to evaluate statistical significance and we found a significant difference among groups in terms of genotype, rearing conditions, and stimulation intensity (p < 0.001 for all comparisons). Genotype and rearing conditions modify NMDAR-EPSPs without significant interaction (p > 0.1); that is, genetic suppression of NOX2 does not prevent dark rearing from enhancing NMDAR-EPSPs. Increasing in the stimulation intensity is followed by increasing in the evoked response, but this relationship depends significantly on the genotype (p < 0.001), indicating that gp91phox−/− animals exhibit lower enhancements of NMDAR-EPSP compared with wild-type.

Dark rearing and genetic ablation of NOX2 modify synaptic plasticity and the NMDAR-mediated postsynaptic responses. A, Graph summarizing the combined effects of genetic suppression of NOX2 and dark rearing on plasticity. Synaptic changes are plotted as a function of the postsynaptic voltage clamp applied during the pairing protocol. Dark exposure facilitates induction of LTP in wild-type mice while promoting LTD in gp91phox−/− mice. Synaptic changes of wild-type animals are different from those of gp91phox−/− and this difference depends on rearing condition and induction protocols (p < 0.001, p < 0.01 and p < 0.05, respectively, three-way ANOVA). B, Magnitude of NMDAR-EPSPs (mV) recorded from slices obtained from NW (21 cells, 7 animals), DW (13 cells, 6 animals), NK (24 cells, 7 animals), and DK (21 cells, 7 animals) animals. The stimulation intensities are normalized with respect to the intensity value evocating the minimal response. For each group, example traces of recorded NMDAR-EPSP for 1.5, 2, and 2.5 normalized intensities are shown. Groups are statistically different in terms of genotype, rearing conditions, and stimulation intensity (p < 0.001 for all comparisons, three-way ANOVA).
These results demonstrate that dark rearing partially restores the reduction of NMDAR functioning caused by genetic deletion of NOX2. This finding may explain the unidirectional and partial recovery of plasticity that uniquely expresses as LTD.
NOX2 and dark rearing modulate the NR2A/NR2B ratio
NMDAR activity is regulated through the variable composition of two subtypes of NR2 subunits, NR2A and NR2B (Yashiro and Philpot, 2008). NMDAR subunits of the NR2B subtype are more efficient and the presence of this subunit is necessary for the induction of LTP (Yoshimura et al., 2003; Guo et al., 2012). In the visual cortex, the relationship between NR2A and NR2B subunits is one of the crucial factors that regulates synaptic plasticity in response to visual experience. Typically, animals reared in the dark show higher expression of NMDAR containing the NR2B subunits (Quinlan et al., 1999; Chen and Bear, 2007).
After observing that dark rearing and genetic suppression of NOX2 change the functionality of the NMDAR, we tested the hypothesis that visual experience and NOX2 may converge in modulating synaptic plasticity through modification of the NR2B/NR2A ratio in layer 2/3 neurons of V1. To evaluate this hypothesis, we performed immunohistochemical experiments that aimed to quantify the expression of NR2A and NR2B subunits in our experimental groups. Figure 7 shows the results obtained from the labeling of NR2A- and NR2B-positive neurons.

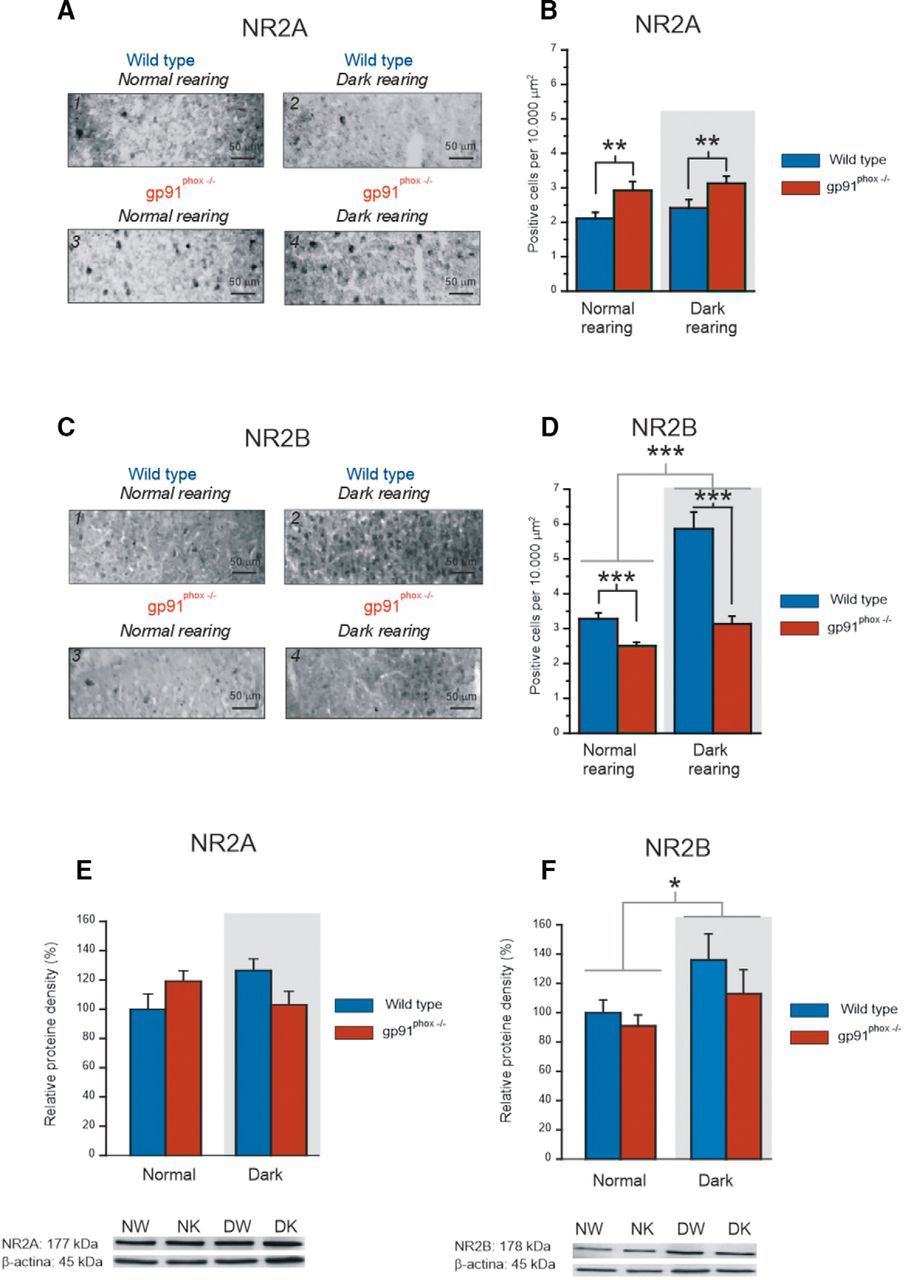
Genetic deletion of NOX2 and dark rearing change the NR2A/NR2B ratio. A, Examples of NR2A labeling in layer 2/3 of the visual cortex of NW animals (1), DW (2), NK (3), and DK (4). B, Graph showing the number of positive cells observed in a 10,000 μm2 area of layer 2/3 in NW (25 slices, 9 animals), DW (21 slices, 8 animals), NK (24 slices, 8 animals), and DK animals (26 slices, 9 animals). gp91phox−/− animals showed higher labeling of NR2A than the wild-type and dark rearing does not change this profile (p < 0.01, two-way ANOVA, for the genotype factor, p > 0.1 for the rearing condition factor). The difference between genotypes does not depend on the rearing condition (p > 0.1, two-way ANOVA for the interaction between genotype and rearing condition). C, Examples of NR2B labeling in layer 2/3 of the visual cortex of NW animals (1), DW (2), NK (3), and DK (4). D, Graph showing the number of positive cells observed in a 10,000 μm2 area of layer 2/3 in NW (28 slices, 10 animals), NK (26 slices, 8 animals), DW (28 slices, 9 animals), and DK (26 slices, 8 animals) animals. Wild-type mice exhibited higher NR2B labeling than gp91phox−/− animals (p < 0.001, two-way ANOVA, for the genotype factor). Dark rearing increases the expression of NR2B and this increase is greater for wild-type animals (p < 0.001, two-way ANOVA, for the rearing condition factor and p < 0.01 for the interaction between genotype and rearing condition). E, Graph showing the results of NR2A subunit expression of layer 2/3 obtained from Western blot experiments performed in NW (20 animals), DW (20 animals), NK (20 animals), and DK animals (20 animals). Western blotting samples for each group are shown. The NR2A densities of DW, NK, and DK were normalized to the protein density value obtained from the NW. No statistic difference was found in terms of genotype and rearing condition (p > 0.1, two-way ANOVA). F, Graph showing the results of NR2B subunit expression of layer 2/3 obtained from Western blot experiments performed in NW (19 animals), DW (18 animals), NK (18 animals), and DK (18 animals) animals. Western blotting samples for each group are shown. The relative NR2B densities of DW, NK, and DK were normalized to the protein density value obtained from the NW. Dark rearing increases the relative expression of the NR2B subunit (p < 0.05, two-way ANOVA). *p < 0.05, **p < 0.01, ***p < 0.001.
We analyzed these results by using a two-way ANOVA considering genotype and rearing condition as factors. For NR2A, NK animals (Fig. 7A,B; NK: 24 slices, 8 animals; NW: 25 slices, 9 animals) exhibit higher concentration of NMDAR containing NR2A, compared with NW mice. Dark exposure does not change this profile (Fig. 7A,B; DW: 21 slices, 8 animals; DK: 26 slices, 9 animals). The groups are statistically different in terms of genotype (p < 0.01), but do not differ by rearing condition (p > 0.1) and the difference determined by genotype does not depend on the rearing condition (p > 0.1). For NR2B, NW have a higher concentration of NR2B-positive cells compared with NK (Fig. 7C,D; NW: 28 slices, 10 animals; NK 26 slices, 8 animals). When wild-type and gp91phox−/− animals are reared in the dark (Fig. 7C,D; DW: 28 slices, 9 animals; DK: 26 slices, 8 animals), the expression of NR2B subunit increases and such an increase is higher for the wild-type animals. In fact, the groups are statistically different in terms of genotype (p < 0.001) and rearing condition (p < 0.001). The effect of dark rearing is stronger for wild-type mice compared with gp91phox−/− mice (p < 0.01).
We next aimed to implement the results obtained from immunohistochemistry with Western blot experiments. Therefore, we quantified the relative expression of NR2A and NR2B subunits of tissue samples obtained from the visual cortical layer II/III from the four experimental groups (NW, DW, NK, and DK). For NR2A expression (Fig. 7E; NW: 20 animals, DW: 20 animals, NK: 20 animals and DK animals: 20 animals), the groups do not differ statistically by genotype and rearing condition (p > 0.1, two-way ANOVA). Nevertheless, regarding the NR2B subunit (NW: 19 animals; DW: 18 animals, NK: 18 animals and DK: 18 animals), we found that that dark rearing significantly increases the protein concentration, independently of genotype (p < 0.05, two-way ANOVA).
Therefore, results obtained from the immunohistochemistry experiments indicated a NR2A/NR2B ratio increase in the cell bodies of NK animals compared with other groups. This effect, however, was not confirmed by Western blot analysis, which accounts for the protein concentration in the cell. Conversely, both immunohistochemistry and Western blot data pointed out a dark rearing-induced increase in the concentration of the NR2B subunit.
Dark rearing modulates the NR2B component response of NMDAR-EPSPs
After assessing the alteration in the protein levels of NR2B subunit imposed by dark rearing and genetic suppression of NOX2, we decided to test whether these changes on NR2B protein levels indeed modify the NMDAR functioning. To address this issue, we applied the highly NR2B-selective antagonist CP-101,606 (20 μm) and recorded the NMDAR-mediated EPSP for 20 min, thus evaluating the contribution of the NR2B subunit to the response magnitude. To isolate NMDAR responses, we used a magnesium-free ACSF solution with an AMPAR blocker (DNQX, 50 μm) and a GABAR blocker (picrotoxin, 50 μm). We first compared the effects of CP-101,606 and its vehicle (DMSO) in the NW animals. Reduction of NMDAR responses was evaluated by averaging the EPSPs recorded during the last 5 min. Although DMSO did not alter the EPSP amplitude (Fig. 8A: 7 cells, 7 slices, 4 animals p > 0.1, paired t test), CP-101,606 reduced NMDAR functioning significantly (7 cells, 7 slices, 4 animals p < 0.001, paired t test).

Dark rearing modifies the contribution of NR2B subunit in the NMDAR-mediated postsynaptic responses. A, Magnitude of NMDAR-EPSPs recorded from slices of NW animals before and after exposure to CP-101,606 (20 μm; NR2B component blocker) and vehicle (DMSO). Percentage values are reported as referred to the NMDAR-EPSPs average recorded before the drug application. Representative NMDAR-EPSP traces before (black trace) and after (dark gray trace) CP 101,606 or vehicle are shown. Complete extinguishing of NMDAR-EPSP through MK-801 application (100 μm; light gray trace) is also shown. CP-101,606 application significantly reduces the magnitude of NMDAR-EPSPs (7 cells, 4 animals; p < 0.001, paired t test), whereas vehicle did not have any significant effect (7 cells, 4 animals; p > 0.05, paired t test). B, Magnitude of NMDAR-EPSPs recorded from slices obtained from NW (7 cells, 4 animals), DW (8 cells, 5 animals), NK (9 cells, 5 animals), and DK (8 cells, 5 animals) animals before and after CP-101,606 application. Examples of NMDAR-EPSP traces before (black trace) and after (gray trace) CP-101,606 application are shown for each group. Dark reading of wild-type and gp91phox−/− animals intensifies significantly the NMDA-EPSP magnitude reduction imposed by CP-101,606, demonstrating an increase of NR2B contribution in both groups (p < 0.01, two-way ANOVA).
We then decided to quantify the NR2B component of NMDAR-mediated EPSPs in the other experimental groups: DW (8 cells, 8 slices, 5 animals), NK (9 cells, 9slices, 5 animals), and DK (8 cells, 8 slices, 5 animals). Our results demonstrated that NR2B blockage reduces the NMDAR-EPSP amplitude in all analyzed conditions (Fig. 8B). We performed a two-way ANOVA test (genotype and rearing condition as factors), which demonstrated a significant difference among groups in terms of rearing condition (p < 0.01), showing that dark rearing increases the NR2B component of the NMDAR response in both wild-type and gp91phox−/− animals.
These results indicate a dark-rearing-induced increase of NR2B function, which could be due to a higher protein concentration in the plasma membrane that modifies the functionality of the NMDAR directly.
Metaplastic effect of NOX2 and dark rearing on basal synaptic transmission
In previous sections, we showed that visual deprivation may promote opposite signs of synaptic change depending on NOX2 functioning. We also showed that these depend on dark rearing and NOX2 inhibition having opposite effects on NMDAR activity. Based on these observations, we hypothesized that basal synaptic transmission could be altered as a result of these two metaplastic factors interacting with spontaneous neuronal activity. According to our hypothesis, dark rearing should increase synaptic strength in wild-type animals while leading to synaptic depression in gp91phox−/− animals.
Therefore, we performed a current step stimulation (1.0, 1.5, 2.0, and 2.5×) in layer 4 of V1 using the minimum current (1×) to evocate synaptic responses in neurons of layer 2/3 in NW (20 cells, 5 animals), DW (25 cells, 6 animals), NK (19 cells, 5 animals), and DK (14 cells, 5 animals) slices. Our results demonstrates DW animals have a higher synaptic response magnitude provided by 1.5, 2.0, and 2.5 of stimulation intensity (Fig. 9A). The analysis performed with a three-way ANOVA (genotype, rearing, and intensity as factors) demonstrates there are significant differences among groups in terms of genotype (p < 0.05), rearing (p < 0.01), and stimulation intensity (p < 0.0001), with a significant interaction between genotype and rearing (p < 0.05).

Dark rearing and genetic ablation of NOX2 modify postsynaptic response. A, Magnitude of the synaptic response (mV) recorded from slices obtained from NW (20 cells, 5 animals), DW (25 cells, 6 animals), NK (19 cells, 5 animals), and DK (14 cells, 5 animals) animals. The stimulation intensities were normalized with respect to the intensity value evocating the minimal synaptic response. Representative traces of recorded postsynaptic response for 2.5 normalized intensity are shown for each group. Groups are statistically different in terms of genotype and rearing conditions, with the rearing effect being dependent on genotype (p < 0.05 and p < 0.01, respectively; p < 0.05 for the rearing condition–genotype interaction, three-way ANOVA). B, Graph showing the minimum current intensity (normalized to the NW average value) applied to evoke a synaptic response for the NW (20 cells, 5 animals), DW (25 cells, 6 animals), NK (19 cells, 5 animals), and DK (13 cells, 5 animals) experimental groups. The minimal current intensity used to evoke an EPSP in DW slices was lower compared with DK (p < 0.001 for the genotype factor and p < 0.01 for the rearing condition–genotype interaction, two-way ANOVA), showing that dark exposure increases excitability in wild-type animals, whereas it reduces it in gp91phox−/− animals. ***p < 0.001.
Finally, we aimed to verify whether NOX2 and visual experience effects on synaptic plasticity also reflect on the minimal stimulation required to evoke synaptic responses in layer 2/3 neurons (Fig. 9B). Two-way ANOVA analysis (genotype and rearing condition as factors) demonstrated a significant difference among groups in terms of genotype (p < 0.01) and a significant interaction between genotype and rearing condition (p < 0.05).
Therefore, as predicted by our hypothesis, dark rearing showed opposite effects on basal synaptic transmission depending on NOX2 functioning. In wild-type animals, visual deprivation increases synaptic strength, reflecting higher voltage values of EPSP saturation and lower current of minimal stimulations. In the gp91phox−/− animals instead, dark rearing leads to synaptic efficacy reduction, which in turns increases the amount of current required to evoke excitatory responses.
Discussion
In this work, we aimed to study the crosstalk between visual experience and redox signaling and how it impinges on synaptic changes of the visual cortex. The metaplastic effects of dark exposure on visual cortical plasticity have been widely documented by previous studies (Kirkwood and Bear, 1995; Guo et al., 2012). Our study introduces the first evidence that such effects can be modulated by ROS. We showed that inhibition of NOX2 changes the pairing protocol plasticity curve, overturning the effects of dark rearing from synaptic potentiation to synaptic depression.
Comparison of gp91phox−/− and wild-type animals confirmed that the activation of NOX2 is essential to trigger LTP and LTD in normal rearing conditions, as seen in a previous study (De Pasquale et al., 2014). However, we found that gp91phox−/− animals can undergo LTD when reared in the dark. Therefore, our first important result indicated that impairing the activity of NOX2, leading to less ROS production in neurons, changes the polarity of experience-dependent synaptic plasticity.
Factors that modify NMDAR function also change the relationship between postsynaptic depolarization and synaptic change (Abraham and Bear, 1996; Bear, 2003; Philpot et al., 2003). NMDAR efficiency is enhanced by visual deprivation and diminished by NOX2 inactivity. Based on this, we hypothesized that metaplastic effects of visual deprivation and/or NOX2 involve changes in the NMDAR functioning. As a first step in this direction, we demonstrated that the onset of LTD in dark-reared gp91phox−/− animals depends on the activation of the NMDAR. Interestingly, the blockade of LTD in this case requires the same concentration of the NMDA blocker that we applied to suppress depression in wild-type animals, suggesting that the two induction processes share similar conditions in terms of NMDAR contribution.
Consistently with previous studies (Kirkwood and Bear, 1995; Kirkwood et al., 1995; Quinlan et al., 1999; Chen and Bear, 2007; Guo et al., 2012), we found that dark exposure increased the NMDAR-mediated postsynaptic responses in wild-type animals. This finding explains the upward shift of the plasticity curve toward LTP. Nevertheless, genetic deletion of NOX2 downregulates NMDAR function, preventing synaptic change in both directions. When gp91phox−/− animals were reared in the dark, the NMDAR response increased significantly despite such an increase being moderated. Most likely, the level of NMDAR activity in dark reared gp91phox−/− animals was insufficient for the expression of LTP, but enough to induce LTD. These conclusions are summarized in Figure 10.

Model summarizing the metaplastic effects of dark rearing and genetic suppression of NOX2. For each experimental group, synaptic plasticity and NMDAR activity are represented. Top, Synaptic change is plotted against the depolarization value (mV) applied during the pairing induction. Bottom, Corresponding activation of the NMDAR receptor, highlighting the thresholds required to induce LTP and LTD.
Finally, we analyzed the expression of the NR2A and NR2B subunits to provide further evidence that the metaplastic effects that we observed implied changes in NMDAR functioning. NMDARs containing the NR2B subunit are able to carry more Ca2+ inside the postsynaptic neuron (Erreger et al., 2005; Sobczyk et al., 2005), making this subunit essential for the induction of LTP (Quinlan et al., 1999; Yoshimura et al., 2003; Chen and Bear, 2007; Guo et al., 2012). In normal rearing conditions, wild-type mice show more expression of NR2B subunits, whereas the gp91phox−/− group exhibits higher expression of the NR2A subtype. These results could partially explain the deficit of synaptic plasticity associated with genetic suppression of NOX2. Dark rearing promoted a twofold increment of the NR2B subunit expression in wild-type mice and this result was expected based on the electrophysiological results that we described here for the same group: the suppression of LTD, the higher probability of LTP induction, and the higher NMDAR-mediated response.
Sensory information entering the visual cortex modifies the NR2A/NR2B ratio through metaplastic processes that depend upon experience-related neural activity (Yashiro and Philpot, 2008). NMDAR activation during synaptic stimulation appears to facilitate transcription of NR2A and suppress translation of NR2B (Hoffmann et al., 2000; Yashiro and Philpot, 2008), so dark-reared animals present higher expression of NR2B. Cellular mechanisms underlying such changes are still unclear, although it has been proposed the PKA/CREB pathway could mediate the activity-dependent increases of NR2A subunit expression (Yashiro and Philpot, 2008). In our data, visual deprivation combined with genetic ablation of NOX2 produces a significant increase in NR2B labeling. This is consistent with our electrophysiological data because the NMDAR-mediated postsynaptic responses of the gp91phox−/− animals were stronger after visual deprivation. In the same direction, the contribution of NR2B component in the NMDA-mediated EPSPs of gp91phox−/− and wild-type animals was increased after dark rearing.
Our results suggest that ROS production is important to promote synaptic strengthening. Accordingly, emerging evidence indicates a key role of ROS in enhancing the activity of several protein kinases involved in the induction and maintenance of LTP. Genetic or pharmacological manipulations that reduce the generation of ROS affect LTP negatively in multiple structures of the nervous system, suggesting that appropriated redox states are crucial for synaptic potentiation (Gahtan et al., 1998; Klann et al., 1998; Klann, 1998; Kishida et al., 2006; Gao et al., 2007; De Pasquale et al., 2014; Ji et al., 2015). ROS generation via NOX2 is required for NMDAR-dependent stimulation of several proteins required for LTP in several brain structures, including the visual cortex (Di Cristo et al., 2001; Frankland et al., 2001; Knapp and Klann, 2002; Kishida et al., 2005; Giovannini, 2006; Massaad and Klann, 2011). Furthermore, generation of ROS inhibits the function of K+ channels and enhances the levels of intracellular Ca2+, facilitating the induction of LTP (Marengo et al., 1998; Hidalgo, 2005; Nazıroğlu, 2011; Lee et al., 2013; Sahoo et al., 2014). Specific situations that might lead to differential levels of neuronal ROS for metaplastic purposes are still unclear because investigations about redox signaling in physiological mechanisms are relatively recent. However, there is some evidence suggesting a possible role of ROS in the maturation of the visual cortical circuitry.
In the visual cortex, early age is a period of high excitatory activity, intense synaptic strengthening, and the formation of new neural connections (Kirkwood and Bear, 1995; Morales et al., 2002; Yoshimura et al., 2003; Tau and Peterson, 2010; Lehmann et al., 2012). The probability of inducing LTP is particularly high within the first 3 weeks and progressively decreases with aging (Yoshimura et al., 2003; De Pasquale et al., 2014). Glutamatergic stimulation of excitatory synapses increases intracellular and extracellular levels of ROS mediated by NOX2 (Brennan et al., 2009; Guemez-Gamboa et al., 2011; Reyes et al., 2012), suggesting that redox signaling could be a mechanism supporting LTP in neurons sharing a recent history of intense neural activity. Consistent with this view, cortical neurons are known to produce high levels of ROS in young brains and the NOX2 complex is an important source involved in this process (Tsatmali et al., 2005; Dickinson et al., 2011; Wilhelm et al., 2016). Superoxide produced via NOX2 undergoes fast transmutation to hydrogen peroxide, which can act as an autocrine and paracrine signal (Covarrubias et al., 2008). Hydrogen peroxide diffusion through membranes may determine the propagation of redox signals to a population of neurons, coordinating developmental events involved in the formation of neuronal circuitries (Coyoy et al., 2013). The fact that gp91phox−/− animals exhibit an anticipated and more severe age-dependent decline of visual cortical LTP supports this hypothesis (De Pasquale et al., 2014).
Synaptic stimulation in layer 2/3 of the visual cortex may result in two contrasting metaplastic processes: neuronal activity may favor LTP through increased production of ROS, but at the same time, experience-derived synaptic activation may promote the expression of the NR2A subunit, limiting the occurrence of synaptic potentiation. This means that the effects of dark rearing on plasticity may depend on the general state of neuronal activity, which may not be a simple reflection of visual stimulation. When feedforward inputs from layer 4 are silenced by visual deprivation, neurons of layer 2/3 are still considerably stimulated by intracortical information coming from nonvisual brain areas (Goel et al., 2006; Petrus et al., 2015; Burkhalter, 2016; Pafundo et al., 2016). In this context, the effects of dark rearing would depend on the general state of neuronal activity. When the overall excitatory activity produces considerable amounts of ROS, visual deprivation upregulates the LTP mechanisms to optimize the dynamic range for synaptic modification. Despite this, if reduction of synaptic activity is more general and not restricted to visual information flow, then LTD becomes the predominant form of plasticity. Therefore, the reduced visual stimulation associated with ROS deficiency would favor synaptic elimination rather than reinforcement.
In conclusion, we found that NOX2 activation and visual experience can interact to regulate plasticity and this effect is mediated via changes in the NMDAR functioning. Dark rearing facilitates synaptic potentiation, but ROS production is required for this outcome. If ROS cellular levels are low, then synaptic depression becomes the main form of synaptic modification. Together, our findings suggest that NOX2-derived ROS could be important modulators of cortical neuroplasticity, possibly acting as an activity-dependent factor of positive synaptic selection. This process could be a potential mechanism regulating the maintenance/elimination of neural connections based on the history of neural activity.
Footnotes
This work was supported by grant 2012/07522-0, grant 2011/23874-0 and grant 2016/2584-0, São Paulo Research Foundation (FAPESP).
The authors declare no competing financial interests.
- Correspondence should be addressed to Roberto De Pasquale, Universidade de São Paulo, Sala 239, Departamento de Fisiologia e Biofísica, Av. Prof. Lineu Prestes, 1524, ICB, Cidade Universitária, Butantã, São Paulo, SP 05508-000. robertode{at}usp.br


