

Article Figures & Data
Figures
- Figure 1.
Identification, localization, and binding properties of Copine-6. A, Diagram of the structure of Copine-6. Boundaries of C2A, C2B, and vWA domains are indicated below. Parallel bars represent positions of divalent cation binding sites within the domains. B, Proteins identified by pulldown reaction with GST-syb2 from rat brain extract in the presence of Ca2+. Proteins were eluted from GST-beads (control) or GST-syb2 by removing Ca2+, separated by SDS-PAGE and silver stained. The upper band labeled with asterisk contained Munc18-1, and the lower band contained comigrating synaptotagmin 1, synaptotagmin 2, and copine-6 (with minor amount of copine7 also present). Several low-molecular weight bands contained EF-hand motif proteins. All biochemical experiments were replicated 3 times with similar results. C, Representative confocal images of cultured hippocampal neurons immunostained with antibodies against endogenous copine-6 (left) and syb2 (middle). Right (merged image), White arrows indicate the colocalization of copine-6 and syb2 at hippocampal synaptic boutons. D, Intensity plot of endogenous copine-6 and syb2 from the merged image. The mean Pearson correlation coefficient for their colocalization is indicated (Pearson correlation coefficient = 0.50 ± 0.02, calculated using n = 15 images from 3 independent cultures). E, Representative confocal images of cultured hippocampal neurons immunostained with antibodies against endogenous copine-6 (left) and synapsin 1 (middle). Right (merged image), White arrows indicate the colocalization of copine-6 and synapsin 1 at hippocampal synaptic boutons. F, Intensity plot of endogenous copine-6 and synapsin 1 from the merged image. The mean Pearson correlation coefficient for their colocalization is indicated (Pearson correlation coefficient = 0.56 ± 0.03, calculated from n = 10 images from 2 independent cultures). G, Copine-6 binds to SNAREs in the presence of Ca2+. GST alone or GST fused to various SNARE proteins (without transmembrane region, except SNAP-25) were immobilized on glutathione Sepharose and incubated with extracts of HEK cells transfected with HA-tagged copine-6 in the presence (top) or absence of Ca2+ (middle). The eluted proteins (also in F,G) were analyzed by immunoblotting (top, middle), and GST beads were analyzed by Coomassie staining (bottom). H, Copine-6 binds to VAMPs in the presence of Ca2+. GST or GST fused to various VAMPs (without transmembrane regions) were immobilized on glutathione Sepharose and incubated with extracts of HEK cells transfected with HA-tagged copine-6 in the presence (top, bottom) or absence of Ca2+ (middle). I, The C-terminal linker region of syb2 is required for Ca2+-dependent binding to copine-6. GST or GST fused to various syb2 (without transmembrane regions) proteins were immobilized on glutathione Sepharose and incubated with extracts of HEK cells transfected with HA-tagged copine-6 in the presence (top, bottom) or absence of Ca2+ (middle). Syb2 WA mutant contains two alanine substitutions of vicinal W89A/W90A; syb2 2–84 lacks 10 juxtamembrane C-terminal residues. J, GST alone or GST fused to Syb2 and VAMP4 proteins were immobilized on glutathione Sepharose and incubated with extracts of HEK293T cells transfected with truncated HA-tagged copine-6 constructs (C2AB, vWA, or both) in the presence of Ca2+. After washing, proteins were eluted by removing Ca2+ and analyzed by immunoblotting with HA antibody.
- Figure 2.
Copine-6 is not critical for maintaining synchronous-evoked neurotransmission. A, Bar graph represents copine-6 mRNA levels in rat primary hippocampal cultures under control condition (uninfected) or after infection with an empty (L307) or shRNA-producing lentivirus. Data are from representative experiment performed in quadruplicates. The best knockdown efficiency was observed for two lentiviruses termed KD1 and KD2, which were used throughout the study. B, Western blot analysis of rat hippocampal cultures infected with L307 virus (control) or copine-6 knockdown viruses (KD1 and KD2). Neurons from 4 coverslips were pooled together for each condition. Syx1, Syntaxin 1; Syp1, Synaptophysin 1. Both KD constructs reduced copine-6 expression substantially compared with the neurons infected with L307 virus. C, Representative IPSC traces of postsynaptic response triggered by a paired-pulse stimulation from noninfected control (Ctrl), mOrange-copine-6 (Cop6) overexpressing, empty L307 vector virus (L307) infected, and copine-6 knockdown (KD1 and KD2) hippocampal neurons in the presence of physiological Ca2+. Stimulus intervals: 1000 (1 Hz), 100 (10 Hz), 50 ms (20 Hz). D, Statistical analysis of paired-pulse ratio (P2/P1) shows no significant differences under the various conditions stated above. 1 Hz, Ctrl 0.8 ± 0.03, n = 16; and Cop6 0.8 ± 0.04, n = 14, p > 0.7, compared with Ctrl; L307, 0.8 ± 0.04, n = 12; KD1, 0.9 ± 0.06, n = 10, p1 > 0.6, KD2, 0.9 ± 0.03, n = 15, p2 > 0.6, compared with L307. 10 Hz: Ctrl, 0.7 ± 0.06, n = 23; Cop6, 0.7 ± 0.08, n = 15, p > 0.8, compared with Ctrl; L307, 0.6 ± 0.06, n = 19; KD1, 0.6 ± 0.09, n = 13, p1 > 0.5; KD2, 0.7 ± 0.06, n = 15, p2 > 0.1, compared with L307. 20 Hz: Ctrl, 0.5 ± 0.06, n = 19; and Cop6, 0.5 ± 0.06, n = 19, p > 0.9 compared with Ctrl; L307, 0.4 ± 0.06, n = 17; KD1, 0.5 ± 0.07, n = 19, p1 > 0.7; KD2, 0.5 ± 0.06, n = 15, p2 > 0.2, compared with L307. E, Representative IPSC traces during 1 Hz stimulation from control neurons and neurons infected with lentiviruses expressing Cop6, L307 control, KD1, and KD2. F, Average cumulative charge histograms from the first IPSC trace under 1 Hz stimulation depicting the synchronization of synaptic responses from cultured hippocampal neurons described above, and no statistical significance was observed among different conditions: Ctrl, n = 12; Cop6, n = 12; L307, n = 11; KD1, n = 10; KD2, n = 10.
- Figure 3.
Copine-6 suppresses presynaptic spontaneous vesicle fusion. A, Example traces of mEPSC recording from control hippocampal neurons (Ctrl), neurons overexpressing copine-6 and copine-6 knockdown shRNA constructs (KD1 and KD2) in the presence of 2 mm Ca2+. B, C, Quantification of mEPSC frequency (B) and amplitude (C) from control, copine-6 overexpression, and copine-6 KD neurons. Overexpressing copine-6 suppressed mEPSC frequency and knockdown of copine-6 increased mEPSC frequency (Ctrl, 2.0 ± 0.2 Hz, n = 16; HA-Cop6, 1.0 ± 0.2 Hz, n = 15, p = 0.002; KD1, 4.0 ± 1.1 Hz, n = 11, p = 0.04; KD2, 4.9 ± 1.1 Hz, n = 9, p = 0.001). The average amplitudes of each condition were not significantly different (19.1 ± 1.5 pA for Ctrl, 20.8 ± 1.6 pA for HA-Cop6, 18.1 ± 1.3 pA for KD1, and 18.1 ± 1.5 pA for KD2). D, Example traces of mIPSCs recorded in noninfected control (Ctrl), copine-6 (Cop6) overexpression, and copine-6 knockdown (KD1 and KD2) hippocampal neurons in the presence of 2 mm Ca2+. E, F, Quantification of average mIPSC frequency (E) and amplitude (F) of the cells as mentioned in A. Copine-6 overexpression resulted in suppression on spontaneous release rate with no change of amplitudes. Ctrl,1.2 ± 0.1 Hz, 21.2 ± 1.6 pA, n = 14; Cop6, 0.8 ± 0.1 Hz, 18.7 ± 1.6 pA, n = 14; L307, 1.1 ± 0.2 Hz, 18.2 ± 1.2 pA, n = 11; KD1, 1.8 ± 0.2 Hz, 18.6 ± 1.1 pA, n = 15, KD2, 2.1 ± 0.2 Hz, 20.9 ± 1.4 pA, n = 15. G, Left, Representative single-vesicle fusion spontaneous fusion events measured with vGlut1-pHluorin in control (light gray) and copine-6 KD (black) neurons. Right, Average fluorescence traces from single-vesicle spontaneous fusion events in control neurons (light gray) and copine-6 KD neurons (black). Inset, Schematic of vGlut1-pHluorin fusion protein in a synaptic vesicle. H, Cumulative histogram of frequency of single-vesicle spontaneous fusion events for control and copine-6 KD neurons. Cumulative distributions were compared using Kolmogorov–Smirnov test. ****p < 0.0001. Inset, Bar graph represents the average number of events per minute for both conditions: control, 0.70 ± 0.02 events/min, copine-6 KD, 2.12 ± 0.04 events/min. Means were compared using Mann–Whitney test. ****p < 0.0001. Data from 5 independent cultures. Control, 1237 boutons from 12 coverslips; copine-6 KD, 976 boutons from 7 coverslips. *p < 0.05. **p < 0.01.
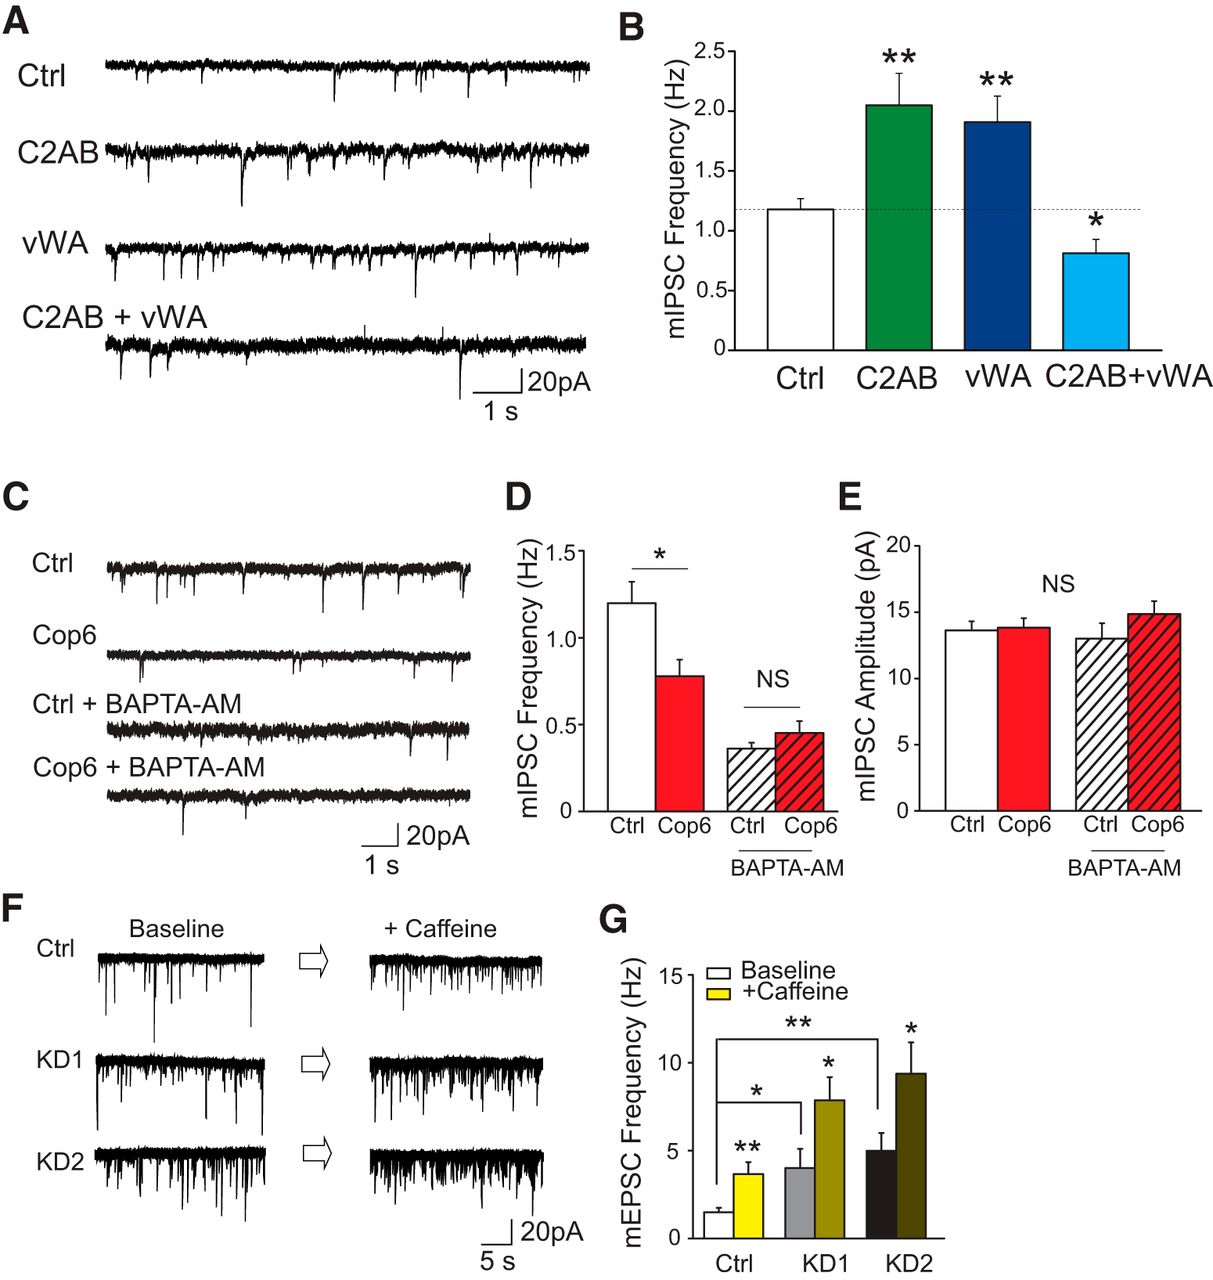
- Figure 4.
Copine-6 regulates spontaneous neurotransmission in a Ca2+-dependent manner. A, Example traces of mIPSC recording from WT neurons (Ctrl) and neurons overexpressing copine-6 truncation mutants (C2AB, vWA, or coexpressing both). B, Quantification of mIPSC frequency of the four conditions shown in A. Expressing copine-6 mutants (C2AB or vWA) alone increased the mIPSC frequency, whereas coincubating them suppressed mIPSCs events. Ctrl, 1.2 ± 0.1 Hz, n = 19; C2AB, 2.0 ± 0.3 Hz, n = 15, p = 0.002; vWA, 1.9 ± 0.2 Hz, n = 14, p = 0.002; C2AB+vWA, 0.8 ± 0.1 Hz, n = 15, p = 0.02. C, Example traces of mIPSCs recorded from wild-type and copine-6-overexpressing neurons without or with 30 μm BAPTA-AM treatment. D, E, Quantification of average mIPSC frequency (D) and amplitude (E) of the cells as mentioned in D. Ctrl, 1.2 ± 0.1 Hz, 13.6 ± 0.7 pA, n = 16 without and 0.4 ± 0.03 Hz, 13.8 ± 0.7 pA, n = 15 with BAPTA-AM treatment; Cop 6, 0.8 ± 0.1 Hz, 13 ± 1.1 pA, n = 18 without and 0.5 ± 0.1 Hz, 14.9 ± 1.0 pA, n = 17 with BAPTA-AM treatment. G, Example traces of mEPSCs of noninfected control and copine-6 knockdown neurons before and after 20 mm caffeine treatment. H, Quantification of average mEPSC frequency of the cells as mentioned in G. Ctrl, 1.5 ± 0.2 Hz before and 3.7 ± 0.7 Hz after caffeine treatment, n = 11; KD1, 4.0 ± 1.1 Hz before and 7.9 ± 1.3 Hz after caffeine treatment, n = 11; KD2, 5.0 ± 1 Hz before and 9.4 ± 1.8 Hz after caffeine treatment, n = 9. Error bars indicate ± SEM. *p < 0.05. **p < 0.01.
- Figure 5.
Syb2 is required for copine-6-mediated regulation of spontaneous neurotransmitter release. A, Recordings were performed (in 2 mm Ca2+) in syb2-deficient neurons under various conditions: noninfected cells (Ctrl), syb2-deficient neurons expressing GFP alone (GFP), full-length mOrange-copine-6 (Cop6), wild-type syb2 and GFP (syb2 + GFP), wild-type Sy2 and mOrange-copine-6 (syb2 + Cop6), mutant syb2 WA and GFP (syb2 WA + GFP), mutant syb2 WA and mOrange-copine-6 (syb2 WA + Cop6), or copine-6 knockdown constructs (KO + KD1, KO+KD2). Representative traces of mIPSC recordings in syb2-deficient neurons under different conditions as stated above: Ctrl, GFP, Cop6, syb2 + GFP, syb2 + Cop6, syb2 WA + GFP, and syb2 WA + Cop6. B, C, Quantification of average mIPSC frequency (B) and amplitude (C) from neurons metioned in A. Overexpression of copine-6 in syb2-deficient neurons did not change mIPSC rate and amplitude Ctrl, 0.2 ± 0.02 Hz and 12.5 ± 0.6 pA, n = 24; GFP, 0.2 ± 0.04 Hz and 12.5 ± 0.8 pA, n = 12; Cop6, 0.2 ± 0.05 Hz and 11.7 ± 0.7 pA, n = 12. Copine-6-overexpressing suppressed mIPSCs when wild-type syb2 expression rescued spontaneous neurotransmission but showed no impact on mutant syb2 WA expression. syb2 + GFP, 1.3 ± 0.2 Hz and 13.3 ± 0.8 pA, n = 18; syb2 + Cop6, 0.6 ± 0.1 Hz and 13.8 ± 0.7 pA, n = 21; syb2 WA + GFP, 2.5 ± 0.5 Hz and 16.2 ± 1.2 pA, n = 23; syb2 WA + Cop6, 2.5 ± 0.4 Hz and 14.7 ± 0.8 pA, n = 23. D, Representative traces of mIPSC recordings from syb2 KO control cells and syb2 KO cells with copine-6 knockdown: Ctrl, KO+KD1, and KO+KD2. E, F, Quantification of average mIPSC frequency (E) and amplitude (F) from neurons described in D. Knockdown of endogenous copine-6 in syb2-deficient neurons caused a significant elevation of spontaneous release frequency with no change of amplitude compared with the control cells. Ctrl, 0.2 ± 0.02 Hz and 12.7 ± 0.6 pA, n = 34; KO + KD1, 0.4 ± 0.07 Hz and 12.6 ± 0.5 pA, n = 21, p1 = 0.002; KO + KD2, 0.46 ± 0.06 Hz and 14.1 ± 0.5 pA, n = 21, p2 = 0.00004. The total analyzed neurons were from five independent cultures. G, Representative traces of mIPSC recordings from WT and syt1 KD neurons as well as syb2 KO neurons and syb2 KO neurons with syt1 KD. H, I, Quantification of average mIPSC frequency (H) and amplitude (I) from neurons described in G. Syt1 KD neurons exhibited significantly higher mIPSC frequency, whereas syb2 KO neurons had significantly lower mIPSC frequency regardless of syt1 loss of function compared with WT. ****p < 0.0001. Data from 3 independent cultures. WT, n = 8, Syt1KD: n = 9, syb2KO, n = 7, syb2KO+Syt1KD, n = 11. *p < 0.05. **p < 0.01. ***p < 0.001.


