

Article Figures & Data
Figures
- Figure 1.
CRFR1 is highly expressed in GrCs of mice. a, Reporter mouse line expressing GFP under the CRFR1 promoter and tdTomato in CRF expressing cells was generated by crossbreeding the CRFR1GFP mouse line with CRF-Cre mouse line and mice conditionally expressing tdTomato. b–f, Sagittal cerebellar slice of the reporter line (b) with cortical magnifications (c–f) expressing GFP under the CRFR1 promoter and tdTomato in CRF-expressing neurons; Purkinje cells are stained with calbindin (cyan; scale bar, 25 μm). g–i, Magnification of the GrC layer. g, High magnification of GrCs clearly showing a dense population of GrCs expressing CRFR1 in the granular layer. h, Glomeruli with tdTomato signal reaching the granular layer showing that mossy fibers expressing CRF reach the GrC layer. i, Merged image of glomeruli expressing tdTomato (CRF; red) and GrCs expressing GFP (CRFR1; green). j, Mossy and climbing fibers expressing tdTomato in CRF-positive cells in a cleared mouse brain. PN, Pontine nucleus; IO, inferior olive; ML, molecular layer; PC, Purkinje cell layer; GC, GrC layer.
- Figure 2.
Establishment of a mouse line depleted of CRFR1 specifically in cerebellar GrCs. The α6 subunit levels in Δα6-Cre line cerebella and the Cre line granular specificity are presented in Figure 2-1. a, Schematic representation of cell-specific deletion of CRFR1 using the Cre-lox system. b, CRFR1 mRNA is reduced by >90% in the cerebella of Cre-expressing mice (CRFR1cKO; N = 8, 6; p = 0.002; data are presented as fold change). c, No significant reduction in CRFR1 mRNA levels was detected in extracerebellar regions in CRFR1cKO (mRNA levels presented are normalized to control levels, represented as dashed gray line, N = 3–6 per group, p = 0.373–0.991; data are presented as fold change). Image analysis of colocalization levels of Cre activity in the Δα6-Cre line and CRFR1 expression are presented in Figure 2-2. d–f, Cerebellar structural properties. No differences in cerebellar weight (N = 8, 7; p = 0.284; d) or cerebellar volume (quantification and representative image of MRI scan, N = 7, 8; p = 0.277; e) were detected. f, No differences in GrC soma size or number of dendrites were detected in CRFR1cKO compared with control mice (diameter: n = 43,51 cells, N = 2, p = 0.82; dendrites N = 3, 3; p = 0.45). Data are represented as mean ± SEM. ***p < 0.005.
- Figure 3.
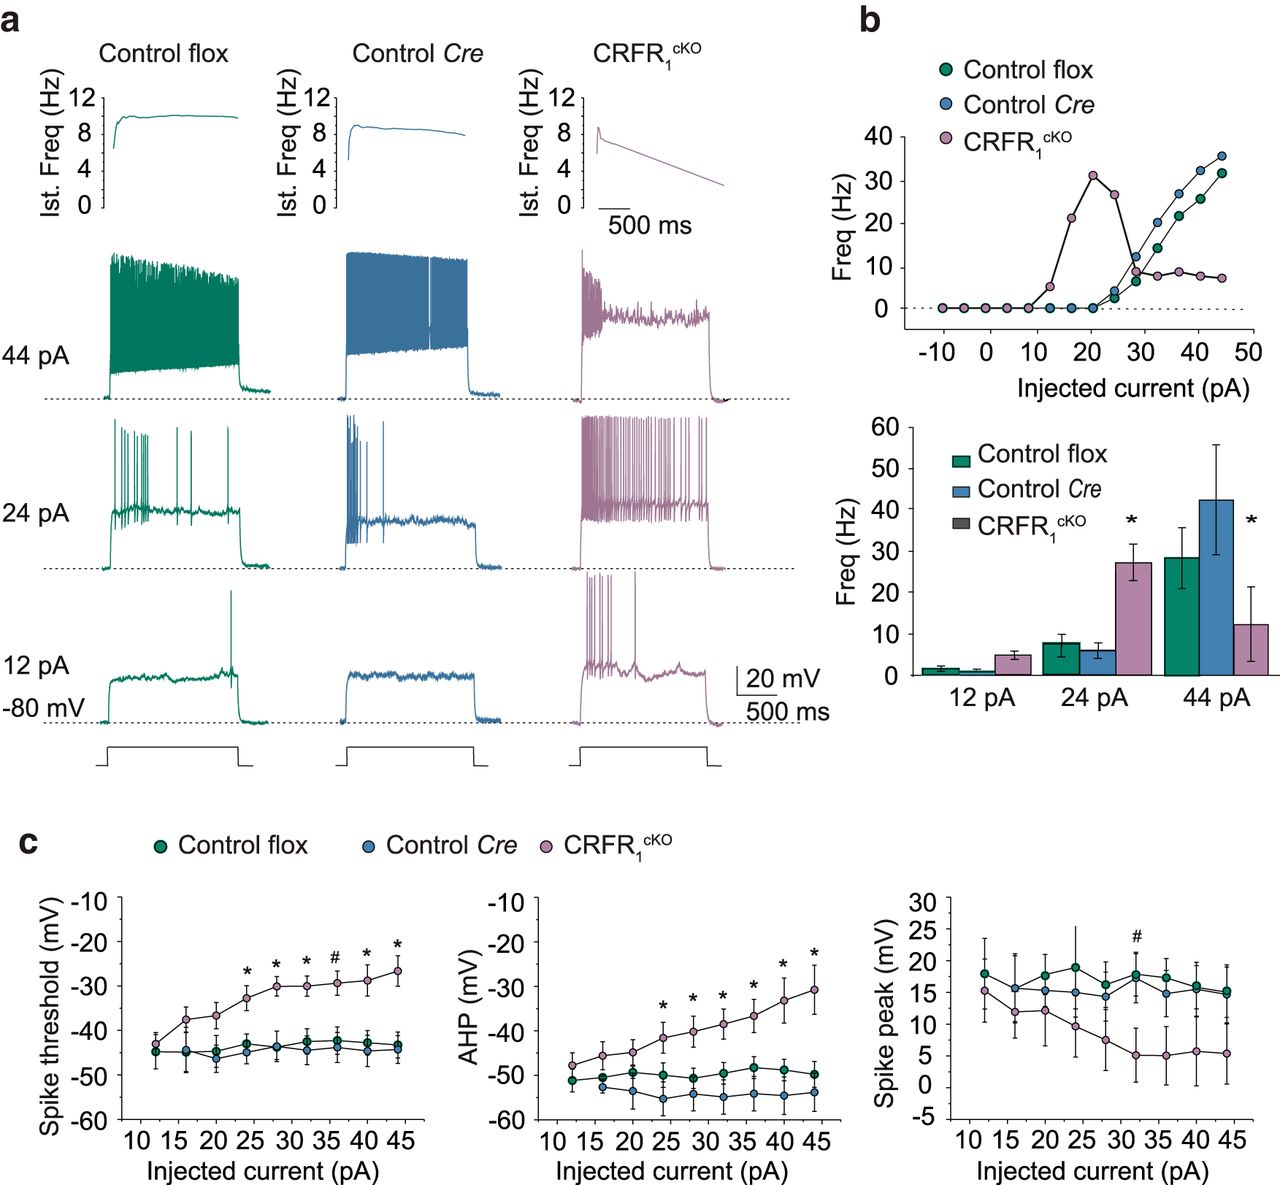
CRFR1cKO GrCs showing different electro-responsiveness from control mice. a, Examples of voltage responses elicited from −80 mV using step current injections in control for the floxed alleles (control flox), control for the Δα6- Cre (Control Cre), and CRFR1cKO mice. Instantaneous spike frequency is represented on top, showing rapid increase and marked adaptation in CRFR1cKO mice. b, Frequency/intensity plots for the same cells in a. Note that the CRFR1cKO GrC shows higher discharge frequency at low current injection and lower discharge frequency at high current injection compared with control and Cre cells, generating a characteristic bell-shaped response profile. The histograms at the bottom show average discharge frequency values at different current injection for all recorded cells (control flox n = 8, N = 4; control Cre n = 7, N = 4; CRFR1cKO n = 5, N = 3). c, Spike threshold, AHP, and spike peak in the different groups of GrC control flox n = 8, N = 4; control Cre n = 7, N = 4; CRFR1cKO n = 5, N = 3). CRFR1cKO GrCs spikes show higher threshold (control flox vs control Cre, p = 0.31; control flox vs CRFR1cKO, p = 0.0013; control Cre vs CRFR1cKO, p = 0.00015), smaller AHP (control flox vs control Cre, p = 0.73; control flox vs CRFR1cKO, p = 0.0037; control Cre vs CRFR1cKO, p = 0.0011), and smaller overshoot (control flox vs control Cre, p = 0.9; control flox vs CRFR1cKO, p = 0.052; control Cre vs CRFR1cKO, p = 0.029) compared with the 2 control groups. Data are represented as mean ± SEM. #p < 0.05, *p < 0.005 for one-way. Ind, Induction.
- Figure 4.
Long-term changes in mossy fiber- GrC EPSCs are markedly different in CRFR1cKO and control mice. a, Average EPSCs (100 tracings) obtained during control and 20 min after TBS application are shown superimposed in control flox, control Cre, and CRFR1cKO GrCs. After TBS, EPSCs increased in flox and Cre mice but decreased in the CRFR1cKO GrCs. The plot shows the average time course of EPSC amplitude changes (control flox n = 5, N = 4; control Cre n = 5, N = 4; CRFR1cKO n = 5, N = 4). b, Histogram showing ensemble EPSC amplitude changes at 20 min after TBS compared with baseline (control flox vs control Cre, p = 0.64; control flox vs CRFR1cKO, p = 0.00078; control Cre vs CRFR1cKO, p = 0.00036). c, Examples of GrC responses elicited by TBS. Note the absence of spike generation in the CRFR1cKO GrC (despite a robust depolarization) compared with the intense burst discharge of the control flox and control Cre GrCs (control flox vs control Cre, p = 0.64; control flox vs CRFR1cKO, p = 0.023; control Cre vs CRFR1cKO, p = 0.0065). d, Histogram showing ensemble number of spikes generated during TBS (control flox n = 5, N = 4; control Cre n = 5, N = 4; CRFR1cKO n = 5, N = 4). e, Plot correlating EPSC amplitude changes after induction with the number of spikes generated during TBS for the different mice groups (control flox n = 5, N = 4; control Cre n = 5, N = 4; CRFR1cKO n = 5, N = 4; individual data points and mean ± SEM are shown for each group). Data are represented as mean ± SEM. *p < 0.005.
- Figure 5.
Whole cerebellum mRNA sequencing reveals significant differences in transcriptome of control and CRFR1cKO mice. a, Log2 mRNA analysis of CRFR1cKO and control cerebella mice revealed 563 significantly upregulated or downregulated genes (light purple dots; N = 6, 6). Ten genes showed log2 change larger than ±0.4 (fold change >30%, dark purple dots; 3 genes upregulated and 7 downregulated). b, Real-time qRT-PCR analysis was used to validate the downregulation of Atp2b4 mRNA levels in CRFR1cKO mice compared with controls (N = 7, 5; p < 0.001). c, Quantification by Western blot (WB) of PMCA4, the protein coded by the Atp2b4 gene, validates its translation downregulation in cerebella of CRFR1cKO (N = 7, 6; p = 0.014). Data are represented as mean ± SEM. *p < 0.05, &p < 0.001.
- Figure 6.
CRFR1cKO mice show enhanced learning in the EBC procedure compared with control mice. a, Schematic illustration of EBC using the MDMT. b, Over the course of EBC, a 330 ms CS (green line) was paired with a co-terminating 30 ms US (blue line). c, d, Heatmap of group averages of trial-by-trial eyelid closure over the entire course of conditioning for controls (c) and CRFR1cKO mice (d). e, f, Averaged group eyelid traces per session depicting levels of eyelid closure over the entire course of conditioning for controls (e) and CRFR1cKO mice (f). g, Although both groups performed CRs before US presentation within several training sessions, quantitative assessment clearly reveals that CRFR1cKO CR percentage presented during EBC training is higher than controls (control: green, CRFR1cKO: purple, N = 6, 10, respectively; p = 0.002). CR timing histograms for session 10 are presented in Figure 6-1. Similar learning trends are seen for CRFR1cKO and control mice trained with 250 ms interstimulus interval in Figure 6-2. Data are represented as mean ± SEM. ***p < 0.005.
- Figure 7.
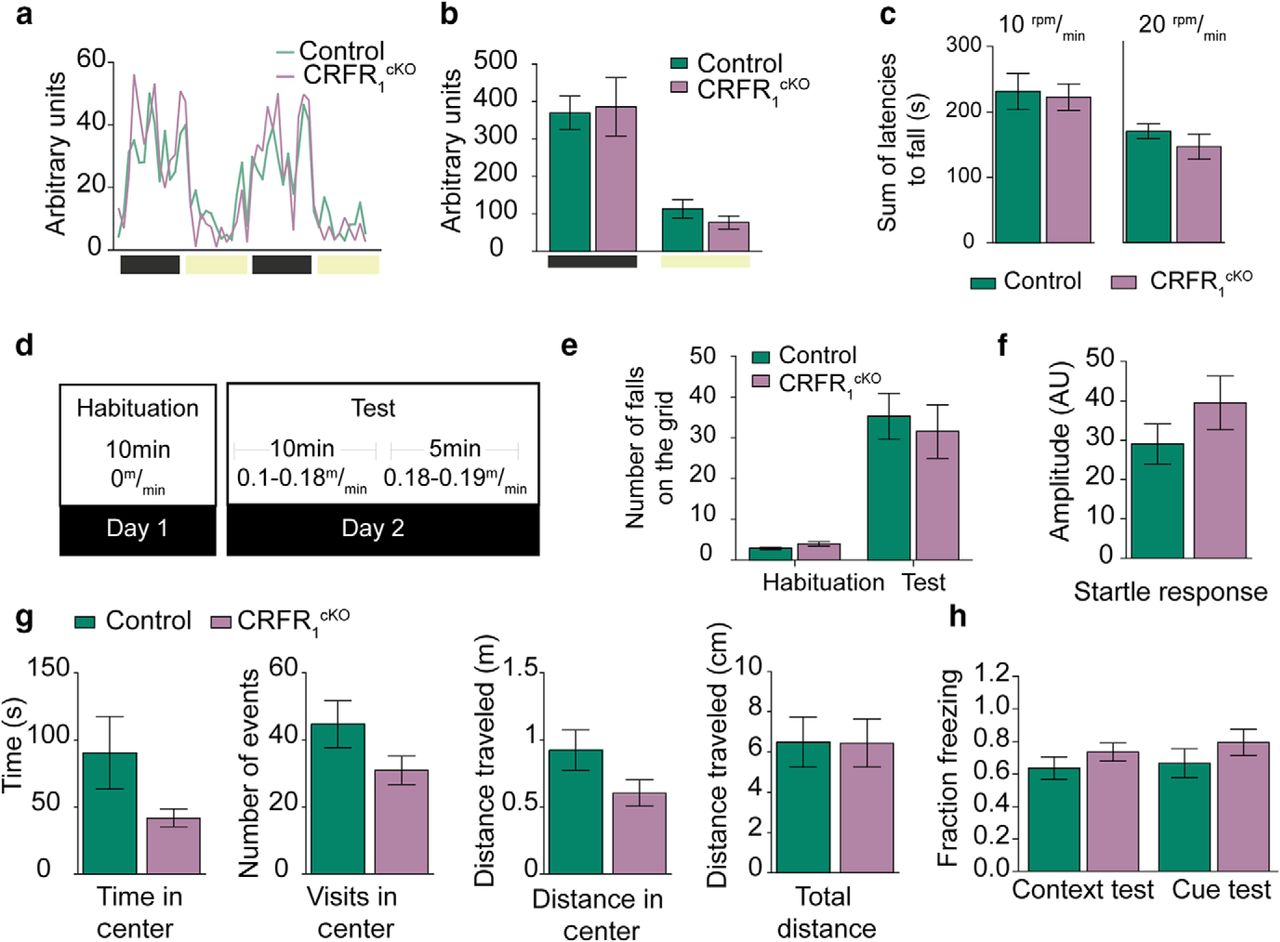
CRFR1cKO mice do not show any motor phenotype under challenging or neutral conditions. a, b, Home cage locomotion measured in single-caged CRFR1cKO mice and control mice did not reveal any differences between the groups in light or dark phases (N = 7, 6; p = 0.607, 0.289, respectively). c, Mice tested on the rotarod for a single session (4 trials) at 10rpm/min or 20rpm/min (from 0 to 40 rpm in 4 or 2 min) lasted for similar latencies on the rod (10 rpm: N = 12, 21; p = 0.653; 20 rpm: N = 13, 9; p = 0.171). d, Layout of treadmill protocol. e, Mice tested on a treadmill fell onto the grid to a similar extent (N = 12,10, p = 0.849. f–h, CRFR1cKO and control mice do not show a fear- or anxiety-related phenotype. f, Mice do not exhibit differences in startle response (N = 13, 15; p = 0.242). g, CRFR1cKO and control mice tested in the open-field test do not show a significant difference in time spent in the center of the arena, number of visits to or distance in the center, or in total distance walked during the task (N = 14, 14; p = 0.11–0.9). h, After fear conditioning, CRFR1cKO and control mice did not show differences in freezing during cue (N = 6, 4; p = 0.332) or context (N = 6, 6; p = 0.289) presentation. Data are represented as mean ± SEM.


Tables
Control flox (n = 13) Control Cre (n = 10) CRFR1cKO (n = 10) Rm (GΩ) 1.5 ± 0.2 1.3 ± 0.2 1.8 ± 0.3 Cm (pF) 3.1 ± 0.2 3.2 ± 0.2 2.9 ± 0.3 Rs (MΩ) 27.6 ± 2.5 28.1 ± 6.0 26.4 ± 2.4 fVC (KHz) 2.1 ± 0.2 2.4 ± 0.3 2.3 ± 0.2 τVC (μs) 88.2 ± 10.0 89.2 ± 15.2 79.3 ± 11.5 Vm (mV) −49.9 ± 3.1 −51.6 ± 2.6 −48.8 ± 2.8 The data were obtained using K-gluconate intracellular solution and analyzing current transients elicited by 10 mV voltage-clamp steps delivered from the holding potential of −70 mV.
Movies
- Movie 1.
CRF-expressing cells give rise to mossy and climbing fibers. CRF-tdTomato mouse brain was cleared and imaged to depict fibers originating in CRF-positive neurons reaching the cerebellum. Mossy and climbing fibers show marked expression of tdTomato, indicating CRF input to the cerebellum via these two pathways.
Figure 2-1
Validation of the of Δα6-Cre mouse line. (Related to Figure 2). (a) RT-qPCR analysis of cerebella obtained from heterozygous Δα6-Cre mice shows there is not significant reduction of Gabra6 gene expression levels (N = 7,5, p= 0.26). (b) Western blot analysis of relative quantity of Gabra6 protein in heterozygous Δα6-Cre reveals no significant reduction in protein levels (N = 7,6, p= 0.1). (c) Western blot image of the Gabra6. (d) Reporter mouse line expressing tdTomato Δα6-Cre expressing cells was generated by cross breeding Δα6-Cre and floxed stop tdTomato mice (α6-tdTomato). (e) Sagittal section of α6-tdTomato brain clearly shows a specific expression of tdTomato in the cerebellum. Data are represented as mean ± SEM. Download Figure 2-1, TIF file
Figure 2-2
Evaluation of CRFR1cKO mouse model. (Related to Figure 2). (a) Reporter mouse line expressing GFP under the CRFR1 promoter and tdTomato in Δα6-Cre expressing cells was generated by cross-breeding CRFR1GFP with Δα6-Cre and floxed stop tdTomato mice. (b) Co-localization of tdTomato and GFP expressing cells in the granular layer reveals an almost complete overlap between the α6 subunit (tdTomato; red) and CRFR1 (GFP) indicating CRFR1 is expressed in the vast majority of GrCs and that the penetrance of α6-Cre will allow for a complete ablation of CRFR1 from GrCs. (c) Since granular cells are too crowded to allow for cell by cell count, Mander’s coefficient was used to assess overlap of GFP signal with tdTomato signal; Mander’s coefficient reveals that nearly all GFP positive pixels are co-stained with tdTomato, indicating CRFR1 expressing GrCs (GFP) also express the α6 subunit (tdTomato, n = 9 images/slices, N= 2). (d) Representative images of the cortex, hippocampus, DCN, pontine and thalamus of the CRFR1GFP x α6-tdTomato reporter mouse line. (e) Analysis of percentage of cells expressing GFP (CRFR1) that co-express tdTomato (Δα6-Cre) signal in extra-cerebellar structures reveals low co-localization in extra-cereballar structures (N= 2; CRFR1-GFP+tdTomato: yellow, CRFR1-GFP not co-localized with tdTomato: green). Data are represented as mean ± SEM. DCN= deep cerebellar nuclei. Download Figure 2-2, TIF file
Figure 6-1
Conditioned response (CR) peak time probability of control and knockout mice. (Related to Figure 6). (a-b) CR peak time probability per group in session 10 reveals that both groups show higher probability to respond within 50 ms prior to unconditioned stimulus (US) onset (i.e., present well-timed CRs, a, control: green; b, CRFR1cKO: purple). Each bar represents a 25 ms bin, starting 50 ms after conditioned stimulus (CS) onset. Download Figure 6-1, TIF file
Figure 6-2
CRFR1cKO mice show accelerated learning of the eye-blink conditioning (EBC) with a 250 ms CS-US intesrval. (Related to Figure 6). (a-b) Heat map of average trial-by-trial eyelid closure over the entire course of conditioning for controls (a) and CRFR1cKO (b). (c) Quantified percentage CR of control (green) and CRFR1cKO (purple) in 10 training sessions of EBC with a 250 ms CS-US interval show accelerated learning in CRFR1cKO compared to controls (N = 9,5, p= 0.036). Data are represented as mean ± SEM, *p<0.05. Download Figure 6-2, TIF file


