

Abstract
Many behaviors require choosing between conflicting options competing against each other in visuomotor areas. Such choices can benefit from top-down control processes engaging frontal areas in advance of conflict when it is anticipated. Yet, very little is known about how this proactive control system shapes the visuomotor competition. Here, we used electroencephalography in human subjects (male and female) to identify the visual and motor correlates of conflict expectation in a version of the Eriksen Flanker task that required left or right responses according to the direction of a central target arrow surrounded by congruent or incongruent (conflicting) flankers. Visual conflict was either highly expected (it occurred in 80% of trials; mostly incongruent blocks) or very unlikely (20% of trials; mostly congruent blocks). We evaluated selective attention in the visual cortex by recording target- and flanker-related steady-state visual-evoked potentials (SSVEPs) and probed action selection by measuring response-locked potentials (RLPs) in the motor cortex. Conflict expectation enhanced accuracy in incongruent trials, but this improvement occurred at the cost of speed in congruent trials. Intriguingly, this behavioral adjustment occurred while visuomotor activity was less finely tuned: target-related SSVEPs were smaller while flanker-related SSVEPs were higher in mostly incongruent blocks than in mostly congruent blocks, and incongruent trials were associated with larger RLPs in the ipsilateral (nonselected) motor cortex. Hence, our data suggest that conflict expectation recruits control processes that augment the tolerance for inappropriate visuomotor activations (rather than processes that downregulate their amplitude), allowing for overflow activity to occur without having it turn into the selection of an incorrect response.
SIGNIFICANCE STATEMENT Motor choices made in front of discordant visual information are more accurate when conflict can be anticipated, probably due to the engagement of top-down control from frontal areas. How this control system modulates activity within visual and motor areas is unknown. Here, we show that, when control processes are recruited in anticipation of conflict, as evidenced by higher midfrontal theta activity, visuomotor activity is less finely tuned: visual processing of the goal-relevant location was reduced and the motor cortex displayed more inappropriate activations, compared with when conflict was unlikely. We argue that conflict expectation is associated with an expansion of the distance-to-selection threshold, improving accuracy while the need for online control of visuomotor activity is reduced.
Introduction
The physical world provides human beings and other animals with a variety of action opportunities, constantly requiring them to make choices. Recent theories posit that motor decisions emerge from a biased competition in a distributed network centered on sensorimotor structures (Thura and Cisek, 2014, 2016, 2017; Derosiere et al., 2015a, 2017a, b). Following this view, a movement is initiated when sensorimotor activity favoring this action reaches a decisive selection threshold (Klein et al., 2014, 2016; Murphy et al., 2016; Duque et al., 2017).
The abundance of stimuli in the visual environment makes it often difficult to choose, especially when conflicting sources of information call for incompatible actions (Ardid and Wang, 2013). Imagine, for instance, a driving scenario in which a traffic light has just turned green and a child suddenly runs across the street. In such circumstances, the inappropriate action (push the accelerator pedal) and the appropriate one (push the brake pedal) are in conflict. At the behavioral level, the presence of conflict induces a cost, reflected by the reduced propensity, and prolonged time needed, to select the correct action (Taylor et al., 2007; Chen et al., 2009; Mars et al., 2009; Töllner at al., 2017). At the neural level, conflict can produce a temporary activation of inappropriate action representations in the motor system (Szucs et al., 2009; Verleger et al., 2009; Michelet et al., 2010; Klein et al., 2014; Van Campen et al., 2014; Duque et al., 2016).
In some situations, contextual cues predict the occurrence of conflict (Stuphorn and Schall, 2006; Duque et al., 2016). In the example above, a school sign will help the car driver to anticipate the appearance of children on the street. Accordingly, previous studies have shown that, by increasing conflict expectation, contextual cues help to improve accuracy when conflicting stimuli eventually occur, but tend to slow down responses in easy, nonconflicting trials (King et al., 2012; Klein et al., 2014; Burle et al., 2016; Duque et al., 2016). This behavioral effect is thought to result from enhanced top-down control from frontal areas, including the medial frontal area (Correa et al., 2009; Cohen and Ridderinkhof, 2013; Duque et al., 2013; Strack et al., 2013; Spieser et al., 2015; Bartoli et al., 2017; Vissers et al., 2018), which shows increased EEG activity in the theta range (4–8 Hz) when conflict is expected (Van Driel et al., 2015). Yet, very little is known about the impact of this control system on the competition occurring in sensorimotor areas during motor decisions.
Recently, a study showed that conflict expectation produces a global suppression of corticospinal excitability during motor decisions (Klein et al., 2014; Duque et al., 2016). Notably, this global suppression seems to occur proactively as it is already present at the onset of stimulus occurrence, even before the subjects have eventually perceived the visual cue and its possible conflicting nature. Further, a recent EEG study revealed a more specific suppression of inappropriate motor representations (Burle et al., 2016), but the late occurrence of this effect, merely around the time of movement initiation, questions its role in assisting conflict resolution. In addition, very little is known about the impact of conflict expectation on sensory structures.
The goal of the present study was to strengthen our understanding of the sensorimotor changes underlying conflict expectation by considering its impact on action selection in the motor cortex and its effect on selective attention in the visual cortex. More precisely, we investigated whether control processes recruited in anticipation of a visual conflict enhance the selectivity of visual attention and fine-tune action selection. We used EEG to record steady-state visual evoked potentials (SSVEPs) and response-locked potentials (RLPs) while participants performed a modified version of the Eriksen Flanker task (Eriksen and Eriksen, 1974) where conflict was either highly expected or unexpected. Finally, we also considered midfrontal theta activity as a marker of cognitive control during conflict expectation (Van Driel et al., 2015).
Materials and Methods
Participants
Twenty healthy human subjects participated in the study, but 3 of them had to be excluded due to a hardware problem during the experiment. Hence, analyses were run on 17 subjects (9 women, 22.3 ± 2.2 years old). All participants were right-handed according to the Edinburgh Questionnaire (Oldfield, 1971) and had normal or corrected-to-normal vision. None of the participants had any neurological disorder, history of psychiatric illness, drug or alcohol abuse, or were under any drug treatment that could influence performance. Participants were financially compensated for their participation. The protocol was approved by the institutional review board of the Université Catholique de Louvain, Brussels, Belgium, and required written informed consent.
Experimental design
Subjects sat on a comfortable chair in front of a 21 inch cathode ray tube computer screen, with their head supported by a chinrest at 60 cm from the monitor. The display was gamma-corrected, and its refresh rate was set at 100 Hz. Left and right index fingers were indeed located on top of the F12 and F5 keys, respectively. (The keyboard was positioned upside-down). Participants wore a 64 Ag/AgCl electrode EEG cap placed according to the international 10/10 system during the whole experiment (Waveguard 64 cap, Cephalon). EEG signals were amplified and digitized using a sampling rate of 1000 Hz (64-channel high-speed amplifier, Advanced Neuro Technology). Electrode impedances were kept <10 kΩ. An average reference was exploited for all recordings. To monitor for artifacts from eye movements, four additional periocular electrodes were placed above and below the left eye (vertical electrooculography; EOG) and at the left and right outer canthi (horizontal EOG). Finally, an Eyelink 1000 + eye tracker (SR Research; RRID:SCR_009602) was used to monitor the subjects' gaze during the experiment (sampling rate: 500 Hz). Subjects were required to maintain their gaze on the fixation point during each trial (see Task). When deviations occurred, subjects were asked to correct their gaze position. Trials with gaze deviation were excluded from the analyses.
Task
We used a modified version of the Eriksen Flanker task (Eriksen and Eriksen 1974; see Klein et al., 2014; Duque et al., 2016). The task was implemented by means of MATLAB version 6.5 (The MathWorks, RRID:SCR_001622) and the Cogent 2000 toolbox (Functional Imaging Laboratory, Laboratory of Neurobiology and Institute of Cognitive Neuroscience at the Wellcome Department of Imaging Neuroscience, London; RRID:SCR_015672). Subjects were required to perform a left or right index finger key-press according to the orientation of a left- or right-pointing arrow (i.e., < or >, respectively). This “target” was surrounded by a set of two irrelevant arrows on each side, referred to as “flankers,” which either pointed in the same direction (congruent stimuli, “< < < < <” or “> > > > >”) or in the opposite direction (incongruent stimuli, “> > < > >” or “< < > < <”; dimensions of the arrows: 18 × 18 mm; arrows were located at 2 mm from each other; whole stimulus length: 98 mm). Hence, imperative stimuli were either congruent or incongruent, and instructed either left or right index finger key-presses (four trial types; Fig. 1A).

Task design. A, Trial types. Subjects were asked to perform congruent (top) and incongruent (bottom) trials requiring left (left) or right (right) finger responses according to an imperative stimulus consisting of a central arrow (target) surrounded by two irrelevant arrows on each side (flankers). B, Time course of a typical trial. Each trial started with the presentation of five black squares remaining on the screen for 7000 ms (top left). Then, the imperative stimulus appeared (top right), indicating the required response (right key-press in current example). Once a response was provided (or after 700 ms), a mask appeared and remained on the screen for an interval of 1200 ms (bottom right). A feedback score was then displayed for 1500 ms depending on the subject RT and accuracy (bottom left). C, Block types. The experiment involved two block types, including either a majority of congruent trials (MCB; left) or a majority of incongruent trials (MIB; right). Conflict expectation was highest in the latter block type. D, SSVEP procedure. In half of the blocks, the stimuli were slightly shifted to the left (left), whereas they were slightly shifted to the right in the other blocks (right). The target square (TargetSq) appeared on the left of the fixation cross in left-shifted stimuli and on the right of it in right-shifted stimuli; it was flickering at 16.6 Hz. The most central flanker square (Flanker-CSq) was flickering at 12.5 Hz; it was always the one located on the other side of the fixation point. The three more peripheral flanker squares (Flanker-PSq) were flickering at 14.2 Hz.
Each trial started with the onset of five horizontally aligned black squares (i.e., 18 × 18 mm, located at 2 mm from each other; stimulus length: 98 mm) appearing 15 mm above a central point (Fig. 1B; for an explanation regarding the slight lateralization of the squares with respect to the central point, see SSVEP procedure). Subjects were asked to keep fixation on the central point during the whole trial. After 7000 ms, the squares were replaced by the imperative stimulus, which consisted of one of the four possible combinations of target and flankers described above (“< < < < <,” “> > > > >,” “> > < > >,” or “< < > < <”). The target always appeared at the location of the central square, whereas the flankers occurred at the other square locations. In some trials (6% of total number of trials; i.e., 24 trials), the imperative stimulus appeared earlier than expected (between 1000 and 6500 ms instead of 7000 ms). Such “catch” trials were included to make sure that the subjects were focused on the task from the beginning of each trial and ready to react as soon as the imperative stimulus appeared; these trials were not taken into account for the data analysis. Subjects were required to respond as quickly as possible following the imperative stimulus. A mask appeared once the subject had answered (or after 700 ms). The latter consisted of five aligned and overlapping double-arrows (Fig. 1B), which remained on the screen for an interval of 1200 ms. A feedback was then presented for 1500 ms. This feedback consisted of a positive score depicted in green (following a correct response) or a negative score depicted in red (following an incorrect response). Positive scores were always inversely proportional to the response times (RTs); the faster the response, the higher the score (score = k/RT with k = 5000). For instance, a correct response provided with an RT of 400 ms yielded a score of 12.5 points. Incorrect responses were always followed by a fixed negative score (−10). The total amount of points accumulated from the beginning of each block was also presented following each trial, just below the current trial score. Subjects knew they would receive a financial bonus depending on their final score.
Experimental blocks
All subjects came for one session of eight experimental blocks. Each block comprised the same percentage of left and right finger responses (50% left/50% right). In contrast, the percentage of congruent and incongruent trials varied in two different block types (Fig. 1C). In a first type of block, called “mostly congruent block” (MCB), most trials were congruent (80%) and very few were incongruent (20%). In contrast, the second block type, called “mostly incongruent block” (MIB), involved a majority of incongruent trials (80%) and few congruent ones (20%). Subjects were always told about the type of block (MCB or MIB) they would be performing next. Hence, the degree to which subjects expected conflict clearly differed between the two block types (Ridderinkhof, 2002; Klein et al., 2014; Duque et al., 2016). Conflict expectation was high in the MIBs because subjects knew they would have to face incongruent flankers on most trials, whereas it was low in the MCBs, given the rarity of incongruent flankers in the latter blocks.
At the beginning of the session, subjects performed two blocks of 40 trials in a neutral condition (same amount of congruent and incongruent trials). This allowed them to become familiar with the two trial types. Subjects then performed the eight experimental blocks (i.e., four MCBs and four MIBs), each of which consisted of 40 trials. The same block types were run in a row, but their order was counterbalanced between subjects. Each block lasted ∼7 min, and the whole experiment duration was ∼90 min.
SSVEP procedure
The five squares presented before the imperative signal were used to obtain SSVEPs in both contexts (MCB and MIB). The position of these squares varied on the horizontal meridian in two different block types (Fig. 1D). In half of the blocks, the five squares were slightly shifted to the left (referred to as “left-shifted” stimuli), whereas they were slightly shifted to the right in the other blocks (“right-shifted” stimuli; 10 mm of eccentricity). As a result, the central “target square” (TargetSq) either appeared on the left or on the right side of the central fixation point (i.e., on the right in right-shifted trials or on the left in left-shifted trials). This variation in the stimulus position was set to reduce any putative effect of habituation on SSVEP measures due to the repetition of the stimulation at a given screen location (Moratti et al., 2006; Kuś et al., 2013). Left- and right-shifted stimuli were grouped in separate blocks ordered in a counterbalanced way.
The squares were flickering at one of three different frequencies to induce three separate location-specific SSVEPs (flickering elicited by a contrast of luminance; Fig. 1D) (Vialatte et al., 2010; McTeague et al., 2015; Norcia et al., 2015). One frequency (16.6 Hz) was selectively used to tag the TargetSq. Another frequency (12.5 Hz) was used to tag the most central (C) “flanker square” that was located on the other side of the fixation point (Flanker-CSq; see below). A third frequency (14.2 Hz) was used for the three other flanker squares, which were more peripheral (P) with respect to the fixation point (Flanker-PSq). The flickering stopped when the arrow stimulus occurred (i.e., at the end of the fixation period).
Previous studies have shown that flickering stimuli presented in one visual hemifield elicit a predominant SSVEP response in the contralateral hemisphere and an attenuated response in the ipsilateral hemisphere (e.g., Kim et al., 2010; Y.J. Kim et al., 2011). Therefore, we expected the TargetSq and Flanker-CSq to elicit predominant SSVEP responses in opposite hemispheres (given that they are located on opposite sides of the fixation point). For instance, in left-shifted trials, we expected the TargetSq and Flanker-CSq to elicit predominant SSVEP responses in the right and left hemispheres, respectively, whereas the reversed pattern was expected in right-shifted trials, as confirmed by our analyses (see Results). Conversely, we predicted that the three Flanker-PSq would elicit comparable SSVEP responses in both hemispheres as these squares were shared out on both sides of the central fixation point. Moreover, based on previous studies, we expected the SSVEP responses to be most prominent in the signal recorded at occipitoparietal electrodes, capturing responses originating mostly in the underlying visual cortex, although parietal and frontal sources are not excluded (Di Russo et al., 2007; D.W. Kim et al., 2011; Heinrichs-Graham and Wilson, 2012; Gulbinaite et al., 2017).
The amplitude of SSVEPs is known to reflect how much visuospatial attention is allocated to the flickering stimuli, regardless of whether attention is overtly or covertly oriented toward them (Keil et al., 2006; Müller et al., 2006; Vialatte et al., 2010; Norcia et al., 2015; Shioiri et al., 2016). In the present study, we compared SSVEPs in MIBs and MCBs to investigate the influence of conflict expectation on the allocation of covert attention toward goal-relevant (TargetSq) and goal-irrelevant (Flanker-CSq and Flanker-PSq) stimulus locations.
Behavioral measurements
Data analysis.
Finger responses were classified according to the responding hand (i.e., left or right hand), the trial type (i.e., congruent or incongruent trial), and the context (i.e., MCB or MIB). For each of these conditions, we calculated the percentage of correct responses (accuracy) and their RT. Accuracy and RT data were log-transformed for the statistical analyses to normalize their distribution.
Statistical analysis.
Statistica software (version 7.0, Statsoft, RRID:SCR_014213) was used for the analysis of the accuracy and RT data. All data were examined for normality and homogeneity of variance using Skewness, Kurtosis and Brown-Forsythe tests. RT and accuracy were analyzed separately using two three-way repeated-measures ANOVA with hand (left, right), trial (congruent, incongruent), and context (MCB, MIB) as within-subject factors. When appropriate, Fisher's LSD post hoc tests were used to detect paired differences. The significance level was set at p < 0.05. Results are expressed as mean ± SE.
Visuomotor activity
Data analysis.
All EEG data were processed on MATLAB (The MathWorks) using Letswave 6 and EEGLAB (RRID:SCR_007292) (Delorme and Makeig, 2004). The EEG signals were filtered using a 0.01–70 Hz bandpass Butterworth filter; they were then segmented in two subsets.
The first subset was comprised of epochs extending from 1000–7000 ms with respect to the onset of the 5-square stimulus. These epochs were used to extract the SSVEPs and thus served to evaluate the distribution of visual attention in space (i.e., attention epochs) according to the degree of conflict expectation (larger in MIBs than in MCBs). We discarded the first 1000 ms of the flickering period to avoid contamination from the initial event-related brain potential on the SSVEP as well as to ensure sensitivity to conditioning effects typically occurring later in the epoch (Moratti et al., 2006; Keil et al., 2013).
The second subset was comprised of epochs extending from −700 to −50 ms with respect to the onset of the key-press. These epochs were used to extract the RLPs and thus served to characterize the motor correlates of action selection (i.e., selection epochs) according to the level of conflict (larger in incongruent than in congruent trials) and the degree of conflict expectation (larger in MIBs than in MCBs). We also considered the influence of responding with the right (dominant) or left (nondominant) hand.
For both subsets of epochs, an independent component analysis was computed to remove components corresponding to eye blinks and electrical line noise (Delorme et al., 2007); the data were then screened visually and epochs with residual artifacts were rejected.
SSVEP data
SSVEPs were obtained to evaluate visual cortical correlates of selective attention. To do so, attention epochs were first classified according to the stimulus shift (left- or right-shifted) and the context in which they were recorded (MCB, MIB). Following this classification, a total of 78 ± 4 epochs were obtained per condition. Each epoch was then sectioned in two subepochs of 3000 ms duration: the first subepoch extended from 1000–4000 ms and served to assess selective attention at an early stage of the fixation period (StageEarly), whereas the second one, extending from 4000–7000 ms, served to assess attention at a later stage of fixation (StageLate). For each condition obtained (i.e., StageEarly/StageLate, left-/right-shifted, MCB/MIB), the epochs were averaged to attenuate the contribution of neural activity that was not phase-locked to the onset of the square stimulus (Derosiere et al., 2015b). A current source density transformation was applied to the scalp voltage data to enhance the spatial specificity of the signals (Burle et al., 2015; McTeague et al., 2015; Vidal et al., 2015).
The signals were zero-padded with 2000 points to increase the frequency resolution of the ensuing FFT analysis (Diez et al., 2011; Gruss et al., 2012; Chabuda et al., 2018). For each subepoch, the number of points was thus extended from 3000 points (i.e., epochs of 3000 ms sampled at 1000 Hz; see above) to 5000 points. A discrete FFT was then applied to convert the signals in the frequency domain (Frigo and Johnson, 1998), yielding spectra from 0.1–500 Hz with a resolution of 0.2 Hz (Bach and Meigen, 1999). Background noise was removed by computing, for each point of the spectra, its z score value with respect to the values measured at neighboring frequency bins (second to fifth frequency bins relative to each bin) (Mouraux et al., 2011; Nozaradan et al., 2011, 2012, 2017; Rossion et al., 2012).
Based on the scalp topographies and on the literature, we defined an occipitoparietal ROI for which SSVEP amplitudes are known to be maximal when elicited by a contrast of luminance (Rossion et al., 2012; McTeague et al., 2015). This posterior ROI (ROIPost) included the O1, O2, PO3, PO4, P3, P4, P5, P6, P7, and P8 electrodes (Fig. 2A). Half of these electrodes are located over the left hemisphere (O1, PO3, P3, P5, and P7), whereas the other half are over the right hemisphere (O2, PO4, P4, P6, and P8). To assess SSVEPs emerging in the hemisphere contralateral to the TargetSq (HEMIContra-to-Target), we pooled together the data from corresponding electrodes in both hemispheres (e.g., O1 and O2) collected during left- and right-shifted trials. That is, SSVEPs recorded from O2, PO4, P4, P6, and P8 (right-sided electrodes) during left-shifted trials were pooled with those obtained at O1, PO3, P3, P5, and P7 (left-sided electrodes) during right-shifted trials, respectively. The resulting “pooled” scalp locations in the HEMIContra-to-Target are referred to by 1–5 according to the location of each pair of original electrodes, beginning with the most caudomedial ones (ROIPost_1 = O1 and O2) and ending with the most rostrolateral ones (ROIPost_5 = P7 and P8; Fig. 2A). Likewise, to evaluate SSVEPs emerging in the hemisphere ipsilateral to the TargetSq (HEMIIpsi-to-Target), we pooled together the data recorded from O2, PO4, P4, P6, and P8 (right-sided electrodes) during right-shifted trials and the data recorded from O1, PO3, P3, P5, and P7 (left-sided electrodes) during left-shifted trials, respectively. The resulting “pooled” scalp locations in the HEMIIpsi-to-Target are also referred to as ROIPost_1–5. Because the TargetSq and Flanker-CSq were always located on opposite sides of the fixation point, the hemisphere contralateral to the Flanker-CSq was the HEMIIpsi-to-Target, whereas the one ipsilateral to the Flanker-CSq was the HEMIContra-to-Target.

EEG data processing steps. A, Attention epochs: SSVEP. (1) For each subject, multiple z scored spectra were obtained (i.e., in 4 conditions and 64 electrodes). Typical single-subject spectra are represented, showing three SSVEP peaks at 12.5, 14.2, and 16.6 Hz. (2) The spectra obtained at electrodes of a posterior ROI (ROIPost) were exploited to compute linear channel maps. (3) A cluster-based statistical analysis was applied on the maps to test for any significant effect of the factors of interest (i.e., hemisphere and context) on the spectral amplitude among the frequency and scalp location dimensions. B, Selection epochs: RLP. (1) For each subject, multiple RLPs were obtained (in μV/m2; i.e., in 16 conditions and 64 electrodes). Typical single-subject potentials are represented. (2) The potentials obtained at electrodes of a central ROI (ROICentral) were exploited to compute channel maps. (3) A cluster-based statistical analysis was applied on the maps to test for any significant effect of the factors of interest (e.g., trial [congruent, incongruent], context [MCB, MIB]) on the potential amplitude among the time and scalp location dimensions.
Frequency spectra extracted from the ROIPost_1 to ROIPost_5 electrodes were exploited to compute linear channel maps. In Figure 2A, the electrodes were disposed along the y axis according to their scalp location (from ROIPost_1 to ROIPost_5) and the spectral amplitude obtained at each frequency (x axis) was linearly interpolated (for a similar approach, see Langer et al., 2017). In each subject, eight maps were obtained. That is, we obtained a map for each hemisphere (HEMIContra-to-Target, HEMIIpsi-to-Target), each context (MCB, MIB), and each stage of the fixation period (StageEarly, StageLate).
RLP data
RLPs were obtained to evaluate motor cortical correlates of action selection. To do so, selection epochs were classified according to the responding hand (left, right), the trial type (congruent, incongruent), and the context in which they were recorded (MCB, MIB). Epochs obtained from trials where an incorrect response was provided were discarded from further analysis. Following this classification, a total of 35 ± 6 epochs were obtained per condition. For each condition, the epochs were averaged to attenuate the contribution of neural activity that was not phase-locked to the onset of the key press (Derosiere et al., 2015b), and a baseline subtraction was applied (time window for baseline correction: −700 to −500 ms). The signals were subsequently cropped at −500 ms, and current source density transformation was applied to the scalp voltage data to enhance the spatial specificity of the signals (Burle et al., 2015; McTeague et al., 2015; Vidal et al., 2015).
Based on the obtained scalp topographies and on the literature, we defined a central ROI (ROICentral) for which the RLP amplitudes are maximal close to movement execution (Cottereau et al., 2014; Clark et al., 2015). The central ROI included the C1, C2, C3, C4, C6, C7, T7, and T8 electrodes (Fig. 2B). Half of these electrodes are located over the left hemisphere (C1, C3, C7, and T7), whereas the other half are over the right hemisphere (C2, C4, C6, and T8). To assess RLPs emerging in the hemisphere contralateral to the responding hand (HEMIContra-to-Resp), we pooled together the data from corresponding electrodes in both hemispheres (e.g., C4 and C3) collected in trials in which subjects provided left and right hand responses. That is, the RLPs recorded from C2, C4, C6, and T8 (right-sided electrodes) when subjects provided left hand responses were pooled with those obtained at C1, C3, C7, and T7 (left-sided electrodes) when they responded with the right hand, respectively. The resulting “pooled” scalp locations in the HEMIContra-to-Resp are referred to by 1–4 according to the location of each pair of original electrodes, beginning with the most medial ones (ROICentral_1 = C1 and C2) and ending with the most lateral ones (ROICentral_4 = T7 and T8). Likewise, to evaluate the RLPs emerging in the hemisphere ipsilateral to the responding hand (HEMIIpsi-to-Resp), we pooled together the data recorded from C2, C4, C6, and T8 (right-sided electrodes) when subjects provided a right hand response and the data recorded from C1, C3, C7, and T7 (left-sided electrodes) when they responded with the left hand, respectively. Again, these “pooled” scalp locations in the HEMIIpsi-to-Resp are referred to as ROICentral_1–4.
RLPs extracted from ROICentral_1 to ROICentral_4 electrodes were exploited to compute linear channel maps. In Figure 2B, the electrodes were disposed along the y axis according to their scalp location (from ROICentral_1 to ROICentral_4), and the amplitude of the RLP obtained at each time point (x axis) was linearly interpolated. In each subject, 16 maps were obtained. That is, we obtained a map for each hemisphere (HEMIContra-to-Resp, HEMIIpsi-to-Resp), for each hand response (left, right), in the two trial types (congruent, incongruent) and in both contexts (MCB, MIB).
Statistical analysis.
The SSVEP and RLP maps were analyzed using a cluster-based statistical method (Poline and Mazoyer, 1993; Bullmore et al., 1999; Maris and Oostenveld, 2007). This approach allows to run analyses on multiple data points while accounting for both the multiplicity of the statistical tests realized and the spatial dependency between the points. It was initially developed for the statistical analysis of structural MRI data (Poline and Mazoyer, 1993; Bullmore et al., 1999) and has been then extended to EEG work (Maris and Oostenveld, 2007), where it has been widely used ever since (e.g., Groppe et al., 2011; Melloni et al., 2015; Pernet et al., 2015; Frehlich et al., 2016; Craddock et al., 2017).
Here, we used a cluster-based analysis of SSVEP maps to assess the effect of the factors hemisphere (HEMIContra-to-Target, HEMIIpsi-to-Target), context (MCB, MIB), and time (early, late). In addition, the cluster-based analysis of RLP maps included the factors hemisphere (HEMIContra-to-Resp, HEMIIpsi-to-Resp), hand (left, right), trial (congruent, incongruent), and context (MCB, MIB). The factor trial was not included in the analysis of the SSVEPs as the imperative arrows (determining the trial type) only appeared after the flickering period.
Concretely, in a first step, a point-by-point ANOVA is performed using the factors mentioned above, hence yielding F and p values for each data point. Points with an F value exceeding an alpha level of p = 0.05 are selected. Among the selected points, those that are located next to each other on the map are grouped together in clusters. For each cluster so obtained, cluster-level F values are subsequently computed by adding up the F value associated with each individual data point comprised in the cluster.
Then, in a second step, Monte-Carlo permutation tests are performed. For each subject, maps are randomly permuted, resulting in a so-called “random partition” (separate analyses on SSVEP and RLP maps). This step can be considered as equivalent to randomly switching the labels of the maps, independently for each subject. Based on the random partition, a point-by-point ANOVA is performed in the exact same manner as during step 1 and cluster-level F values are computed. The random partitioning and the subsequent calculation of the cluster-level F values are reiterated 1000 times. A histogram of the F values is then constructed. For each factor and interaction tested, the proportion of random partitions that results in larger F values than the one observed in the first step of the analysis is finally calculated. This proportion represents the Monte-Carlo significance probability, also called p value. If, for a given effect and a given point, <5% of the random partitions results in a larger F value than the one observed in the first step of the analysis, then it is considered as significant for that cluster at p < 0.05.
For each factor and interaction, the analysis outputs a map highlighting the cluster(s) that survived to the thresholding at the Monte-Carlo significance probability. Based on these maps, the onset and offset of the cluster(s) can be estimated. However, the onset and offset of where each cluster exceeds the threshold depend on several factors, including the frequency/temporal resolution of the SSVEP/RLP maps. Hence, when referring to the cluster edges in the following, one should be aware that they could have slightly varied if different parameters had been exploited during data processing.
Importantly, combining a cluster-based approach with Monte-Carlo permutations allowed us to identify the data points, within the SSVEP and RLP maps, showing a significant effect of the factors mentioned above in a data-driven way (i.e., by testing all the points of the maps). Such a data-driven approach prevented us from arbitrarily selecting a number of frequency or temporal bins from the continuous signals of the SSVEP and RLP maps, respectively, and from a priori averaging the signals across the ROIPost or ROICentral electrodes, as both procedures could have impacted the statistical results (Pernet et al., 2015; Shen et al., 2017).
When a significant effect involved more than two conditions, post hoc tests were required to test which pairwise difference(s) drove the statistical difference detected. For each condition, the values of every data point composing the detected cluster were averaged into a single value; Fisher LSD post hoc tests were used to detect paired differences on the averaged values. The significance level was set at p < 0.05. Results are expressed as mean ± SE.
Midfrontal theta activity
Data analysis.
Conflict expectation has been shown to increase midfrontal theta activity (i.e., 4–8 Hz) (Van Driel et al., 2015), a well-known substrate of cognitive control (e.g., Gulbinaite et al., 2014; Wang et al., 2017; Lin et al., 2018; Vissers et al., 2018). While the primary aim of the present study was to investigate the impact of conflict expectation on visuomotor activity, we also tested whether the effect reported on midfrontal theta activity could be replicated based on our dataset. To do so, we exploited the same time-frequency (TF) analysis, as in Van Driel et al. (2015), and applied it on the EEG signals obtained during the fixation period (same epoch as for the SSVEPs).
First, attention epochs (i.e., as defined in the SSVEP section) were classified according to the context in which they were recorded (MCB, MIB). Second, EEG signals were decomposed into their TF representations for both contexts, every electrode, and each subject. TF maps were obtained by multiplying them with a series of Morlet wavelets with frequencies ranging from 4 to 9 Hz in 20 linearly scaled steps. The wavelets were generated by multiplying perfect sine waves (sine wave = ei2πft, where i is the complex operator, f is the frequency, and t is time) with a Gaussian (Gaussian = e−t2/2σ2, where σ is the width of the Gaussian). The width of the Gaussian was set to four cycles [σ = 4/(2πf)], to trade-off temporal and frequency resolution. The FFT was applied to both the EEG signals and the Morlet wavelets, and these were then multiplied in the frequency domain, after which the inverse FFT was applied. From the resulting complex signal Zt, an estimate of frequency-specific amplitude at each time point was defined as [real(Zt)2 + imag(Zt)2]. Third, trials were averaged together, resulting in one TF map per condition, per electrode, and per subject. Finally, to make the data comparable across all frequencies and subjects, difference maps were computed by subtracting the spectral amplitude (SpectAmp) obtained at each TF point in the MCB condition from the corresponding values in the MIB condition (Castro et al., 2018). Hence, this analysis yielded one TF map per electrode and per subject, on which the difference in spectral amplitude between MIBs and MCBs was represented (ΔSpectAmp). ΔSpectAmp values >0 denoted a higher spectral power in MIBs compared with MCBs.
Statistical analysis.
The statistical analysis was realized on the TF map obtained at the Fz electrode, for which the effect of conflict expectation on theta activity is the strongest (Van Driel et al., 2015; see also Herz et al., 2017). A cluster-based analysis was performed in the exact same way as described above on this TF map, except that we used a two-way Student's t test against 0 (i.e., instead of an ANOVA). The aim of this analysis was to detect the cluster(s) of data points on the TF map for which ΔSpectAmp values were >0 at the Monte-Carlo significance probability of 0.05.
Results
Behavior
Accuracy
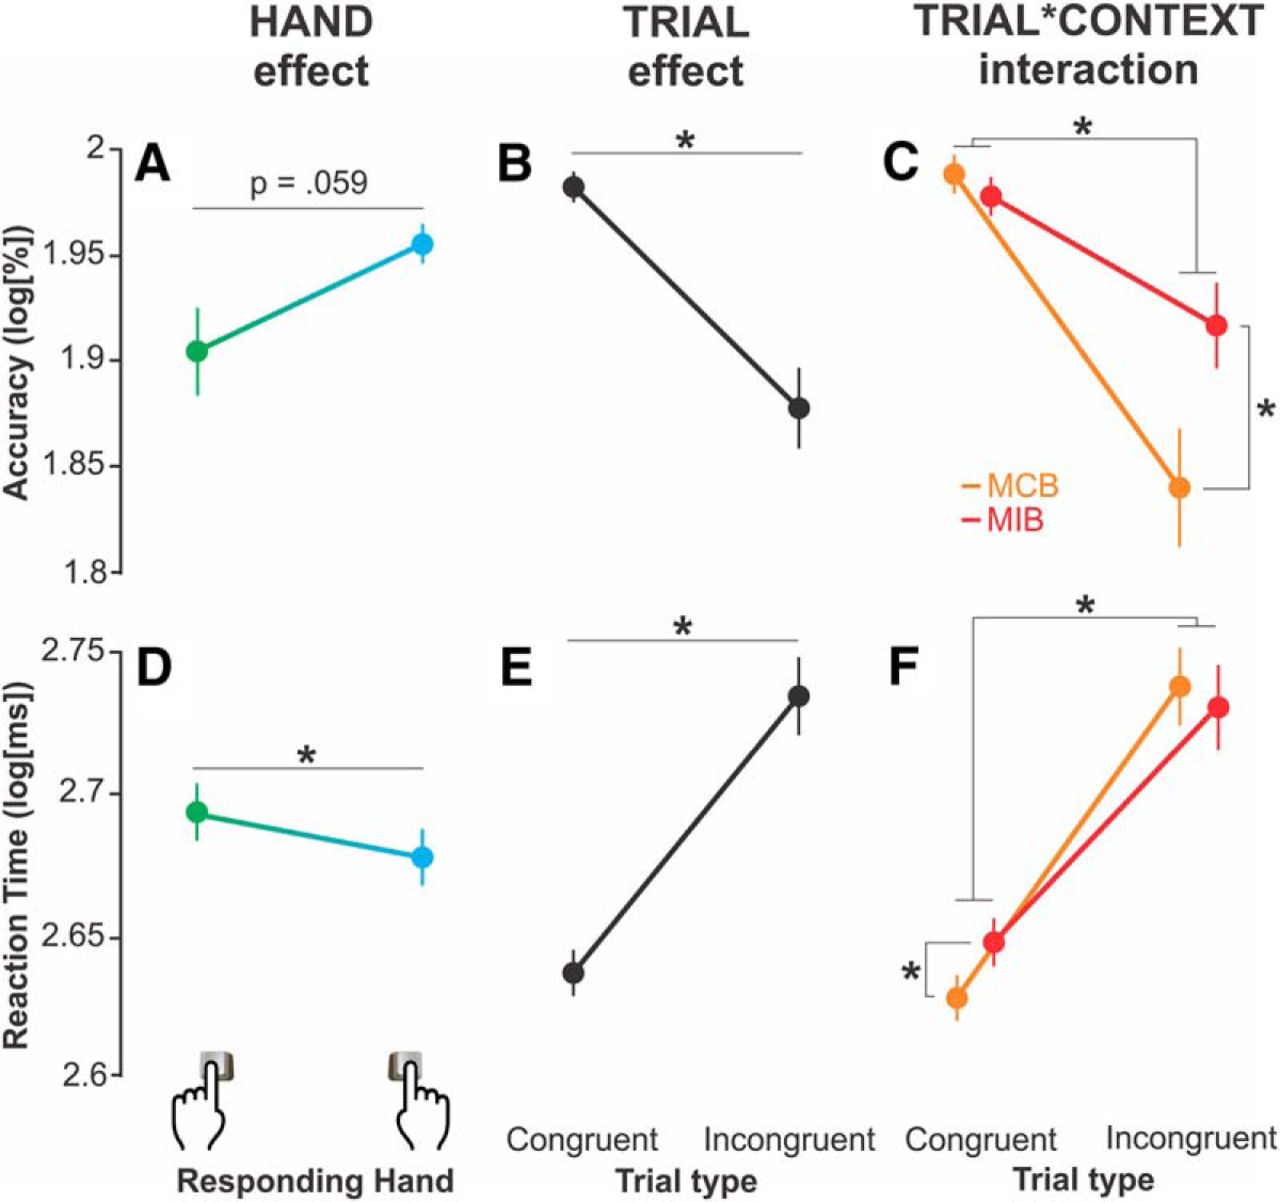
The ANOVA performed on the accuracy data revealed a tendency toward a significant effect of the factor hand (F(1,16) = 4.13, p = 0.059). Indeed, the percentage of correct responses tended to be lower when the imperative stimulus required a left than a right hand movement (84.78 ± 2.48% and 91.47 ± 1.09% of correct responses, respectively; both trial types and contexts pooled together; log-transformed data are represented in Fig. 3A). Hence, subjects tended to be less accurate when they had to respond with the nondominant hand compared with when they had to answer with the dominant one. In other words, they were more prone to respond with the dominant hand even when the target arrow instructed them to make the opposite choice.

Accuracy (A–C) and RT (D–F). Data are mean ± SE. A, D, The hand factor significantly impacted the accuracy and RT data. Green and blue colors represent data obtained for left and right hand responses, respectively. Both trial types and contexts are pooled together. B, E, The trial factor had a significant influence on the accuracy and RT data. Both hands and contexts are pooled together. C, F, The trial × context interaction was significant. Both hands are pooled together. *Significant difference at p < 0.05.
The ANOVA also revealed a significant main effect of the factor trial on the accuracy data (F(1,16) = 16.56, p = 0.0008). The percentage of correct responses was lower in incongruent (79.59 ± 2.72%) than in congruent trials (96.67 ± 0.97%, both hands and contexts pooled together; Fig. 3B). Hence, as expected, subjects made more errors when the flankers pointed to the incorrect response compared with when they pointed to the correct one.
Importantly, the trial effect reported above depended on the context within which the responses were provided (MCB or MIB), as revealed by a significant trial × context interaction (F(1,16) = 22.82, p = 0.0002). Indeed, the difference in accuracy between congruent and incongruent trials was attenuated in the MIBs compared with the MCBs. That is, subjects made much less errors in the presence of incongruent flankers when the latter had been anticipated (in MIBs, 85.06 ± 2.68% of correct responses) compared with when incongruent flankers were unlikely (MCBs, 74.11 ± 3.31%, p < 0.00001; both hands pooled together; Fig. 3C). Hence, control processes associated with conflict expectation helped subjects reduce the negative impact of incongruent information on their decision accuracy, as previously shown (King et al., 2012; Klein et al., 2014; Burle et al., 2016; Duque et al., 2016). Notably, congruent trials were associated with a comparable accuracy in MIBs (95.65 ± 1.74%) and MCBs (97.68 ± 0.63%; p = 0.426).
Reaction time (RT)
The ANOVA revealed a significant main effect of the factor hand on the RT data (F(1,16) = 11.45, p = 0.004), with longer response times for left (500 ± 12 ms) than right hand movements (482 ± 11 ms; both trial types and contexts pooled together; log-transformed in Fig. 3D). Hence, it took more time for the subjects to respond when the target indicated a nondominant hand response compared with when a movement with the dominant hand was required. These findings are in agreement with the accuracy data indicating a preference for responding with the dominant hand.
As expected, the ANOVA also showed a significant main effect of the factor trial (F(1,16) = 91.06, p < 0.00001); RTs were longer in incongruent (548 ± 17 ms) than in congruent trials (435 ± 7 ms, both hand and contexts pooled together; Fig. 3E). Interestingly, this trial effect also depended on the context within which the responses were provided, as revealed by a significant trial × context interaction on the RT data (F(1,16) = 11.52, p = 0.003). As depicted in Figure 3F, the RT difference between congruent and incongruent trials was attenuated in MIBs compared with MCBs. Interestingly, this effect was not due to a fastening of response times on incongruent trials; the latter trials were associated with comparable RTs in MIBs (544 ± 19 ms) and MCBs (551 ± 18 ms; p = 0.209). In contrast, RTs on congruent trials varied between the two block types; they were significantly longer in MIBs (445 ± 8 ms) compared with MCBs (424 ± 8 ms; p = 0.003). Hence, control processes associated with conflict expectation did not allow subjects to respond faster. On the contrary, they tended to slow down RTs following congruent signals.
Notably, the scores provided at the end of each trial tended to be higher in MIBs (average score: 8.50 ± 0.46 a.u.) than in MCBs (average score: 7.79 ± 0.40 a.u.), consistent with the higher accuracy in the former block types. However, this effect was not significant (t(1,16) = −1.839; p = 0.084). This negative finding may be explained by the fact that the scores not only depended on the accuracy (which showed a main effect of block; F(1,16) = 7.33, p = 0.01) but also relied on the RT (which was comparable in both block types; F(1,16) = 1.15, p = 0.30). Hence, overall, the feedback was approximately comparable in MCBs and in MIBs.
In conclusion, the behavioral data indicate that conflict expectation is associated with the recruitment of control processes that enhance the ability to solve conflicting visuomotor choices. However, this amelioration occurs at the cost of speed: subjects become more accurate on incongruent trials but respond more slowly to easy, congruent signals.
Midfrontal theta activity
The cluster-based statistical analysis revealed that ΔSpectAmp was significantly different from 0 for a cluster of data points (i.e., cluster thresholded at the Monte-Carlo significance probability of 0.05; Fig. 4A). The cluster extended from 4700 to 5400 ms and from 6 to 8 Hz, hence largely overlapping with the theta range (i.e., 4–8 Hz). Visual inspection of the grand-average TF map obtained for the Fz electrode (Fig. 4B) indicates that the ΔSpectAmp was positive in this TF window, revealing a higher spectral amplitude in MIBs than in MCBs. Further, visual inspection of the topography (Fig. 4C) suggests that this effect is restricted to the Fz electrode: ΔSpectAmp was higher at Fz than at any other midline electrodes. To provide statistical evidence for this observation, the values of each data point composing the cluster were averaged into a single value for the Fz, the Fpz (anterior to Fz), and the Cz (posterior to Fz) electrodes. An ANOVA performed on these average ΔSpectAmp values revealed a significant effect of the factor electrode (F(2,30) = 5.58, p = 0.008); Fisher LSD post hoc tests showed that ΔSpectAmp was indeed significantly higher at Fz (140.88 ± 25.63 μV/m2) than at both Fpz (−36.56 ± 58.41 μV/m2; p = 0.006) and Cz (−33.08 ± 36.47 μV/m2; p = 0.007), with no significant difference between Fpz and Cz (p = 0.954; Fig. 4D). Hence, consistent with previous findings in the literature (Van Driel et al., 2015), conflict expectation increased midfrontal theta activity in the present study, corroborating the idea that it represents an important marker of cognitive control (Gulbinaite et al., 2014; Herz et al., 2017; Wang et al., 2017; Lin et al., 2018; Vissers et al., 2018).

Effect of conflict expectation on midfrontal theta activity. A, The cluster-based statistical analysis revealed that ΔSpectPower, a marker of theta activity due to conflict expectation, was significantly different from 0 for a cluster of data points in the theta range. B, Grand-average TF maps were obtained for the Fpz (top), Fz (middle), and Cz (bottom) electrodes. For illustrative purposes, maps were resampled by multiplying temporal and frequency resolutions by a factor of 10. Rectangle (black dotted lines) represents the significant cluster on each map: note the significantly higher ΔSpectPower for the midfrontal Fz electrode specifically (absence of effect for the two other electrodes). C, Grand-average topography was obtained using the time-frequency boundaries of the detected cluster to extract the values at each electrode: 4700 ms, 5400 ms/6 Hz, 8 Hz. D, Post hoc results show the larger ΔSpectPower for Fz compared with Fpz and Cz. Time-frequency boundaries used to extract the cluster-level average values in each subject are the same as in C. Bar graphs indicate group-level mean ± SE. *Significant difference at p < 0.05.
Visuomotor activity
SSVEP data
The cluster-based statistical analysis revealed a significant main effect of the factor hemisphere on two clusters of data points (cluster thresholded at the significance probability of 0.05; Fig. 5A). A first cluster was centered on the TargetSq frequency (16.4–16.8 Hz) and spread over the five ROIPost_1–5 locations (Fig. 5C). As expected, the SSVEP amplitude was higher in this frequency range for the HEMIContra-to-Target than for the HEMIIpsi-to-Target (p < 0.0001). A second cluster was centered on the Flanker-CSq frequency (12.3–12.7 Hz) and extended from ROIPost_2 to ROIPost_5. Here, the SSVEP amplitude was lower for the HEMIContra-to-Target than for the HEMIIpsi-to-Target (p = 0.0009; Fig. 5B). This was expected given that the two hemispheres are, respectively, ipsilateral and contralateral to the Flanker-CSq (see Materials and Methods). Hence, both the TargetSq and the Flanker-CSq elicited predominant SSVEP responses in the contralateral hemisphere. Such an effect of hemisphere was not observed for the Flanker-PSq frequency (i.e., at 14.2 Hz), consistent with the fact that these squares were located on both sides of the central fixation point.

Effect of the factor hemisphere on SSVEPs. A, The cluster-based statistical analysis revealed a significant main effect of hemisphere on two clusters of data points (red). B, Effect of hemisphere at the Flanker-CSq frequency. Top, Grand-average channel maps as obtained for HEMIContra-to-Target (left) and HEMIIpsi-to-Target (right; ipsilateral and contralateral to the Flanker-Csq, respectively). The ROIPost locations (2–5) showing a significant hemisphere effect are comprised in the rectangles (black dotted lines). Bottom left, Grand-average frequency spectra (all electrodes composing the cluster pooled together) as obtained for the HEMIContra-to-Target (solid line) and HEMIIpsi-to-Target (dashed line). Gray rectangle represents the frequency window of statistical significance. *Significant difference at p < 0.05. Bottom right, Grand-average topographies at 12.5 Hz for left- and right-shifted stimuli (left and right topographies, respectively). *The electrode composing the detected cluster. C, Same as B for the TargetSq frequency.
Interestingly, the cluster-based analysis also showed a significant main effect of the factor context (cluster thresholded at the significance probability of 0.05; Fig. 6A). The cluster was centered on the Flanker-PSq frequency (14.0–14.4 Hz) and expanded from ROIPost_1 to ROIPost_3 (Fig. 6B). In this cluster, SSVEP amplitude was lower in MCBs than in MIBs (p = 0.013), suggesting a surprisingly higher attention toward goal-irrelevant locations when conflict was expected compared with when it was unlikely.

Effect of the factor context on SSVEPs. A, The cluster-based statistical analysis revealed a significant main effect of context on two clusters of data points (red). B, SSVEP amplitude in MCB (orange) and MIB (red) blocks. Top left, Grand-average channel maps as obtained for MCBs and MIBs. The ROIPost locations (1–3) showing a significant effect of the factor context at the Flanker-PSq frequency are comprised in the rectangles (black dotted lines). Top right, Grand-average frequency spectra (all electrodes composing the cluster pooled together) as obtained for the MCBs (orange) and MIBs (red). There is higher Flanker-PSq-related SSVEPs in MIBs compared with MCBs. Gray rectangle represents the frequency window of statistical significance. *Significant difference at p < 0.05. Bottom, Grand-average topographies at 14.2 Hz for left- and right-shifted stimuli (left and right topographies, respectively). *The electrode composing the detected cluster.
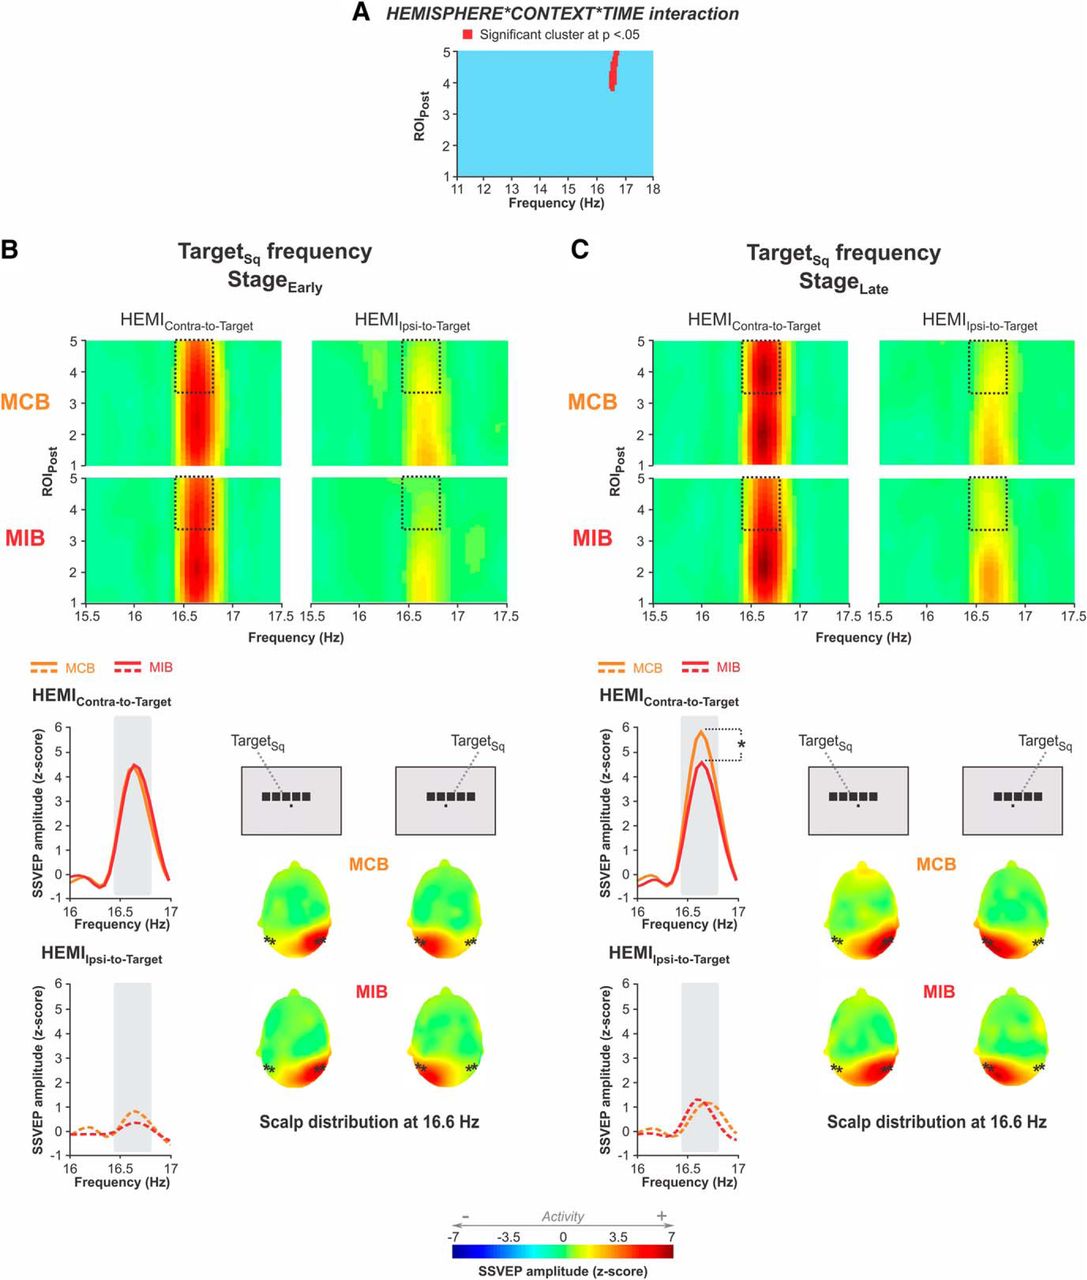
Finally, the cluster-based analysis revealed a significant effect of the factor time on a cluster centered on the TargetSq frequency (16.4–16.8 Hz) and expanding from ROIPost_2 to ROIPost_5 (cluster thresholded at the significance probability of 0.05); here, the SSVEP amplitude appeared to be higher at StageLate than at StageEarly (p < 0.0001). However, this effect of time depended on both the hemisphere and the context considered; there was a significant hemisphere × context × time interaction on a cluster of data points centered over the TargetSq frequency (16.4–16.8 Hz) and expanding from ROIPost_4 to ROIPost_5 (cluster thresholded at 0.05; Fig. 7A), thus overlapping largely with the data points showing the main effect of time. Interestingly, Fisher LSD post hoc tests revealed that, although SSVEPs were comparable in both contexts at StageEarly, whether considering the HEMIContra-to-Target (p = 0.503) or the HEMIIpsi-to-Target (p = 0.157), they became different in both block types at StageLate. Indeed, the SSVEP amplitude in the HEMIContra-to-Target was surprisingly lower in MIBs than in MCBs at this later stage (p = 0.002). Consistently, the SSVEP amplitude increased in the HEMIContra-to-Target from StageEarly to StageLate in MCBs (p = 0.0008), whereas it remained stable in MIBs (p = 0.879). Such an increase from StageEarly to StageLate did not occur in the HEMIIpsi-to-Target, neither in MCBs (p = 0.669) nor in MIBs (p = 0.072), hence leading to comparable SSVEP amplitudes in both contexts in the HEMIIpsi-to-Target at StageLate (p = 0.988).

Effect of the hemisphere × context × time interaction on SSVEPs. A, The cluster-based statistical analysis revealed a significant hemisphere × context × time interaction on a cluster of data points (red). B, StageEarly. Top, Grand-average channel maps as obtained for HEMIContra-to-Target (left) and HEMIIpsi-to-Target (right), in MCBs (top) and MIBs (bottom). The ROIPost locations (4–5) showing a significant hemisphere × context × time interaction are comprised in the rectangles (black dotted lines). Bottom left, Grand-average frequency spectra as obtained for the HEMIContra-to-Target (solid line) and HEMIIpsi-to-Target (dashed line), in MCBs (orange) and MIBs (red). The frequency spectra measured at the electrodes composing the detected cluster were averaged together. Gray rectangle represents the frequency window of statistical significance. *Significant difference at p < 0.05. Bottom right, Grand-average topographies at 16.6 Hz for left- and right-shifted stimuli (left and right topographies, respectively). *The electrode composing the detected cluster. C, Same as B for StageLate. *Significant difference at p < 0.05.
Hence, the SSVEP data indicate that control processes recruited in anticipation of conflict do not narrow or strengthen visual attention toward the goal-relevant stimulus location. On the contrary, TargetSq SSVEP responses were smaller in MIBs compared with MCBs in the late stage of the fixation period. In addition, Flanker-PSq SSVEP responses were globally higher in MIBs than in MCBs. These results indicate a reduction of the focus of selective attention in MIBs. Therefore, the higher accuracy of subjects in incongruent trials of MIBs cannot be accounted for by an enhanced selectivity of visual attention.
RLP data
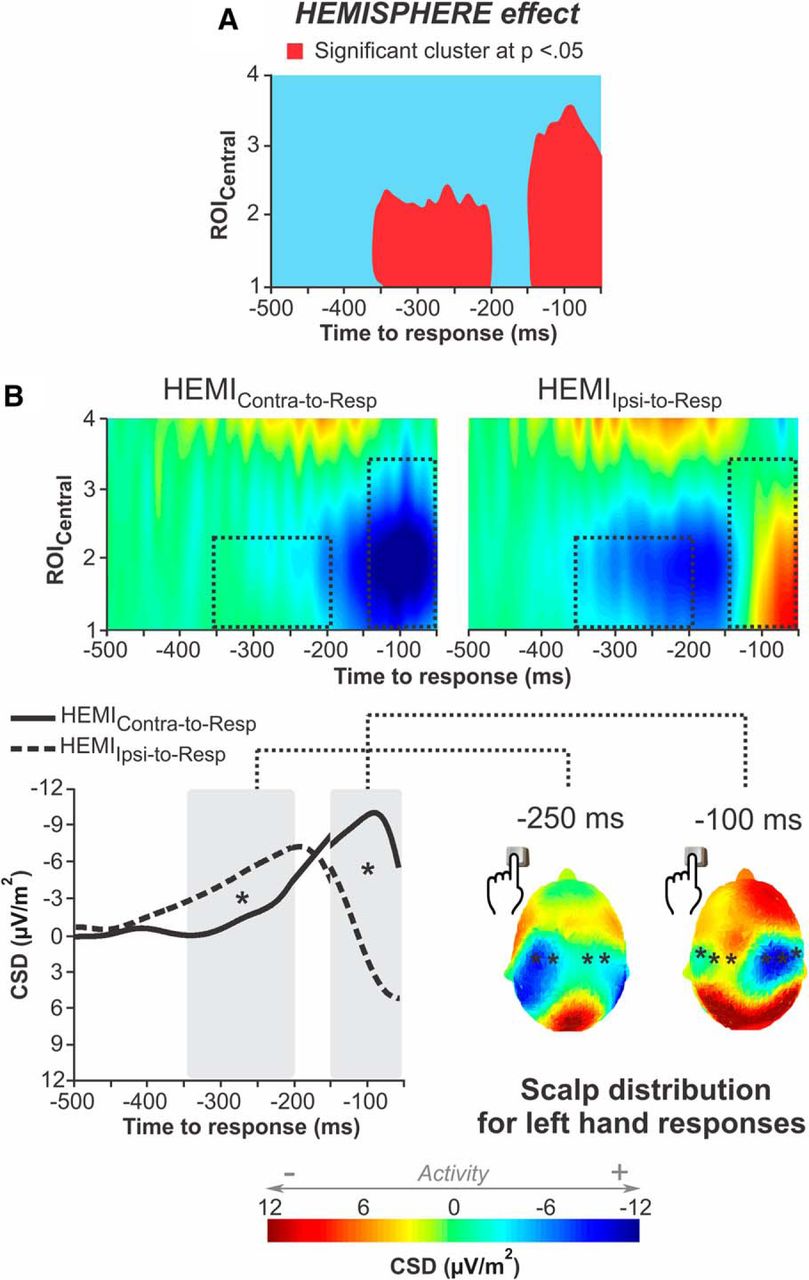
Our cluster-based analysis revealed a significant main effect of the factor hemisphere on two clusters of data points (cluster thresholded at p < 0.05; Fig. 8A). A first cluster extended from −350 to −200 ms with respect to movement onset and concerned the ROICentral_1–2 locations. Interestingly, in this time window, the RLP amplitude was higher (i.e., more negative) in the HEMIIpsi-to-Resp than in the HEMIContra-to-Resp (p < 0.0001; Fig. 8B). Then, a later cluster expanded from −150 to −50 ms and concerned ROICentral_1–3: in this time window, the RLP amplitude was higher in the HEMIContra-to-Resp than in the HEMIIpsi-to-Resp (p < 0.0001, respectively; Fig. 8B). Hence, on average, subjects initially showed a higher activity in the motor cortex ipsilateral to the responding hand, compared with the contralateral one. The pattern then reversed, with activity becoming stronger in the contralateral motor cortex as movement execution drew nearer.

Effect of the factor hemisphere on RLPs. A, The cluster-based statistical analysis revealed a significant main effect of the hemisphere factor on two clusters of data points (red). B, Top, Grand-average channel maps as obtained for HEMIContra-to-Resp (left) and HEMIIpsi-to-Resp (right). The ROICentral locations showing a significant effect of hemisphere are comprised in the rectangles (black dotted lines). Bottom left, Grand-average RLP waveforms as obtained for the HEMIContra-to-Resp (solid line) and HEMIIpsi-to-Resp (dashed line). The RLPs measured at the electrodes composing the two detected clusters were averaged separately; that is, ROICentral_1 and ROICentral_2 were exploited to compute the left segment of the RLP (from −500 ms to −150 ms) while the averaging for the right segment also involved ROICentral_3 (from −150 to −50 ms). Gray rectangles represent the time windows of statistical significance. *Significant difference at p < 0.05. Bottom right, Grand-average topographies at −250 ms and −100 ms (left and right topographies, respectively) for left hand responses. *The electrode composing the detected cluster.
Notably, the hemisphere effect reported above on the first cluster (i.e., from −350 to −200 ms before movement onset) depended on the type of trial the subjects encountered and on the hand they selected; there was a significant hemisphere × hand × trial interaction on a cluster of data points centered over the ROICentral_2 location and extending from −320 to −150 ms, thus overlapping largely with the data points showing the hemisphere effect (cluster thresholded at p < 0.05; Fig. 9A).

Effect of the hemisphere × hand × trial interaction on RLPs. A, The cluster-based statistical analysis revealed a significant main effect of the hemisphere × hand × trial interaction on a cluster of data points (red). B, Left, Grand-average channel maps as obtained for congruent trials, for left (top row) and right (bottom row) hand responses, in HEMIContra-to-Resp (left column) and HEMIIpsi-to-Resp (right column). The ROICentral location showing a significant hemisphere × hand × trial interaction is comprised in the rectangles (black dotted lines). Right, Same as B. Left, Incongruent trials. C, Left, Grand-average RLP waveforms as obtained for congruent (left column) and incongruent (right column) trials, for left (top row; green) and right (bottom row; blue) responses, in the HEMIContra-to-Resp (solid lines) and HEMIIpsi-to-Resp (dashed lines). The RLP waveform measured at the electrode composing the detected cluster was extracted for each condition. Gray rectangle represents the time window of statistical significance. *Significant difference at p < 0.05. Right, The same RLP waveforms as the ones represented in C. Left, Exploited to highlight the significant differences in RLP amplitude for left and right responses in incongruent trials. RLPs obtained in the HEMIContra-to-Resp and HEMIIpsi-to-Resp are represented at top and bottom rows, respectively. D, Grand-average topographies for congruent (left; obtained at −250 ms) and incongruent (right; at −200 ms) trials. For each trial type, topographies for both hand responses are represented. *The electrode composing the detected cluster.
In congruent trials, we observed a preponderant ipsilateral activity whether the subjects responded with the left (i.e., significant difference between HEMIIpsi-to-Resp and HEMIContra-to-Resp: p = 0.012) or the right hand (p = 0.051; Fig. 9B–D). Hence, action selection in the flanker task involved an initial predominant increase in the activity of the ipsilateral motor cortex, even in the absence of conflict.
Interestingly, in incongruent trials, this pattern of activity was observed for left (significant difference between HEMIIpsi-to-Resp and HEMIContra-to-Resp: p < 0.0001) but not for right hand responses (p = 0.36; Fig. 9B–D). Accordingly, left hand responses were associated with a larger activity in the HEMIIpsi-to-Resp than right hand trials (p = 0.0004). Hence, in the presence of conflict, ipsilateral activity was more pronounced in the dominant (left) motor cortex (preceding left hand responses) than in the nondominant (right) one (preceding right hand responses). Notably, a similar effect was observed for the HEMIContra-to-Resp: contralateral activity was larger in the dominant (left) motor cortex (preceding right hand responses) than in the nondominant (right) one (preceding left hand responses; p = 0.019). Together, these results indicate that incongruent trials are associated with a stronger activation of the dominant motor cortex compared with the nondominant one, regardless of whether the response has to be provided with the right (dominant) or the left (nondominant) hand.
Finally, our analysis also revealed a significant hemisphere × trial × context interaction on a cluster of data points extending from −300 to −190 ms and involving the ROICentral_1–2 locations (cluster thresholded at p < 0.05; Fig. 10A).

Effect of the hemisphere × trial × context interaction on RLPs. A, The cluster-based statistical analysis revealed a significant main effect of the hemisphere × trial × context interaction on a cluster of data points (red). B, Left, Grand-average channel maps as obtained for congruent trials, for MCB (top row) and MIB (bottom row) contexts, in HEMIContra-to-Resp (left column) and HEMIIpsi-to-Resp (right column). The ROICentral location showing a significant hemisphere × trial × context interaction is comprised in the rectangles (black dotted lines). Right, Same as B. Left, Incongruent trials. C, Left, Grand-average RLP waveforms as obtained for congruent (left column) and incongruent (right column) trials, for MCB (top row; orange) and MIB (bottom row; red) contexts, in the HEMIContra-to-Resp (solid lines) and HEMIIpsi-to-Resp (dashed lines). The RLP waveforms measured at the electrodes composing the detected cluster were averaged together for each condition. Gray rectangle represents the time window of statistical significance. *Significant difference at p < 0.05. Right, The same RLP waveforms as the ones represented in C (left) were exploited to highlight the significant differences in RLP amplitude in the HEMIIpsi-to-Resp between MCB and MIB contexts in incongruent trials. RLPs obtained in the HEMIContra-to-Resp and HEMIIpsi-to-Resp are represented at top and bottom rows, respectively. D, Grand-average topographies obtained at −230 ms for congruent (left) and incongruent (right) trials. For each trial type, topographies for both hand responses and both contexts are represented. *The electrodes composing the detected cluster.
We did not observe any effect of conflict expectation on motor activity in congruent trials. RLPs were comparable in the MCB and MIB contexts, whether recorded in the HEMIIpsi-to-Resp (p = 0.17; Fig. 10B–D) or the HEMIContr-to-Resp (p = 0.09). In contrast, we observed significant differences in RLPs between the two block types for the HEMIIpsi-to-Resp in incongruent trials. As such, ipsilateral activity was significantly larger in MIBs than in MCBs (p = 0.002); such a context-dependent effect was not present for the HEMIContra-to-Resp (p = 0.96).
Hence, the RLP data suggest that conflict expectation does not reduce the impact of incongruent stimuli on motor activity. On the contrary, activation of the ipsilateral motor cortex became larger in the MIBs than in the MCBs following incongruent signals. Therefore, the higher accuracy of subjects in incongruent trials of MIBs cannot be accounted for by a specific reduction in the activation of inappropriate motor representations. Contrariwise, these cortical representations were more active in MIBs than MCBs.
Together, our results confirm that subjects are better at resolving conflict when it is expected in advance and that this enhancement is associated with a higher midfrontal theta activity. Surprisingly, the SSVEP and RLP data point out that these changes occur in parallel with a reduced filtering of information at the visual level and increased inappropriate activations at the motor level. Hence, conflict expectation seems to recruit control processes that augment the tolerance for inappropriate motor activations (rather than on processes that downregulate their amplitude), allowing them to occur without leading to the selection of an incorrect response. This mechanism might contribute to the enhancement of accuracy, but may restrain decision speed.
Methodological note
Given the experimental design, congruent and incongruent trials could be either minority (in MIB and MCB, respectively) or majority (in MCB and MIB, respectively). This means that averages were computed on a varying amount of trials. To account for this possible bias when analyzing the RLP data (not applicable for SSVEP and ΔSpectAmp data given the absence of factor trial for these dependent variables), additional analyses were run using an equalized number of epochs across conditions (set based on the condition involving the smallest amount of trials). Importantly, these analyses provided the same RLP results as those presented using the full set of trials.
Another point of consideration for the RLP analysis concerns the time window used for baseline correction (i.e., −700 to −500 ms with respect to the response). As such, because the RT varied between conditions (and between subjects), this time window could overlap with the last second of the flickering period, either in part (i.e., in the case of RTs longer than 500 ms) or in total (i.e., for RTs shorter than 500 ms). In other words, the baseline overlapped with the period during which SSVEPs were induced. To control for this potential bias, we tested different time windows for baseline correction (i.e., −800 to −600 ms, −900 to −700 ms), getting back in time with respect to the motor response, and thus increasing the fraction of the time window overlapping with the flickering period. Again, we obtained the exact same results as in the main analysis, indicating the robustness of the effects reported.
Discussion
The primary goal of the present study was to investigate the impact of conflict expectation on selective attention in the visual cortex and on action selection in the motor cortex. We recorded SSVEPs and RLPs during an Eriksen Flanker task where conflict was either highly predictable (MIBs) or very unlikely (MCBs). In addition, we also considered midfrontal theta activity during the fixation period as a marker of cognitive control.
Midfrontal theta activity was higher in MIBs than in MCBs, indicating that the engagement of control processes recruited in anticipation of conflict: these are probably responsible for the fact that subjects responded more accurately in incongruent trials when conflict was expected. Notably, this enhanced accuracy in MIBs occurred at the cost of speed, as subjects became slower to respond in congruent trials. Yet, surprisingly, visuomotor activity was less finely tuned in MIBs. As such, target-related SSVEPs were smaller while peripheral flanker-related SSVEPs were higher in MIBs than MCBs, and RLPs were larger in the ipsilateral motor cortex during conflicting trials of MIBs. These findings suggest that conflict expectation recruits cognitive control processes that augment the tolerance for inappropriate visuomotor activations, allowing them to occur without leading to the selection of an incorrect action.
As expected, movement initiation was associated with a prominent activity in the motor cortex contralateral to the responding hand. Indeed, contralateral RLPs became larger than ipsilateral ones from −150 ms preceding movement onset, consistent with the literature (Nguyen et al., 2014; Noorbaloochi et al., 2015). However, activity in the ipsilateral motor cortex was surprisingly pronounced in our task, even in congruent trials. Indeed, congruent trials were associated with an initial boost of ipsilateral activity, which surpassed contralateral activity from ∼−350 to −200 ms before movement onset, regardless of the context or of the responding hand. Albeit not highlighted in the past, this effect seems also present in previous studies using flanker tasks (Praamstra and Seiss, 2005; Klein et al., 2014). Why should the ipsilateral (nonselected) motor cortex become so active soon after the imperative signal, even in the absence of conflict? One possibility is that it has to do with the distribution of inhibitory influences directed at motor representations during action preparation (Derosiere, 2018). Indeed, these influences are predominantly directed at selected representations (Quoilin and Derosiere, 2015; Vassiliadis et al., 2018) and only to a smaller extent at nonselected ones. Given that EEG potentials result from the summation of excitatory and inhibitory processes (Muthukumaraswamy et al., 2013), one may assume that the higher activity initially observed in the ipsilateral motor cortex is due to the lower level of preparatory inhibition directed at this (nonselected) area, compared with the selected, contralateral one.
Conflict expectation altered the strength of ipsilateral motor activity in incongruent trials but not in congruent ones. Indeed, the RLP data revealed a comparable level of motor activity for congruent trials, whether performed in MIBs or MCBs. Conversely, incongruent trials were associated with a higher activity in the ipsilateral motor cortex in MIBs compared with MCBs. This indicates that inappropriate motor activity following conflicting signals was larger when conflict had been anticipated compared with when it occurred unexpectedly. Importantly, these neural responses were obtained in trials where subjects turned out to select the correct action. Hence, the (high) ipsilateral activity observed in MIBs must have remained nevertheless “below threshold” given that it did not lead to the selection of an inappropriate response. This finding suggests that conflict expectation is associated with an extension of the distance to threshold in MIBs. Such an extension may be implemented by a rise in the selection threshold or by a decrease in the level at which the motor cortex starts to accumulate neural activity (i.e., the starting point) (Herz et al., 2017; Kim et al., 2017). Indeed, several lines of evidence suggest that conflict expectation could downregulate the starting point of neural accumulation. Indeed, previous studies showed that the motor cortex exhibits a drop of baseline activity when task requirements constrain subjects to focus on decision accuracy (Pastötter et al., 2012; Thura et al., 2016) (i.e., as when conflict occurrence is frequent). Along the same line, recent TMS studies revealed that corticospinal excitability is globally suppressed when conflict is highly expected compared with when it is unlikely (Klein et al., 2014; Duque et al., 2016). Most noticeably, this global suppression has been evidenced at the time of the imperative signal, consistent with a downregulation of the starting point of neural accumulation. Unfortunately, the presence of such a shift cannot be detected in the current EEG dataset as prestimulus signals are exploited to correct RLPs for baseline fluctuations, annihilating any putative differences in baseline activity between the different conditions (Maess et al., 2016).
At the behavioral level, an enlarged distance to threshold is thought to produce a shift in speed-accuracy tradeoff, favoring accuracy over speed, as revealed by studies using computational modeling of behavioral data (Forstmann et al., 2010; Hauser et al., 2017; Thura and Cisek, 2017). Accordingly, here (and in Burle et al., 2016), subjects were more accurate in incongruent trials of MIBs than MCBs but showed longer RTs in easy, congruent trials. We recognize that one would assume a shift in speed-accuracy tradeoff to induce a global reduction of decision speed, altering RTs regardless of the trial type, whereas here (and in Burle et al., 2016), the deceleration was only present in congruent trials. This may be due to the fact that subjects had to respond under a fixed deadline. Given that RTs are long by default in incongruent trials (i.e., even in MCBs), the imposed time limit may have left little space for a further slowdown in MIBs. Future studies should investigate the effect of conflict expectation on decision speed in the absence of temporal constraints.
Incongruent trials were associated with a particularly low level of activity in the ipsilateral motor cortex when conflict had not been expected in advance. As such, inappropriate motor activity was less pronounced in MCBs than in MIBs, as explained above. Moreover, the ipsilateral motor activity elicited by incongruent signals in MCBs was also less pronounced than that recorded in the same context following congruent signals. Hence, when conflict occurred unexpectedly, inappropriate motor activity was strongly restrained. One possibility is that conflict detection in MCBs led to the recruitment of online control processes suppressing inappropriate activations. Such an online inhibitory mechanism has been proposed to operate during action reprogramming, as when sudden environmental changes call for the suppression of habitual motor responses (Mars et al., 2009; Neubert et al., 2010), or when unexpected obstacles require to abort initially planned movement trajectories (Archambault et al., 2011). Our results suggest that such processes may also assist action selection in front of unexpected conflict.
Interestingly, the efficiency of online control processes has been shown to depend on the degree of visual attention directed at goal-relevant information (Reichenbach et al., 2014). Our data are coherent with these previous findings. As such, we observed that the level of attention directed toward the target location was stronger in MCBs than in MIBs, whereas attention to goal-irrelevant locations was reduced in the former than in the latter context. A sharper attentional focus in MCBs may have allowed subjects to limit the impact of incongruent flankers on motor activity when they appeared unexpectedly. Such a control system may be particularly prominent in contexts where conflict is rare, as it allows to limit the impact of conflict when it occurs, without slowing down responses otherwise.
Hence, control strategies seem to be adapted to favor success in the most common type of trials in a given context. A low distance to threshold combined with substantial online control is the most efficient strategy in MCBs: it allows fast responses on most (congruent) trials while ensuring a reasonable level of accuracy when conflict eventually occurs. In contrast, a proactive control system extending the distance to threshold is the most efficient strategy in MIBs: it allows accurate responses in most (incongruent) trials, and the cost in terms of speed merely concerns a minority of (congruent) trials.
Finally, another interesting finding concerns the involvement of the dominant motor cortex in conflict resolution. In the presence of conflict, neural activity was higher in the left (dominant) motor cortex than in the right (nondominant) one, regardless of the responding hand. This finding suggests that the left motor cortex contributes to a higher extent to the resolution of visuomotor conflict than the right one. Consistently, control processes underlying the execution of visually guided movements are asymmetrically organized in the human brain with a superiority of the left cerebral hemisphere (Haaland et al., 2000; Frey, 2008; Bardi et al., 2013). Our findings indicate that the predominance of the left motor cortex goes beyond motor control processes and extends to motor decision-making. Moreover, because this effect was observed in both MCBs and MIBs, the dominance of the left hemisphere seems to concern conflict resolution regardless of the actual control strategy recruited to ensure appropriate behavior.
In conclusion, the comparison of visuomotor activity in MCBs and MIBs suggests that conflict resolution relies on distinct control strategies depending on the level of conflict expectation. When most trials are conflicting, the distance to threshold may be generally enlarged in a proactive way, allowing inappropriate visuomotor activity to occur without having it cause incorrect responses, hence favoring accurate performance on most trials. Conversely, when conflict is rare, the distance to threshold may be shorter, allowing fast responses on most (congruent) trials; in this context, conflict resolution seems to rather rely on a sharp attentional focus on the target with a low attention toward goal-irrelevant locations and on online inhibition of inappropriate motor activity, preventing neural accumulation from reaching the (low) selection threshold.
Footnotes
This work was supported by Université Catholique de Louvain Fonds Spéciaux de Recherche, Belgian National Funds for Scientific Research FRS-Fonds National de la Recherche Scientifique MIS F.4512.14, and Fondation Médicale Reine Elisabeth. G.D. was a postdoctoral fellow supported by a Marie Sklodowska Curie co-fund Grant (cofunded by the Fonds National de la Recherche Scientifique). P.-A.K. and S.N. were PhD students supported by Fonds National de la Recherche Scientifique Grant. A.Z. was a Senior Research Associate supported by INNOVIRIS.
We declare no competing financial interests.
- Correspondence should be addressed to Dr. Gerard Derosiere, CoActions Lab, Institute of Neuroscience, Université Catholique de Louvain, Av. Mounier, 53 Bte B1.53.04, 1200 Bruxelles, Belgium. gerard.derosiere{at}uclouvain.be


