

Article Figures & Data
Figures
- Figure 1.
Architectures of the three network classifiers considered in the study and their scaling properties. a, Fully connected readout, considered in the subsection Fully connected readout. The capacity of this classifier grows linearly with the number of input units N; however, the number of afferent connections CF grows as quickly as N. b, Committee machine of partially connected perceptrons (section Committee machine). The collective decision is made using a majority vote. Even though the number of connections per perceptron can be kept constant as the number of input neurons N increases, the number of readouts M has to grow with N to match the performance scaling of a. The majority vote strategy requires another downstream readout, whose connectivity grows with M and hence with N. c, The recurrent readout that we propose in section Committee machine with recurrent connections. As N → ∞, the number of feedforward connections per perceptron CF, the number of recurrent connections per perceptron CR, as well as the number of connections of the downstream readout stay constant when N increases.
- Figure 2.
Graphical representation of the mean field equation (Eq. 3.38). The left-hand side of the equation is represented by the line, and the right-hand side, by the sigmoidal curve. The slope of the sigmoidal curve is determined by the amount of noise relative to the strength of the recurrent connections (βCRα), and the shift relative to m = 0 is based on the expected value of the feedforward input hkν. a, When the input pattern belongs to the positive class and the noise is high, there is only one solution to the equation, which corresponds to the small but positive value m = ms. This solution is stable. b, For the “negative” input pattern, the solution is negative, ms < 0. c, d, In the case of low noise, there are three solutions to the mean field equation, with two extreme solutions ms and −mS being stable, and the middle one mu, which is close to zero, being unstable. For the case of the positive input pattern, mu < 0, and for the case of negative pattern mu > 0.
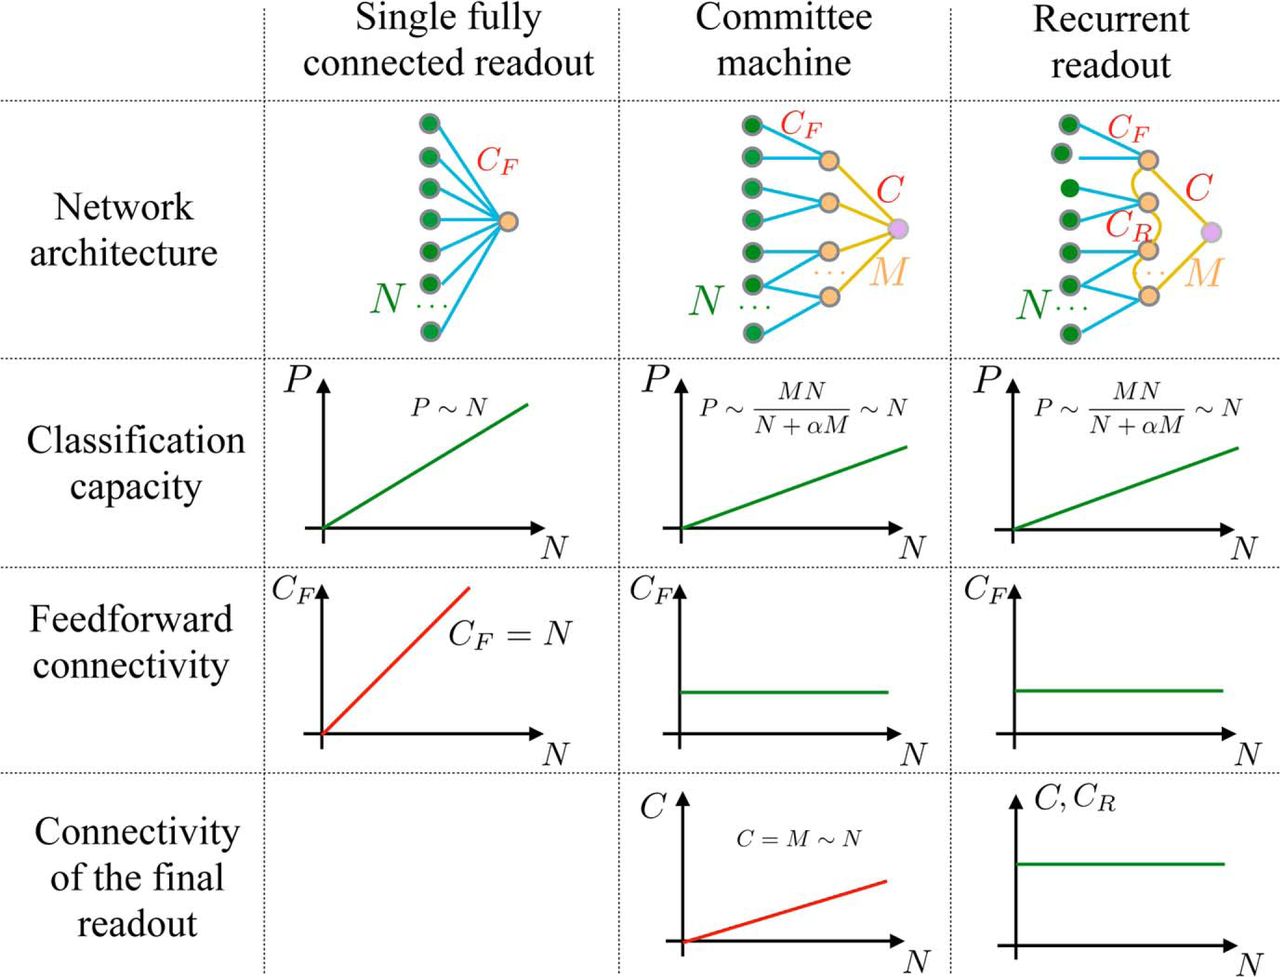
- Figure 3.
Summary of the scaling properties of the three architectures considered in our study. A single fully connected readout (classical perceptron) achieves a classification capacity P that grows linearly with the number of input neurons N. The input neurons are green and the output neuron is orange. However, the number of feedforward connections that converge onto a single neuron CF also increases linearly with N. The committee machine with M members (orange neurons) solves this problem by limiting the number of connections CF per member neuron. This number does not scale with N, and hence it can be relatively small. The classification capacity P still scales linearly with N thanks to the contributions of M partially connected perceptrons, which are combined using a majority vote scheme. The majority vote, however, implies the existence of a final readout, which counts the votes of all the members of the committee. This readout can be implemented with a neuron with C connections, where C is equal to M, and thus scales linearly with N. The suggested recurrent readout architecture on the right achieves the linear growth of the capacity while keeping CF, C, and the number of recurrent connections per neuron CR constant as N increases.
- Figure 4.
Network regimes depend on the sparseness of the input (determined both by the sparseness of the feedforward connectivity CF and by the sparsenss f of the input representations) and on the noise level with respect to the recurrent and feedforward inputs. β is the inverse temperature parameter, CR is the recurrent connectivity, and α is the strength of the recurrent synapses. In the high-noise regime, the network can always be analyzed as a single homogeneous population of neurons (uniform regime). For intermediate and low noise, the network operates in the two-subnetwork regime when the input is sparse, and in the uniform regime when the input is dense. In the two-subnetwork regime, the recurrent neurons should be divided into the following two groups: those that receive a feedforward input and those whose input is zero.
- Figure 5.
a-c, The linear dependence of the classification capacity of the recurrent readout P on the number of input neurons N, when the number of intermediate perceptrons M is increased proportionally to N, so that c =
 remains constant (we assumed c = 5). The red and green lines correspond to dense (f = 0.5) and sparse (f = 0.01) representations. The number of feedforward connections per perceptron is CF = 50, and the tolerated error rate is ϵ = 0.05. a, High-noise regime: the noise is large compared with the feedforward input. For the dense case (red line), β = 0.04, and for the sparse case (green line) β = 0.9; these choices correspond to a ratio of the noise to feedforward input equal to 10. b, Intermediate level of noise: the noise is low compared with the feedforward input, but large when compared with the input from the input receiving to the free neurons in the case of sparse input representations (two-subnetwork regime). The red line corresponds to dense input representations (uniform low-noise regime), and the green line corresponds to the two-subnetwork intermediate-noise regime. c, Low level of noise. The red line corresponds to the uniform low-noise regime, and the green line corresponds to the two-subnetwork low-noise regime (same as majority vote). d–f, Change of the slope of the plots from a to c, P/N with the coding level f for different values of c. d, High-noise regime. Different curves correspond to different numbers of perceptrons M per input neuron, expressed as c = . The noise parameter β and the strength of the recurrent synapses α are varied with the coding level f to keep the value of ΔUH = 0.2 and the inequality of Equation 3.42 satisfied by the factor of 10 for every value of f. The last condition implies that the ratio of the noise to the amplitude of the feedforward input is equal to 10 for every point on the curve. e, Intermediate level of noise. The low-f segments of the curves represent the two-subnetwork intermediate-noise regime. Either the noise parameter β or the strength of the recurrent synapses α is varied with f to keep ΔTI = 0.2. The high-f segments correspond to the uniform low-noise regime, and α is varied with f so that ΔUL = 0.2. f, Low noise. Low-f segments of the curves correspond to the two-subnetwork low-noise regime (same as majority vote), the high-f segments are the same as in panel e. The dashed green line shows the performance of the fully connected readout for comparison. The green and red points on the c = 5 curve correspond to the values of f used in a–c. The curves on e and f are discontinuous because there is no consistent way to analyze the recurrent dynamics in the perceptron layer across the entire range of f for these levels of noise. However, we believe that the capacity changes smoothly across the unexplored region, achieving its maximum at approximately f ≈ 0.05 for CF = 50.
 - Figure 6.
a, Simulation results (solid lines) and theoretical predictions (dashed lines) for the case of dense input representations, CFf = 10. The green curves correspond to the majority vote scenario (committee machine), and the orange curves correspond to the recurrent readout in the uniform regime with relatively high noise. b, Same for the case of sparse input representation,CFf = 1. The recurrent dynamics of the intermediate layer is in the two-subnetwork regime with relatively high noise.
- Figure 7.
a, Network architecture for the case of structured output (see subsection Structured output). For the case of three-way classification, the intermediate layer of readout neurons is divided into three subpopulations, each selective for its own class of input patterns. The recurrent connectivity is random and excitatory within subpopulations, but there are no recurrent connections between the subpopulations. The final readouts, one for each class, are connected sparsely and randomly, as before, but the sign of the connections is only positive if the presynaptic neuron belongs to the correct subpopulation; the rest are zero or negative. b, Network architecture for the case of random output (subsection Random output). There are no distinct subpopulations in the intermediate layer, and the desired output pattern corresponding to each class of input pattern is chosen randomly. The recurrent connections exist between any pair of readout neurons with equal probability. The strength of these connections, however, is now adjusted according to a Hebbian learning rule (Eq. 4.13). c, The results of the simulation for multinomial classification. The output patterns corresponding to L = 5 classes are chosen randomly with the coding level y = 1/2. The recurrent connectivity is sparse, and the strength of the synapses are trained with the learning rule (Eq. 4.13). The network of recurrently connected perceptrons is in the high-noise regime with dense input representations (CF = 50, f = 0.2, CR = 200, α = 0.015, β = 0.5). The error bars correspond to standard deviations of the capacity over 10 random realizations of the input patterns and network connectivity.
- Figure 8.
a, Schematic plot demonstrating the increase of the classification capacity with the coding level for sparse input representations. When the initial demand on the number of patterns whose classification the animal has to remember is P1, the lower level of activity in the dentate gyrus f1 is sufficient. When the required number of patterns is increased to P2 (e.g., the environment of the animal is enriched) and neither the connectivity of the network nor its size change, the new classification demand can be met by increasing the coding level up to the value f2. b, The quantitative predication of the coding level f as a function of the required capacity P/N for two values of the number of feedforward connections per input neuron (c = 5 and c = 50) in the intermediate- and low-noise regimes.


