

Article Figures & Data
Figures
- Figure 1.
RARα mediates regulation of inhibitory synaptic transmission by RA. A, Example traces of mEPSCs recorded from postcritical period (P35–P40) vehicle-treated and RA-treated V1m L2/3 PNs. Calibration: 20 pA, 0.5 s. B, Cumulative plot of mEPSC interevent interval and quantification of mEPSC frequencies in PNs of control and RA groups. C, Cumulative plot and quantification of mEPSC amplitudes in PNs treated with vehicle or RA. D, Example traces of mIPSCs from control and RA-treated V1m L2/3 PNs. Calibration: 50 pA, 0.5 s. E, F, Quantification of mIPSC frequencies and amplitudes. **p < 0.01 (Student's t test and Kolmogorov–Smirnov test). ***p < 0.001 (Student's t test and Kolmogorov–Smirnov test). G, Quantification of mEPSC frequencies and amplitudes recorded from critical period (P20–P30) V1m L2/3 PNs neurons treated with vehicle or RA. H, Quantification of mIPSC frequencies and amplitudes in critical period PNs from vehicle or RA groups. *p < 0.05 (Student's t test). I, An example image of an acute brain slice taken from a mouse injected with Cre-GFP-expressing AAVs in V1. Scale bar, 500 μm. J, K, Quantification of mIPSC frequencies and amplitudes recorded from mice in the postcritical period injected by AAV-Syn-Cre or AAV-Syn-mCre treated with either vehicle or RA. *p < 0.05 (two-way ANOVA and Kolmogorov–Smirnov test). **p < 0.01 (two-way ANOVA and Kolmogorov–Smirnov test). ***p < 0.001 (two-way ANOVA and Kolmogorov–Smirnov test).
- Figure 2.
RARα expression in PV+ neurons mediates RA's effect on inhibitory synaptic transmission in L2/3 PNs. A, Quantification of basal mIPSCs in cell type-specific RARα cKO mice (RARαfl/fl crossed with CaMKII2α-Cre, GAD2-Cre, PV-Cre, and SST-Cre). B, Representative traces of mIPSCs recorded from vehicle- or RA-treated PNs from CaMKII2α-Cre; RARαfl/fl, GAD2-Cre; RARαfl/fl, PV-Cre; RARαfl/fl, SST-Cre; RARαfl/fl mice. Calibration: 50 pA, 0.5 s. C, Quantification of mIPSC frequencies and amplitudes in neurons treated with vehicle or RA. *p < 0.05 (Student's t test). ***p < 0.001 (Student's t test).
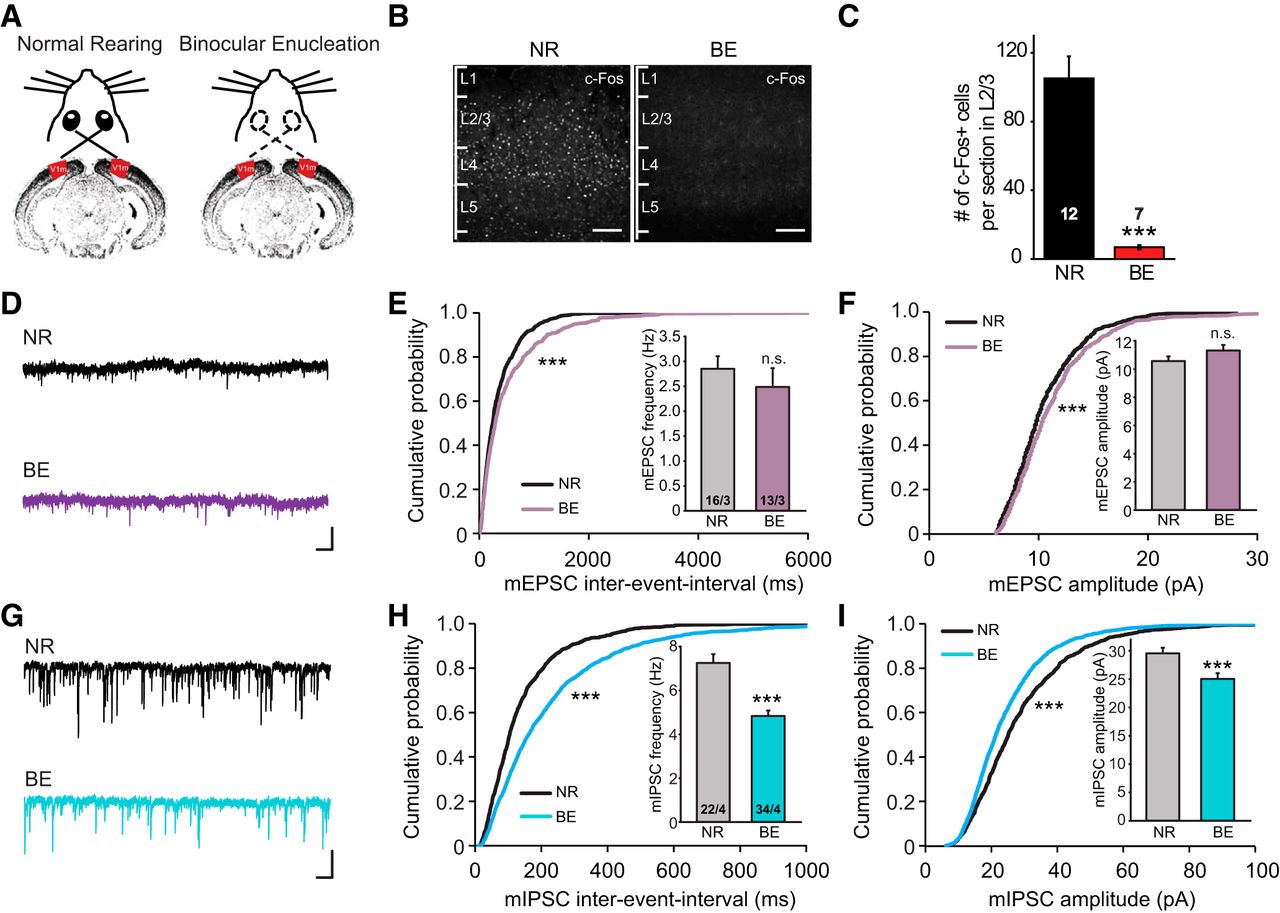
- Figure 3.
Visual deprivation induces homeostatic downregulation of inhibitory synaptic transmission in postcritical period visual cortices. A, Diagram of mice with NR and BE conditions. Recordings were made from L2/3 PNs in the P35–P40 V1m 3 d after BE or mock treatment. B, Examples of c-Fos staining from sections of V1m with NR or 3 d BE experience. Cortical layers (L1–L5) are marked. Scale bar, 100 μm. C, Quantification of total number of c-Fos+ cells per imaged section (630 μm × 180 μm) in L2/3. ***p < 0.001 (Mann–Whitney test). D, Trace examples of mEPSCs recorded in L2/3 PNs from V1m of mice with NR or BE. Calibration: 20 pA, 0.5 s. E, Cumulative plot of mEPSC interevent interval and quantification of mEPSC frequencies. ***p < 0.001 (Kolmogorov–Smirnov test). F, Cumulative plot and quantification of average mEPSC amplitudes under NR and BE conditions. G, Representative traces of mIPSCs recorded in PNs from NR and BE groups. Calibration: 50 pA, 0.5 s. H, I, Cumulative plots and quantifications of mIPSC frequency and amplitude. ***p < 0.001 (Student's t test and Kolmogorov–Smirnov test).
- Figure 4.
RARα deletion in PV+ neurons prevents visual deprivation-induced downregulation of inhibitory synaptic transmission in L2/3 PNs. A, Representative traces recorded from layer 2/3 PNs in PV-Cre; RARαfl/fl and their littermate control mice with either NR or BE. Calibration: 50 pA, 0.5 s. B, Average mIPSC frequencies and amplitudes in mice with RARα KO in PV+ neurons. **p < 0.01 (two-way ANOVA). ***p < 0.001 (two-way ANOVA). C, Representative traces recorded from SST-Cre; RARαfl/fl and their littermate control mice. Calibration: 50 pA, 0.5 s. D, Average mIPSC frequencies and amplitudes in mice with RARα deletion in SST+ neurons. *p < 0.05 (two-way ANOVA). ***p < 0.001 (two-way ANOVA).
- Figure 5.
Visual deprivation does not affect passive and active membrane properties of PV+ neurons. A, Quantification of percentage of L2/3 PV+ neurons expressing RARα mRNAs measured with single-cell qRT-PCR in P35 PV-RARαfl/+ and PV-RARαfl/fl mice. n = the number of cells pooled from 3 or 4 mice per genotype. *p < 0.05 (Mann–Whitney test). B, Example traces recorded from PV+ neurons with 350 pA and −50 pA current injections. Calibration: 50 mV, 0.2 s. C–E, Quantification of passive membrane properties of PV+ neurons in PV-RARα KO mice (PV-Cre; RARαfl/fl) or their littermate controls (PV-Cre; RARαfl/+) under NR or BE conditions. Resting membrane potentials (C), membrane capacitance (D), and input resistance (E) were analyzed. F, G, Quantification of active membrane properties (action potential threshold, F; and rheobase, G) of PV+ neurons in PV-RARα KO mice (PV-Cre; RARαfl/fl) or their littermate controls (PV-Cre; RARαfl/+) under NR or BE conditions. H, Representative traces of firing activity in response to a 200 pA step current injection recorded from PV+ neurons in V1m L2/3. Calibration: 50 mV, 0.2 s. I, Input–output relations between total number of action potentials and step current injections between 50 and 350 pA. *p < 0.05 (two-way repeated-measures ANOVA).
- Figure 6.
Visual deprivation reduces mIPSC frequencies in an RARα-dependent manner in PV+ neurons. A, Representative traces of mEPSCs recorded from L2/3 PV+ neurons in PV-Cre; RARαfl/+ and PV-Cre; RARαfl/fl mice with either NR or BE. Calibration: 20 pA, 0.5 s. B, Quantification of mEPSC frequencies and amplitudes recorded from PV+ neurons in mice with PV-Cre; RARαfl/fl or its littermate control PV-Cre; RARαfl/+. C, Representative traces of mIPSCs recorded from L2/3 PV+ neurons. Calibration: 50 pA, 0.5 s. D, Average mIPSC frequencies and amplitudes recorded from PV+ neurons in NR or BE groups. **p < 0.001 (two-way ANOVA).
- Figure 7.
Constitutive Fmr1 KO blocks BE-induced changes in synaptic inhibition in L2/3 PNs. A, Representative traces recorded from V1m L2/3 PNs of constitutive Fmr1 KOs and WT littermates under NR or BE conditions. Calibration: 50 pA, 0.5 s. B, Quantification of mIPSC frequencies and amplitudes in PNs from WT and constitutive Fmr1 KO mice. **p < 0.01 (two-way ANOVA). ***p < 0.001 (two-way ANOVA).
- Figure 8.
Selective deletion of FMRP in PV+ neurons prevents modulation of synaptic inhibition induced by BE or RA treatment. A, Schematic diagram showing the strategy for generating the Fmr1 conditional KO mice. B, Representative traces from L2/3 PNs of PV-Fmr1 cKO mice (PV-Cre, Fmr1 cKO) and WT littermate controls under NR or BE conditions. Calibration: 50 pA, 0.5 s. C, Quantification of mIPSC frequencies and amplitudes from L2/3 PNs of WT and PV-Fmr1 cKO mice. ***p < 0.001 (two-way ANOVA). D, Example traces from L2/3 PNs of PV-Fmr1 cKO mice and WT littermate controls after RA or vehicle treatment. Calibration: 50 pA, 0.5 s. E, Quantification of mIPSC frequencies and amplitudes from L2/3 PNs of WT and PV-Fmr1 cKO mice after treatment with RA or vehicle control. ***p < 0.001 (two-way ANOVA).


