

Article Figures & Data
Figures
- Figure 1.
Illustration of the Pinna–Brelstaff illusion, stimulus parameters, and the 3AFC/2AFC psychophysical paradigm. A, Classical Pinna–Brelstaff rotary illusion. B, Real radial (left) and rotary (right) motion of Pinna–Brelstaff figure produce illusory rotary and radial motions, respectively. C, Illustration of Pinna–Brelstaff figures used in this study, whose local Gabor orientation varied between +45°, 0°, and −45°. D, Schematic illustration of psychophysical 3AFC detection tasks used for human subjects (top) and 2AFC discrimination tasks used for both human subjects and macaque monkeys (bottom).
- Figure 2.
Illusory flow motion percepts during different physical manipulations of Pinna–Brelstaff figures. A, The results of the 3AFC detection tasks to Pinna Illusory complex-flow motions in human subjects. Each row represents a physical manipulation of Pinna–Brelstaff figures, and each column represents a stimulus condition (+45°, 0°, −45°). The x-axis delineates the three motion choices. The illusory motion patterns are illustrated by orange icons on the x-axis, and No illusion was marked as “No.” The y-axis shows the proportion (percentage) for each perceptual choice. During real radial motion condition, the three options were CCW illusory rotation, No illusion, and CW illusory rotation. For the real rotary motion condition, the three options were contraction illusion, no illusion, and expansion illusion. B, Summary of the perceived illusory complex-flow motions under different kinds of physical motion manipulations for each stimulus condition (+45°, 0°, −45°).
- Figure 3.
The results of 2AFC psychophysical experiments on human subjects and macaque monkeys. A, B, Examples of psychometric functions obtained from human subject LF when tested for illusory rotary and radial motion with the real expansion and CW rotation tasks. Green, black, and magenta represent −45°, 0°, and +45° tilted Gabors. Positive and negative values on the x-axis represent the speed of different types of flow motion patterns as indicated underneath, while the circles show the response frequency as a function of physical speed, and the circle sizes represent the repeat times of that speed condition through using the staircase method (see Materials and Methods). C, Box plots show the distributions of individual Δ PSE values from all nine subjects. Real expansion condition on the left and real CW rotation condition on the right. D, E, Examples of psychometric functions from human subject LF, testing perception of illusory rotation using real contraction, and illusory radial motion using real CCW rotation. Same conventions as in A and B. F, Box plots show the distribution of individual Δ PSE values across all nine subjects. Real contraction condition on the left and real CCW rotation condition on the right. G, H, Examples of psychometric functions from a single day of testing in monkey WJ using the same physical manipulations of the same Pinna–Brelstaff figures as those in A and B. I, Box plots show the distributions of Δ PSE values over 7 d from two monkeys, WJ and DX. J, K, Examples of psychometric functions for monkey WJ obtained from a single day with the same physical manipulation of the same Pinna–Brelstaff figures as those in A and B. L, Box plots show the distribution of Δ PSE values over 7 d from two monkeys. Asterisks denote statistical significance at **p < 0.01; ***p < 0.001.
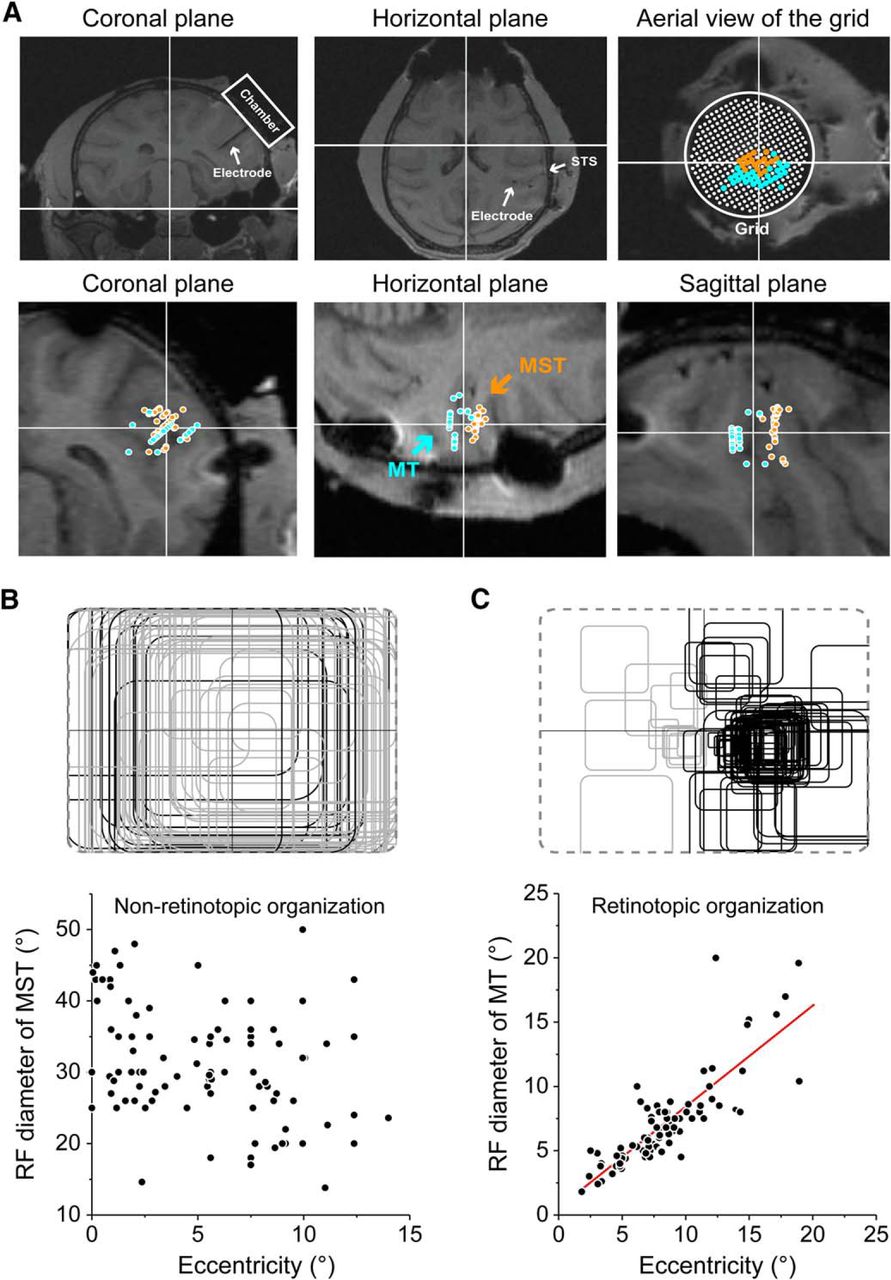
- Figure 4.
The MRI scanning results and receptive field properties of MT and MSTd. A, Top row, MRI scanning results of one macaque monkey. The locations of chamber and electrode are shown in coronal and horizontal planes, and the penetrating guided grid is shown in the aerial view. Bottom row, Illustration of recording sites in the same hemisphere of the same monkey. Blue and orange dots, Electrode tip positions in MT and MSTd areas, respectively. B, Top, screen-scaled receptive field sizes and locations of MSTd neurons (gray rounded rectangles, RFs of neurons in the right hemisphere; black rounded rectangles, RFs of neurons in the left hemisphere). MST neurons have big receptive fields, which spread both ipsilaterally and contralaterally. Bottom, The relationship between retinal eccentricities and RF diameters. Diameters were plotted as a function of eccentricity. The RFs of MSTd neurons are nonretinotopically organized. C, Same conventions as in B, MT neurons have relatively smaller receptive fields, which are contralaterally distributed, and their RFs are retinotopically organized.
- Figure 5.
Results of single-unit recordings from area MSTd in response to physical manipulation of the Pinna–Brelstaff figures. A, Top row, The PSTHs and raster plots show the responses of a real CCW rotation-sensitive MSTd neuron to real rotary motion patterns tested with the 0° control condition. Horizontal black dashed lines, Spontaneous responses. The lower three rows: The PSTHs and raster plots show the same MSTd unit responding to real expansion (left) and contraction (right) of the Pinna–Brelstaff figures. Orange icons show the illusory motion predicted from the psychophysics (Fig. 2B), which corresponds to the facilitative responses of the neuron. B, A real contraction-sensitive MSTd neuron responding to the 0° control condition with radial motion patterns as well as real CW (left) and CCW (right) rotations of the Pinna–Brelstaff figures. Same conventions as in A. C, D, Log axis scatter plots of the distributions of facilitative (cases, N = 264) and suppressive (cases, N = 264) responses of MSTd neurons across all Pinna–Brelstaff stimuli. E, Log axis scatter plot showing the relationship between the strength of facilitative response (Δ facilitative response) and the strength of suppressive response (Δ suppressive response, positive values show more suppression). White circles represent cases without both significant facilitation and suppression; gray circles represent cases with either significant facilitation or suppression; black circles represent cases with both significant facilitation and suppression.
- Figure 6.
MSTd polar-plot tuning for complex-flow motion patterns. A, Canonical complex-flow motion patterns represented in polar coordinates, and the MSTd neuron population distribution of the preferred complex-flow motion pattern plotted against the normalized vector-summed firing. B, An MSTd neuron sensitive to CCW rotation. Left, Qualitatively predicted response tuning curves to physical manipulation of the Pinna–Brelstaff figures (green, −45°; gray, 0°; magenta, +45°). Middle, Neural responses to the Pinna–Brelstaff figures (error bars show the mean firing rate ± SEM), arrows represent the vector sums calculated from the tuning curve, and they agree with the predictions. Right, Response to moving random dot field (error bars show the mean firing rate ± SEM). C, A real expansion-sensitive MSTd neuron in response to the physical manipulation of the Pinna–Brelstaff figures. Same conventions as in B. D, An MSTd neuron sensitive to real spiral 2 motion in response to the physical manipulation of the Pinna–Brelstaff figures. Same conventions as in B.
- Figure 7.
Population summary of changes in the polar tuning functions during presentation of Pinna–Brelstaff figures. A, Distribution of Δ preferred angle for rotary motion sensitive MSTd units, arrow shows the population mean (black bars, cases that were significantly different with a permutation test at p < 0.01; white bars, remaining cases). B, Distribution of Δ preferred angle for radial motion-sensitive MSTd units; conventions as in A. C, Distribution of Δ amplitude for spiral motion-sensitive MSTd units; conventions as in A.
- Figure 8.
Results of single-unit recordings of MT in response to the physical manipulation of Pinna–Brelstaff figures. A, B, Log axis scatter plots of distributions of facilitative and suppressive responses across all Pinna–Brelstaff stimuli; cases were determined following the method used for MSTd neurons. C, Population results defining the percentage of a subgroup of MT units with preferred angles distributed around cardinal polar axis (black bars, cases that were significantly different with a permutation test at p < 0.01; white bars, remaining cases). The arrow shows a population mean of Δ preferred angle for both ±45° stimulus cases of 11.14 ± 2.24° (mean ± SEM; Z = 5.98, p = 2.18 × 10⁻⁹; cases, N = 128, Wilcoxon signed-rank test) with 41.41% of cases (53 of 128 cases); permutation test, p < 0.01) showing significant response changes. Cases were determined following the method used for MSTd neurons. D, Population results of Δ amplitude for another group of MT units with preferred angles distributed between cardinal polar axis; conventions are as in C. Mean amplitude change: 4.03 ± 1.31 spikes/s (mean ± SEM; Z = 2.96; p = 0.003; cases, N = 112, Wilcoxon signed-rank test) with 28.57% of cases (32 of 112 cases; permutation test, p < 0.01) showing significant response changes.
- Figure 9.
The results of masking experiments on MT neurons. A, Unmasked full-field and locally masked Pinna–Brelstaff stimuli used. The red dashed circle in the right panel marks the location and size of the receptive field of an MT neuron. B, Polar plot of the neural responses to unmasked and masked Pinna–Brelstaff stimuli (error bars show the mean ± SEM), showing almost identical response tuning curves for the two conditions. The icons of black arrows around the polar axis present the local linear motion vectors inside the receptive field. C, Left, Scatter plot of Δ preferred angles across MT neurons specifically tested for unmasked and masked conditions. Box plot alongside the scatter plot showing the statistical distribution of Δ preferred angles between unmasked and masked conditions; there were no statistical differences for both Δ parameters between the two conditions. Right, Scatter plot and box plot of Δ amplitudes, using the same conventions as those for Δ preferred angles. D, Up, The response tuning curve of the exemplar neuron to random dot complex-flow motion, giving the strongest response to left–upward local linear motion; under this direction, the global complex-flow motion pattern is contraction. Down, The response tuning curve of the same neuron to translational random dot motion, exhibiting a left–upward (∼150°) preference. E, Illustrated derivation of biased motion direction.
- Figure 10.
Comparison of both illusory and real motion sensitivity between MSTd and MT. A, Population distributions of Δ firing rate for illusory motion. B, Population distributions of Δ firing rate for real motion. C, The population distributions of AUC for both illusory (orange) and real (black) motion. Asterisks denote statistical significance: ***p < 0.001.
- Figure 11.
Temporal ROC analysis of AUC for both MSTd and MT responses. A, Temporal ROC analysis of MT neurons to real motion. Averaged black curve (± SEM) shows the change of AUC value throughout the first 200 ms after stimulus onset. The first time point where the AUC value is significantly higher than the 0.5 threshold (p < 0.01, after Bonferroni correction) is marked by a dashed line and a black arrow on the x-axis. B, Temporal ROC analysis of MSTd neurons to real motion. Same conventions as in A. C, Temporal ROC analysis of MT neurons to illusory motion. Same conventions as in A. D, Temporal ROC analysis of MSTd neurons and illusory motion. Same conventions as in A. E, Population distributions of latencies from MT and MSTd representing both illusory (orange) and real (black) motions. F, Population distributions of latencies from MSTd representing both illusory (orange) and real (black) rotary/radial motion. Asterisks denote statistical significance: **p < 0.01, ***p < 0.001.
- Figure 12.
Temporal peak firing rate analysis of MSTd and MT neural responses to both real and illusory complex-flow motions. A, Average PSTH responses (boxcar smoothed, ±SEM) of MSTd subgroups representing illusory and real radial motion. Black arrows on the x-axis mark the time at which the response begins and peaks. Left, Result from ±45° Pinna–Brelstaff figures (illusory motion). Right, Result from 0° control Pinna–Brelstaff figure (real motion). B, Average temporal responses of MT neurons to the same stimuli used for MSTd. Same convention as in A. C, Population data for the response onset latencies of individual MT and MSTd neurons to illusory (orange boxes) or real (black boxes) motion (real MSTd: 60.79 ± 3.35 ms, mean ± SEM; cases, N = 117; real MT: 54.07 ± 2.95 ms, mean ± SEM; cases, N = 85; Z = 2.85; p = 0.0044, Wilcoxon rank sum test). D, Population data for the peak latency (real MSTd: 85.32 ± 4.03 ms, mean ± SEM; cases, N = 117; real MT: 72.32 ± 3.06 ms, mean ± SEM; cases, N = 85; Z = 2.7; p = 0.0069, Wilcoxon rank sum test); same conventions as in C. Asterisks denote statistical significance: **p < 0.01, ***p < 0.001.
- Figure 13.
Schematic summary of motion integration from local to global illusory complex-flow motion. Diagram illustrates how an example MSTd CCW rotation-sensitive neuron with a large RF (top) integrates MT local motion inputs (middle) to represent global illusory CCW rotary motion from a physically expanding +45° Pinna–Brelstaff stimulus (bottom). The AUC temporal dynamics of MSTd and MT populations plotted within the MSTd RF (top circle) show the integration time window for illusory motion. The black circles represent MT and MSTd neuron RFs. Small inset on the right of the middle panel illustrates the orthogonal motion signal of MT neurons due to the aperture effect (middle, short orange arrows); such biased illusory motion signals from a group of circularly arranged MT neurons are assumed to be integrated (shown by orange arrows between middle and top panels) by the MSTd neuron, resulting in global illusory CCW rotation (top, long orange arrows and circle).


