

Article Figures & Data
Figures
- Figure 1.
Perturbing RAB-5 activity increases EFF-1-dependent axonal fusion. a, Successful PLM axonal fusion in a WT animal (Pmec-4::GFP) 48 h after axotomy. The filled arrowhead indicates the cut site; the open arrowhead indicates the site of fusion. Another neuron (PVM, gray in schematic) is visible in the midbody of the animal. b, Defective PLM axonal fusion in a psr-1(ok714) animal 48 h after axotomy. The filled arrowhead indicates the cut site; the open arrowhead indicates the site of reconnection (which did not result in fusion). c, Rescue of PLM axonal fusion in a psr-1(ok714) animal by expression of RAB-5(DN) 48 h after axotomy. The filled arrowhead indicates the cut site; the open arrowhead indicates the site of fusion. PVM (gray in schematic) can be seen but is out of focus. d, Quantification of axonal fusion in psr-1(ok714) animals expressing RAB-5(DN) in the PLM neuron, demonstrating rescue of the psr-1(ok714) axonal fusion defect. This rescue is suppressed in psr-1(ok714); eff-1(ok1021) mutant animals, indicating that the effect of RAB-5(DN) is eff-1 dependent. e, Quantification of axonal fusion in animals expressing RAB-5(CA) in the PLM neuron shows no significant effect on the level of axonal fusion compared with controls. Note that the same WT dataset is used for both d and e. Error bars indicate the SE of proportions; n values are listed below each bar; exact p-values from Fischer's exact test. D, Dorsal; V, ventral; A, anterior; P, posterior for all images. Scale bars, 25 μm. f, Schematic illustrating how PSR-1 and RAB-5 act genetically upstream of EFF-1 in axonal fusion, with PSR-1 promoting fusion and RAB-5 suppressing EFF-1 availability on the membrane. Loss of function in psr-1 thus leads to reduced fusion efficiency, whereas concurrent perturbation of RAB-5 is able to restore fusion to normal levels.
- Figure 2.
RAB-5 controls EFF-1 localization to the plasma membrane. a, Schematic of the PLM neuron in the tail of the animal; dashed box indicates the region depicted in b. b, Representative maximum projection confocal images of the PLM neuron in eff-1(ok1021) animals expressing EFF-1::GFP and cytoplasmic mCherry in PLM. A control animal (top) is compared with an animal expressing RAB-5(DN) (middle) and an animal at 6 h after axotomy (bottom). Dashed boxes indicate the regions magnified in c. Scale bars, 5 μm. c, Magnification of the PLM cell bodies in b. In the animal expressing RAB-5(DN) (middle), EFF-1::GFP localizes to a membranous protrusion (arrowhead). Dashed line arrows indicate the position of a line scan drawn through each cell body, with the fluorescence profile from each line depicted in d. Contrast settings have been adjusted to better visualize EFF-1 in the cell body rather than the axon. Scale bars, 1 μm. d, Fluorescence profiles from line scans (dashed line arrows) of the overlying cell bodies [control animal on left; RAB-5(DN) animal in middle, animal 6 h after axotomy on right]. The presence of an EFF-1::GFP fluorescence peak outside of the margin of the cytoplasmic mCherry signal confirms membranous EFF-1::GFP localization in the presence of RAB-5(DN), but not in the control animals or animals after axotomy. Results are demonstrative of ≥ 10 animals per group. AU, Arbitrary units. e, Quantification of the relative amount of EFF-1::GFP at the membrane of the cell body in eff-1(ok1021) animals coexpressing EFF-1::GFP in three different RAB-5 backgrounds, and wild-type axotomized animals. Top row: RAB-5(DN), second row: RAB-5(WT) (low (5 ng/μl) and high (10 ng/μl) injection concentrations are shown), third row: RAB-5(CA), and bottom row: animals at 3 and 6 h after axotomy. For each independent transgenic isolate, animals carrying a particular RAB-5 transgene (red) are compared with siblings lacking the transgene (black). Animals after axotomy at 3 and 6 h (red) are compared with uncut axons from animals of the same strain (black). Each data point represents one animal; n ≥ 15. Bars represent the mean of each group with the SD; exact p-values from t test.
- Figure 3.
EFF-1 forms extracellular vesicles with perturbed RAB-5 activity. a, Representative image of an eff-1 mutant expressing EFF-1::GFP and cytoplasmic mCherry in PLM (no vesicles) compared with three independent transgenic isolates coexpressing RAB-5(DN), in which vesicles are observed around the PLM cell body. Scale bar, 5 μm. b, Single plane confocal image of the PLM cell body in an eff-1 mutant expressing EFF-1::GFP, RAB-5(DN), and cytoplasmic and membrane-bound mCherry (MYR::mCherry) in PLM. There is no mCherry signal present in the vesicles. Image is demonstrative of 18 animals. Scale bar, 2 μm. c, Time-lapse images demonstrating dynamic membrane protrusions of EFF-1::GFP in an animal expressing RAB-5(DN). One protrusion is marked with a filled arrowhead, the other with an open arrowhead. Scale bar, 1 μm. d, Time-lapse images demonstrating the budding of a vesicle (arrowhead) over a period of 1 min. Another faint, immobile vesicle can also be seen (asterisk). Scale bar, 1 μm. e, Proportion of mobile versus immobile vesicles, based on 42 vesicles in 24 animals.
- Figure 4.
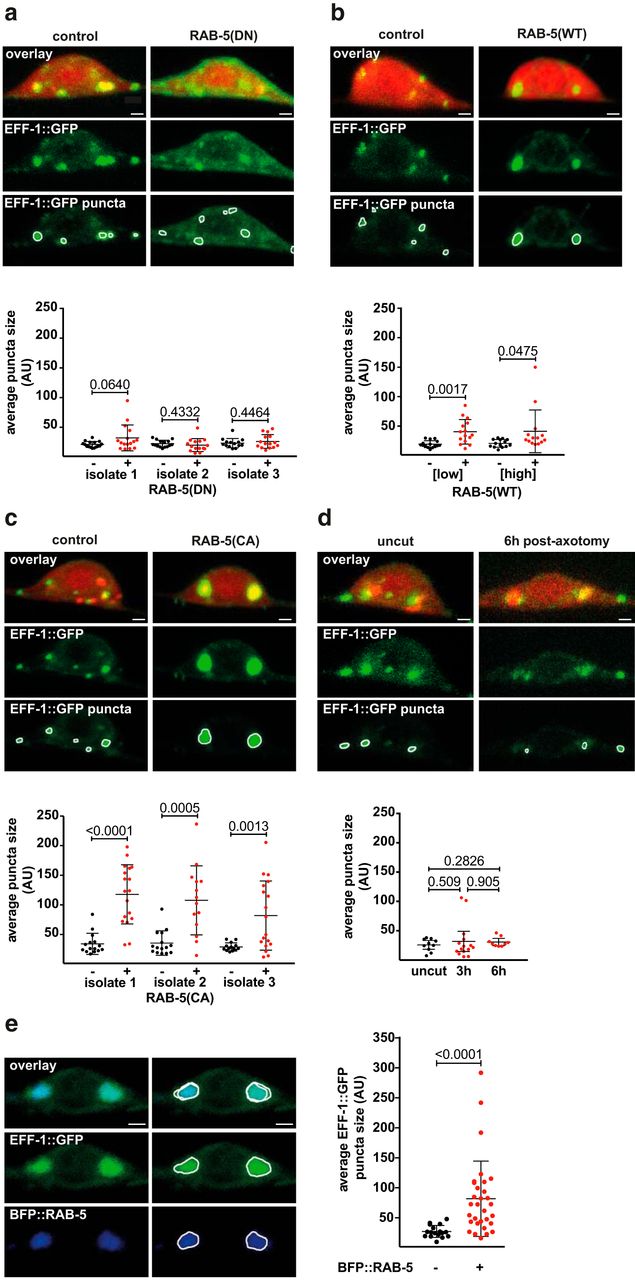
Increased RAB-5 activity causes EFF-1 accumulation in large intracellular puncta, which are RAB-5-positive compartments. a–c, Representative maximum projection confocal images of the PLM cell body in eff-1(ok1021) animals expressing RAB-5(DN) (a), RAB-5(WT) (b), or RAB-5(CA) (c) compared with control animals lacking each respective RAB-5 transgene. Displayed for each cell body are the overlay of the red (diffusible mCherry) and green (GFP-tagged EFF-1) channels (top row), the green channel (middle row), and the result of automatic puncta selection using Squassh (bottom row). Scale bars, 1 μm. Below the confocal images are graphs showing quantification of the average EFF-1::GFP puncta size in independent transgenic isolates expressing each version of RAB-5: RAB-5(DN) (a) RAB-5(WT) (b), or RAB-5(CA) (c). Animals with a given RAB-5 transgene (red) were compared with siblings lacking the transgene (black). A significant increase in average puncta size was found for three independent RAB-5(CA) isolates and for two RAB-5(WT) isolates injected at different concentrations (5 ng/μl and 10 ng/μl). Each data point represents one cell body from one animal; n ≥ 14. Bars represent the mean of each group with the SD; exact p-values from t test. AU, Arbitrary units. d, Representative maximum projection confocal images of the PLM cell body in an eff-1(ok1021) animal at 6 h after axotomy compared with an uncut control animal. As for a–c, displayed for each cell body are the overlay of the red (diffusible mCherry) and green (GFP-tagged EFF-1) channels (top row), the green channel (middle row), and the result of automatic puncta selection using Squassh (bottom row). Scale bars, 1 μm. Below the confocal images are graphs showing quantification of the average EFF-1::GFP puncta size. Animals at 3 and 6 h after axotomy (red) are compared with uncut animals (black). No significant difference was noted. Each data point represents one cell body from one animal. Bars represent the mean of each group with the SD. e, Representative maximum projection confocal image of the PLM cell body in an animal coexpressing EFF-1::GFP and BFP::RAB-5; the overlay and individual green and blue channels (left column) are matched with the result of automatic puncta selection using Squassh (right column), demonstrating strong colocalization between the EFF-1::GFP and BFP::RAB-5 puncta. Scale bar, 1 μm. Next to these confocal images is a graph showing quantification of the average EFF-1::GFP puncta size in a transgenic strain carrying EFF-1::GFP and BFP::RAB-5. A significant increase in EFF-1::GFP puncta size occurred when BFP::RAB-5 was also present (+). The BFP::RAB-5 transgene was injected at the same concentration as the other RAB-5 transgenes. Each data point represents one cell body from one animal; n ≥ 17. Bars represent the mean of each group with the SD; exact p-values from t test. AU, Arbitrary units.
- Figure 5.
Altered RAB-5 activity increases the EFF-1::GFP intensity in PLM. Quantification of the relative mean EFF-1::GFP intensity in the axon (left column) and cell body (right column) of eff-1(ok1021) animals coexpressing EFF-1::GFP with different RAB-5 transgenes or animals after axotomy. Each mean GFP measurement is expressed relative to the mean mCherry intensity in the same region (see Materials and Methods). This intensity was significantly increased with expression of RAB-5(DN) (a, b), RAB-5(CA) (c, d), or rab-5(sas) (g, h) and in the axon at 3 h after axotomy (i). No significant difference was found with expression of RAB-5(WT) (e, f), nor in the cell body after axotomy (j). Each point represents the mean for a single axon or cell body; n ≥ 8. Bars represent the mean of each group with the SD; exact p-values from t test. AU, Arbitrary units.
- Figure 6.
The endocytic molecules DYN-1 and EHS-1 have no effect on EFF-1 localization in PLM. Analyses of EFF-1::GFP localization in the presence of the temperature-sensitive allele dyn-1(ky51) (a, c, e) or the loss-of-function allele ehs-1(ok146) (b, d, f). No significant difference was found in EFF-1::GFP intensity (top row), the average EFF-1::GFP puncta size (middle row), or the amount of EFF-1 at the membrane (bottom row). To test dyn-1(ky51), animals maintained at the permissive temperature (15°C) were compared with those shifted to the restrictive temperature (25°C) for 30 min or 2 h. Each point represents the mean for a single cell body; n ≥ 7. Bars represent the mean with the SD; exact p-values from t test. AU, Arbitrary units.
- Figure 7.
Other RAB molecules have no effect on EFF-1 localization in PLM. Analyses of EFF-1::GFP localization in independent transgenic isolates coexpressing RAB-7(DN) (a, d, g), rab-10(dx2) (b, e, h), or RAB-11(DN) (c, f, i). For each isolate tested, no significant difference was found in the relative mean EFF-1::GFP intensity (top row), average EFF-1::GFP puncta size (middle row), or amount of EFF-1 at the membrane (bottom row). Animals with the altered rab gene of interest (red) are compared with siblings WT for that rab gene (black). Each point represents the mean for a single cell body; n ≥ 8; bars represent the mean of each group with the SD; exact p-values from t test. AU, Arbitrary units.
- Figure 8.
Model of RAB-5 regulation of EFF-1 in PLM. In the WT scenario, EFF-1 (green) is transiently inserted into the membrane following synthesis. Active RAB-5 (purple) functions in the removal of EFF-1 into early endosomes. This in turn is required for EFF-1 trafficking into downstream compartments for recycling/degradation. When RAB-5 function is perturbed, EFF-1 is no longer removed from the membrane and subsequent accumulation at the membrane results in membranous protrusions and budding of extracellular vesicles. There is an additional failure of trafficking into recycling/degradation pathways. With increased RAB-5 activity, EFF-1 instead accumulates in enlarged early endosomes. This endosomal enlargement also leads to a defect in downstream trafficking of EFF-1 for recycling/degradation.


Movies
- Movie 1.
Budding and dynamics of EFF-1 extracellular vesicles. Movie shows the dynamics of EFF-1::GFP vesicles over 3.5 min in an animal expressing RAB-5(DN). The white bar highlights the position of a group of three vesicles seen to move relative to each other. Also of interest is the budding of a new protrusion from the cell body (asterisk), which may represent a vesicle that is about to separate from the cell.
- Movie 2.
Dynamics of EFF-1 extracellular vesicles and protrusions. Movie shows the dynamics of EFF-1::GFP vesicles and protrusions over 3.5 min in an animal expressing RAB-5(DN). Two dynamic protrusions are noted anterior to the cell body (open arrowheads). Posterior to the cell body, a new vesicle appears at 1 min (asterisk) and moves relative to two other vesicles.


