

Article Figures & Data
Figures
- Figure 1.
Characterization of PLP-ChR2 mice. A, Induction of oligodendrocyte-specific ChR2(C128S)-EYFP expression in the tet system (left). tTA, Tetracycline-controlled transcriptional activator; tetO, Tetracycline-controlled transcriptional activator-dependent promoter. Fluorescent image of the hippocampus labeled with GFP antibody (right). Scale bar, 500 μm. B, Double immunohistochemistry showing that PLP-positive myelin fibers were labeled with GFP (60.1 ± 2.2%; 4 sections, 2 animals). None of the GFAP-, Iba1-, or NeuN-positive signals were colabeled with the anti-GFP antibody. Purple, Marker; green, GFP; Alv, alveus; Ori, stratum oriens; Pyr, CA1 pyramidal cell layer in the hippocampus. Scale bar, 10 μm. C, Transmission electron micrographs from control mice (PLP-tTA mice, left) and PLP-ChR2 mice (right) at 4 weeks of age, showing normal-appearing myelin structure in the corpus callosum of PLP-ChR2 mice. Scale bar, 1 μm. D, The number of myelinated axons in the corpus callosum of PLP-ChR2 mice (n = 3) and control mice (n = 4). E–G, Histograms (left) and group data (right) of axon diameter (E), myelin thickness (F), and g-ratio (G) of PLP-ChR2 mice (n = 3) and control mice (n = 4). H, Schematic drawing showing the stimulating (S) and recording (R) electrodes for recording CAPs (top, left). Measurement of the amplitude of CAPs (top, right). Calibration: 5 ms, 0.5 mV. Input–output relationship of CAP amplitude in wild-type and PLP-ChR2 mice (bottom).
- Figure 2.
Depolarization of oligodendrocytes in the alveus facilitates axonal conduction along the axons toward the subiculum. A, Relationship between the duration of illumination for oligodendrocyte depolarization and the change in CAP amplitude of the axons toward the subiculum. Changes in CAP amplitude induced by blue light photostimulation for 5 ms (n = 6), 10 ms (n = 8), 25 ms (n = 7), 50 ms (n = 8), or 500 ms (n = 9), starting at 0 min, expressed as a percentage of mean CAP amplitude during the 8 min period before light pulse delivery. The blue bars indicate the timing of blue light illumination. The black bars indicate the measurement periods in (B). Inset, Schematic drawing showing the stimulating (S) and recording (R) electrodes for recording CAPs. B, Summary histograms for the change in CAP amplitude at 1–3 min (left) or 28–30 min (right) after photostimulation for the indicated time, expressed as a percentage of the mean CAP amplitude during the 8 min period before light pulse delivery. Stim, Stimulation. *p < 0.05. C, Left, Changes in CAP width over time with no photostimulation (n = 6) or after 500 ms photostimulation (n = 9). Inset is a measurement of CAP width. Right, Summarized results for the changes in CAP width. D, Left, Changes in CAP area over time with no photostimulation (n = 6) or after 500 ms photostimulation (n = 9). Inset is a measurement of CAP area. Right, Summarized results for the changes in CAP area. E, Effects of blue light illumination on the amplitude (left) and width (right) of CAP in mice with the same genotype as PLP-ChR2 mice, but expression was blocked by Dox administration.
- Figure 3.
Firing properties of subicular pyramidal cells. A, Schematic drawing showing the recording pipette for whole-cell recording from a subicular pyramidal cell (left). Light microscopy showing a biocytin-stained pyramidal cell at low (middle) and high (right) magnification. Scale bar, 200 μm. B–D, Voltage responses to intracellularly injected current pulses in a regular firing neuron (B), a bursting neuron (C), and a fast-spiking interneuron (D). Calibration: 200 ms, 50 mV. E, Pie chart for the ratio of subicular neurons showing each firing pattern.
- Figure 4.
Effects of oligodendrocyte depolarization on synaptic transmission at destination synapses. A, Topographic projections from the CA1 region to the subiculum. The pyramidal cells in each portion of the CA1 region indicated by the colored triangles project their axons to each region indicated by an oval with the same color in the subiculum. B, Schematic drawing showing the stimulating (S) and recording (R) electrodes for recording EPSCs from subicular neurons (left) and a typical EPSC waveform (right). Calibration: 50 ms, 100 pA. C, D, Time course of the changes in EPSCs induced by oligodendrocyte depolarization in regular firing neurons (C) and bursting neurons (D) in the proximal (green, n = 8 and n = 10), mid (yellow, n = 7 and n = 8), and distal (red, n = 9 and n = 11) regions of the subiculum, expressed as a percentage of the mean EPSC amplitude during the 8 min period before light pulse delivery. The blue bars indicate the timing of blue light illumination (500 ms). The black bars indicate the measurement periods in (E). Insets are typical examples of a biocytin-stained pyramidal cell (left) and its firing pattern (right) in each group. Scale bar, 200 μm. E, Summary histogram for the changes in EPSC amplitude induced by oligodendrocyte depolarization at 1–3 min (left) and 28–30 min (right) after photostimulation. *p < 0.05.
- Figure 5.
Effects of oligodendrocyte depolarization on the conduction latency of CA1 pyramidal cell axons. A, Left, Schematic drawing showing the stimulating (S) and recording (R) electrodes for recording antidromic action potentials. Right, Measurement of the conduction latency of the antidromic action potential. Calibration: 2 ms, 50 mV. B, C, Time course of the latency of action potentials plotted every 15 s after 500 ms of photostimulation, expressed as a percentage of the mean value of the action potential latency recorded during the 3 min period before light pulse delivery in proximally (B) and distally (C) located CA1 pyramidal cells. Insets are schematic drawings showing the position of the pyramidal cell. Left, Typical examples of biocytin-stained pyramidal cells. The axons are traced with dotted lines. Scale bar, 500 μm (top) and 200 μm (bottom).
- Figure 6.
Effects of oligodendrocyte depolarization on the PPR of EPSCs at destination synapses. A, Schematic drawing showing the stimulating (S) and recording (R) electrodes for recording EPSCs from subicular neurons (left) and a typical EPSC waveform (right) with paired-pulse stimulation. B, C, Time course of the changes in the PPR of EPSCs induced by oligodendrocyte depolarization in bursting neurons (B) and regular firing neurons (C), expressed as a percentage of the mean EPSC amplitude during the 6 min period before light pulse delivery. Insets are typical waveforms evoked by paired stimuli obtained at the times (a and b) indicated in the main panel. Calibration: 50 ms, 200 pA. The black bars indicate the measurement periods in (D). D, Summary histogram for the changes in the PPR of EPSCs induced by oligodendrocyte depolarization at 1–3 and 28–30 min after photostimulation. *p < 0.05.
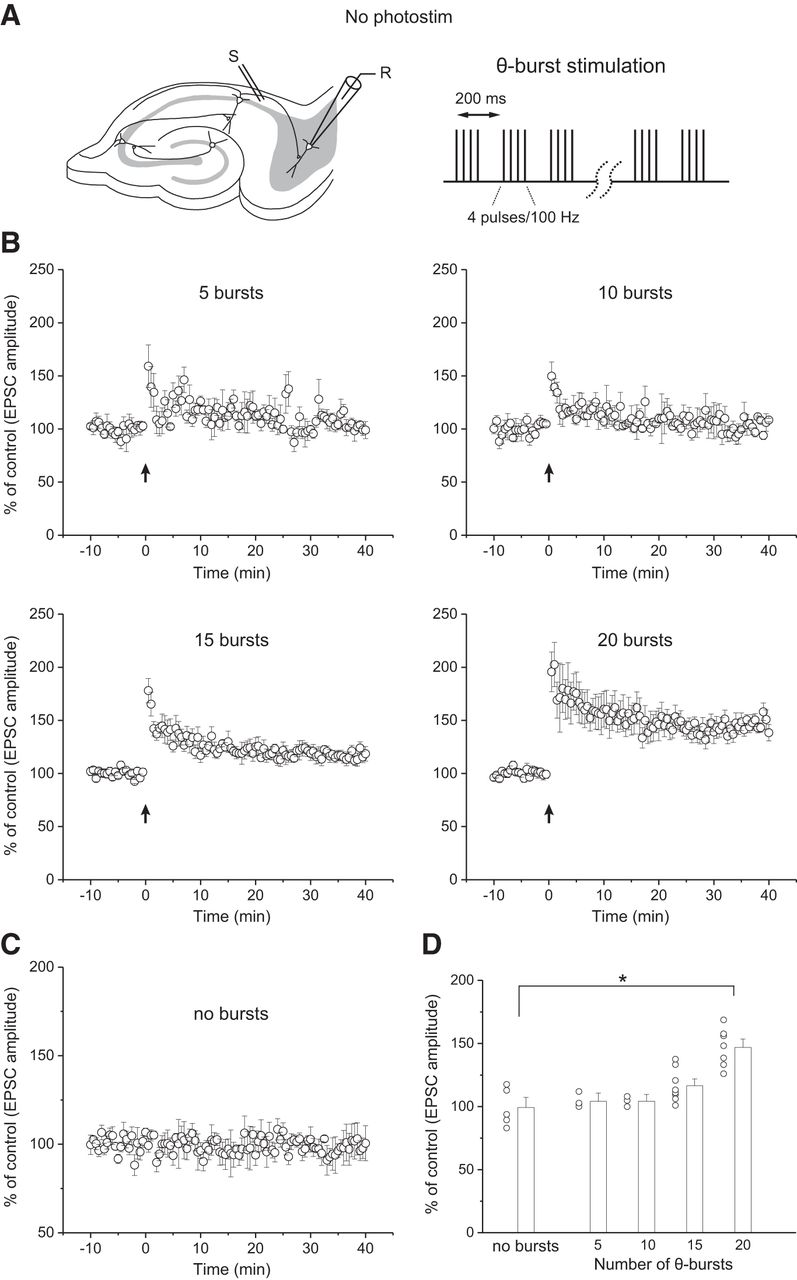
- Figure 7.
Induction of LTP at CA1-subicular bursting neuron synapses. A, Schematic drawing showing the stimulating (S) and recording (R) electrodes for recording EPSCs from subicular bursting neurons (left) and electrical stimulation protocol of theta burst stimulation for the induction of LTP (right). B, Changes in EPSC amplitude induced by theta burst stimulation with different numbers of bursts (5, 10, 15, and 20 bursts), expressed as a percentage of the mean CAP amplitude during the 10 min period before theta burst stimulation in hippocampal slices from mice expressing ChR2 on oligodendrocytes in the absence of photostimulation (5 bursts, n = 4; 10 bursts, n = 3; 15 bursts, n = 8; 20 bursts, n = 7). C, Time course of EPSC amplitude in the absence of light pulse delivery without theta burst stimulation (n = 5) for the data of control EPSCs. D, Summary histograms for the change in EPSC amplitude at 35–40 min after theta burst stimulation expressed as a percentage of the mean EPSC amplitude during the 10 min period before theta burst stimulation delivery. *p < 0.05.
- Figure 8.
Effects of oligodendrocyte depolarization on LTP induction. A, Schematic drawing showing the stimulating (S) and recording (R) electrodes for recording EPSCs from subicular neurons and blue light illumination (blue jagged arrow; left), and the protocol for photostimulation and electrical theta burst stimulation for the induction of LTP (right). B, Changes in EPSC amplitude induced by theta burst stimulation with different numbers of bursts (5, 10, 15, and 20 bursts) in the presence of photostimulation (5 bursts, n = 5; 10 bursts, n = 7; 15 bursts, n = 9; 20 bursts, n = 13). Theta burst stimulation was delivered at 3 min after photostimulation, and EPSC amplitude was expressed as a percentage of the mean EPSC amplitude during the 10 min period before blue light illumination. C, Changes in EPSC amplitude induced by blue light illumination without theta burst stimulation (n = 6) expressed as a percentage of the mean EPSC amplitude during the 10 min period before light pulse delivery. D, Summary histograms for the change in EPSC amplitude at 35–40 min after theta burst stimulation (38–43 min after photostimulation) expressed as a percentage of the mean EPSC amplitude during the 10 min period before photostimulation. *p < 0.05.
- Figure 9.
Characterization of PLP-ArchT mice. A, Induction of oligodendrocyte-specific ArchT-EGFP expression in the tet system (left). tTA, tetracycline-controlled transcriptional activator; tetO, tetracycline-controlled transcriptional activator-dependent promoter. Right, Transmission electron micrograph showing severe hypomyelination in the corpus callosum at 4 weeks of age without Dox treatment. Scale bar, 2 μm. B, Left, Induction of oligodendrocyte-specific ArchT-EGFP expression in the absence of Dox. ArchT-EGFP was induced for 2 weeks after the switch from Dox administration to no Dox. Right, Electron micrograph showing the normal appearance of myelin structure in the corpus callosum at 6 weeks of age. Scale bar, 2 μm. C, The number of myelinated axons in the corpus callosum of PLP-ArchT mice (n = 4) and control mice (n = 4). D–F, Histograms (left) and group data (right) of axon diameter (D), myelin thickness (E), and g-ratio (F) of PLP-ArchT mice (n = 4) and control mice (n = 4). G, Double immunohistochemistry showing that PLP-positive myelin fibers were labeled with GFP (37.7 ± 1.8%, 4 sections, 2 animals). None of the GFAP-, Iba1-, or NeuN-positive signals were colabeled with an anti-GFP antibody. Purple, Marker; green, GFP; Alv, alveus; Ori, stratum oriens; Pyr, CA1 pyramidal cell layer in the hippocampus. Scale bar, 10 μm. H, Schematic drawing showing the recording (R) electrode for whole-cell recordings from oligodendrocytes in the alveus (left). Typical responses from a current-clamped oligodendrocyte caused by yellow light photostimulation applied at the time indicated by the yellow bar in PLP-ArchT mice (middle) and in mice with the same genotype as PLP-ArchT mice, but expression was blocked by Dox treatment (right). Calibration: 5 ms, 5 mV. I, Top, Schematic drawing showing the stimulating (S) and R electrodes for recording CAPs. Bottom, Input–output relationships of CAP amplitude in wild-type and PLP-ArchT mice.
- Figure 10.
Effects of oligodendrocyte hyperpolarization on axonal conduction in the alveus and LTP induction at destination synapses. A, Top, Schematic drawing showing the stimulating (S) and recording (R) electrodes for recording CAPs. Bottom left, Changes in CAP amplitude induced by yellow light illumination for 30 s, starting at 0 min (yellow bar), expressed as a percentage of the mean CAP amplitude during the 8 min period before light pulse delivery (n = 12). The white squares and light yellow triangles are the data without photostimulation in PLP-ArchT mice (n = 6) and with photostimulation in control wild-type mice (n = 5), respectively. Bottom right, Summary histograms for the change in CAP amplitude at 1–3 or 28–30 min, the periods are indicated by the black bars, with no stimulation or after photostimulation for the indicated time, expressed as a percentage of the mean CAP amplitude during the 8 min period before yellow light pulse delivery. B, Top, Schematic drawing showing the stimulating (S) and recording (R) electrodes for recording EPSCs from subicular bursting neurons. Bottom left, Changes in EPSC amplitude induced by yellow light illumination for 30 s, starting at 0 min (yellow bar), expressed as a percentage of the mean EPSC amplitude during the 10 min period before light pulse delivery (n = 6). The white circles are the data without photostimulation (n = 5). Bottom right, Summary histograms for the change in EPSC amplitude at 1–3 or 28–30 min, the periods are indicated by the black bars, with no stimulation or after photostimulation for the indicated time, expressed as a percentage of the mean EPSC amplitude during the 10 min period before yellow light pulse delivery. C, Schematic drawing showing the stimulating (S) and recording (R) electrodes for recording EPSCs from subicular neurons and yellow light illumination (yellow jagged arrow; top left), and the protocol for photostimulation and electrical theta burst stimulation for the induction of LTP (top right). Changes in EPSC amplitude induced by theta burst stimulation (15 or 20 bursts) in the absence (15 bursts, n = 7; 20 bursts, n = 6; middle left) and presence (15 bursts, n = 5; 20 bursts, n = 5; middle right) of yellow light illumination expressed as a percentage of the mean EPSC amplitude during the 10 min period before theta burst stimulation. Yellow light illumination was initiated at 5 s before first burst stimulation and terminated at 25 s after the end of the last (15th or 20th) burst, as indicated by the yellow bar. Bottom, Left, Changes in EPSC amplitude induced by theta burst stimulation in the presence (15 bursts, n = 4; 20 bursts, n = 5) of yellow light illumination in PLP-ArchT mice with Dox treatment. Bottom, Right, Summary histograms for the change in EPSC amplitude at 35–40 min after theta burst stimulation with or without photostimulation in PLP-ArchT mice or with photostimulation in PLP-ArchT mice with Dox treatment, expressed as a percentage of the mean EPSC amplitude during the 10 min period before yellow light pulse delivery. *p < 0.05 (two-way ANOVA).
- Figure 11.
A schematic presentation of the possibility of distinct oligodendrocyte-bound axonal bales for connecting to bursting cells (blue) and regular firing cells (green).


Tables
- Table 1.
Summary of the number (ratio) of neurons showing each firing pattern in the subregions of the subiculum
Regular firing Bursting Fast spiking Proximal 19 (45.2%) 20 (47.6%) 3 (7.1%) Mid 13 (33.3%) 24 (61.5%) 2 (5.1%) Distal 14 (32.6%) 25 (58.1%) 4 (9.3%) Total 46 (37.1%) 69 (55.6%) 9 (7.3%) The ratio of neurons exhibiting each firing pattern was not homogenous in each region of the subiculum, but all types of neurons were observed in all regions.


