

Article Figures & Data
- Figure 1.
Generation of ARF4−/− and ARF5−/− mice. A, Maps of the murine ARF4 gene, both the targeted allele and the ARF4 KO allele are shown. B, Maps of the murine ARF5 gene, both the targeted allele and the ARF5 KO allele are shown. Exons are shown as white boxes. The loxP and frt sites are depicted as black and gray arrowheads, respectively. C, D, Immunoblot analysis of E13.5 whole-body (ARF4) and postnatal week 8 cerebellum (ARF5) of WT (+/+), heterozygous (+/−), and homozygous (−/−) mice. Protein lysates were immunoblotted with anti-ARF4, anti-ARF5, and anti-actin antibodies.
- Figure 2.
Treatment of ARF4+/−/ARF5−/− mice with propranolol and gabapentin reduced the amplitude of the pathologic tremors. A, B, Sagittal sections of WT mouse cerebella at postnatal week 8 (P8w) were immunolabeled with an anti-ARF4 (A) or anti-ARF5 (B) antibody (green) and an anti-calbindin (magenta; a PC marker) antibody. Scale bars, 20 μm. C, Rotarod performance of WT (n = 8) and ARF4+/−/ARF5−/− mice (n = 5) at P8w. **p < 0.001, Student's t test. Error bars indicate the SEM in this figure and subsequent figures. D, Head-tremor frequency of mouse during movement within 3 min was counted from video images. WT (white; n = 12), ARF4+/−/ARF5+/− (gray; n = 12), ARF5−/− (gray; n = 12), and ARF4+/−/ARF5−/− mice (black; n = 12) of P7w–P8w were used. p < 0.001, one-way ANOVA; **p < 0.001, post hoc Scheffe's test. E, Indicated drugs were administrated to the ARF4+/−/ARF5−/− mice (n = 12). **p < 0.001 compared with controls by repeated measure ANOVA. F, G, Vibration before (black) and after (F, red; G, brown) administration of propranolol (F) and gabapentin (G). The tail of mouse was fixed with a piano wire and the vibration of piano wire was recorded by a vibration data logger.
- Figure 3.
Abnormal ECoG and EMG activities in ARF4+/−/ARF5−/− mice upon moving periods. A, B, Representative ECoG and EMG traces in WT (A) or ARF4+/−/ARF5−/− (B) mice upon wakefulness. C, D, ECoG power spectrums were quantified in non-moving, resting mice (C) and moving (D) mice upon wakefulness. **p < 0.001, Student's t test (WT vs ARF4+/−/ARF5−/−, n = 6 each, t test). E, F, A representative EMG power spectrum was calculated in moving WT (E) or ARF4+/−/ARF5−/− (F) mouse upon wakefulness.
- Figure 4.
Reduced intrinsic excitability and abnormal spontaneous firing activity of cerebellar PCs in ARF4+/−/ARF5−/− mice. A, Representative traces of AP firing in response to smaller (left; 400 pA injection) and larger (right; 800 pA injection) depolarizing current injections (500 ms) in WT (gray) and ARF4+/−/ARF5−/− (black) PCs. B, The average number of evoked APs plotted against the injected current amplitudes in WT (gray; n = 33) and ARF4+/−/ARF5−/− (black; n = 32) PCs. The data were collected from more than six mice in each condition. A repeated-measures two-way ANOVA indicates a significant interaction (genotype × injected current; F(19,1197) = 3.42; p < 0.0001). Multiple-comparison tests with Holm–Sidak's method show significant differences between WT and ARF4+/−/ARF5−/− at injected current strength indicated by: *1p = 0.0249, *2p = 0.0221, *3p = 0.0176, *4p = 0.0121, *5p = 0.0111. C, D, Respective pooled data of spike-train duration (ms) and interspike intervals (ms) at smaller 400 pA injection and larger 800 pA current injection. Spike-train duration was defined as the time difference between the first and the last AP events at each current injection. The interspike interval was measured as the mean of intervals between adjacent spike events at each current injection. *p < 0.005 between WT and ARF4+/−/ARF5−/− mice at 800 pA injection, Student's t test with multiple test correction. E, Pooled data of AP amplitudes at smaller 400 pA injection (left) and larger 800 pA current injection (right). Insets show the 15th AP waveforms (gray, WT; black, ARF4+/−/ARF5−/−) aligned with the AP threshold time points at which their differentiated waveform (dV/dt) exceeded 20 mV/ms. Horizontal and vertical scale bars in insets correspond to 0.5 ms and 20 mV, respectively. AP amplitude was measured from the threshold potential to the positive peak of each AP. Multiple-comparison tests show significant differences between WT and ARF4+/−/ARF5−/− from the 8th to 15th AP amplitudes (*p < 0.05) at 800 pA larger current injection, but not at 400 pA smaller current injection. F, Percentage of spontaneously active (i.e., spiking) PCs out of all the recorded PCs. Fischer's exact test indicates that the fraction of spontaneously active PCs is significantly smaller in ARF4+/−/ARF5−/− mice compared with WT (*p = 0.0101). G, Representative traces of spontaneously fired APs in WT (left, top, gray) and ARF4+/−/ARF5−/− (left, bottom, black) PCs. Right, Mean spontaneous spike rates in WT (gray) and ARF4+/−/ARF5−/− (black) PCs. *p = 0.0273, Student's t test.
- Figure 5.
Reduced fast transient Na+ currents with no change in activation or inactivation properties in cerebellar ARF4+/−/ARF5−/− PCs. A, Representative traces of fast transient Na+ currents evoked by a depolarizing voltage pulse from −95 mV to +25 mV in WT (gray) and ARF4+/−/ARF5−/− (black) PCs. The recorded currents were abolished by extracellular application of 1 μm TTX, a Na+ channel blocker (red). B, Pooled data of peak amplitudes of the fast transient Na+ currents recorded at +25 mV as described in A. Bar graphs show mean values, and symbols represent individual data points. *p < 0.05, Student's t test. C, Representative traces used in the analysis of voltage dependence of transient Na+ current activation (test pulses ranging from −75 mV to −15 mV in 5 mV increments) recorded from PCs in cerebellar slices. A pre-pulse of −55 mV (subthreshold for proximal Na+ channels) was applied before test pulses to elicit unclamped axonal Na+ spikes and inactivate distal Na+ channels, leaving well controlled proximal Na+ channels available for the upcoming test pulses. D, Normalized conductance–voltage relations for the fast transient Na+ currents in response to the test pulses shown in C in WT (gray) and ARF4+/−/ARF5−/− (black) PCs. The activation (G/Gmax) curves were fit with Boltzmann functions (see Materials and Methods). The voltage dependency of the transient Na+ current activation is similar between WT and ARF4+/−/ARF5−/− PCs. E, Representative traces used in the analysis of voltage-dependent steady-state inactivation of Na+ currents. Conditioning voltage pulses (200 ms, ranging from −115 mV to −25 mV in 10 mV steps) were applied to determine the voltage dependence of steady-state inactivation before a 10 ms test pulse to −25 mV. F, Steady-state inactivation curve for the fast transient Na+ currents. Normalized Na+ currents (INa/INamax) evoked by test pulses were plotted against conditioning voltages. Data were fit with Boltzmann functions (see Materials and Methods).
- Figure 6.
Reduced Nav1.6 localization to the AIS of PCs and reduced resurgent Na+ currents in ARF4+/−/ARF5−/− PCs. A, B, Sagittal sections of postnatal week 8 (P8w) WT (A) and ARF4+/−/ARF5−/− (B) mouse cerebella were immunolabeled with an anti-Nav1.6 antibody (green) and an anti-calbindin (magenta) antibody. White arrows indicate Nav1.6 immunoreactivities in the AIS of PCs. Scale bars, 20 μm. C, The proportion of Nav1.6-positive AISs to ankyrin-G-positive AISs in WT (white; n = 41), ARF4+/−/ARF5+/− (gray; n = 23), ARF5−/− (gray; n = 37), and ARF4+/−/ARF5−/− PCs (black; n = 18) at P8w. p < 0.001, one-way ANOVA; **p < 0.001, post hoc Scheffe's test. D, Representative traces of resurgent Na+ currents evoked by repolarizing test pulses (−65, −45, −25, and −5 mV) following a 5 ms voltage step to +25 mV in WT (gray) and ARF4+/−/ARF5−/− (black) PCs. The resurgent currents in response to the test pulses (as well as the preceding transient currents) were completely blocked by application of 1 μm TTX (red). E, Current–voltage relations for peak resurgent Na+ currents in WT (gray) and ARF4+/−/ARF5−/− (black) PCs. A repeated-measures two-way ANOVA indicates significant genotype effect (F(1,20) = 9.881; p < 0.01) and interaction (genotype × voltage; F(7,140) = 3.789; p < 0.001). Multiple-comparison tests with Holm–Sidak's method show significant differences between WT and ARF4+/−/ARF5−/− at voltage values indicated by: *1p = 0.0167, *2p = 0.0233, *3p = 0.0473, **p = 0.0014, and ***p = 0.0002.
- Figure 7.
No difference in Nav1.6 puncta in soma, dendrites, or axons between WT and ARF4+/−/ARF5−/− PCs. A, B, Sagittal sections of postnatal week 8 (P8w) WT (A) and ARF4+/−/ARF5−/− (B) mouse cerebella were immunolabeled with an anti-Nav1.6 antibody (green) and an anti-calbindin (magenta) antibody. Scale bars, 20 μm. C, D, Densities of Nav1.6-positive puncta in primary and secondary dendrites (C) and soma (D) of WT (white; dendrite, n = 40; soma, n = 48) and ARF4+/−/ARF5−/− PCs (black; dendrite, n = 40; soma, n = 61). E, F, Sagittal sections of P8w WT (E) and ARF4+/−/ARF5−/− (F) cerebellar white matter were immunolabeled with an anti-Nav1.6 antibody (green) and an anti-calbindin (magenta) antibody. Enlarged images from rectangular white regions are shown in insets. Scale bars, 10 μm. G, Densities of Nav1.6-positive puncta in cerebellar white matter of WT (white; n = 34) and ARF4+/−/ARF5−/− PCs (black; n = 21).
- Figure 8.
Nav1.6 localization to the AIS of hippocampal CA1 neurons in ARF4+/−/ARF5−/− mice. A, B, Sagittal sections of postnatal week 8 WT (A) and ARF4+/−/ARF5−/− (B) mouse hippocampal CA1 regions were immunolabeled with an anti-Nav1.6 antibody (green) and an anti-ankyrin-G (magenta) antibody. Enlarged images from smaller rectangular white regions are shown in right lower insets. Scale bars, 10 μm. C, Immunoblot analysis of the P14 WT and Scn8atg/tg mice (Nav1.6-null mice). Protein lysates from the whole brain were immunoblotted with anti-Nav1.6 antibody. Arrowhead indicates the 229 kDa position.
- Figure 9.
No difference in ankyrin-G immunoreactivity between WT and ARF4+/−/ARF5−/− PCs. A, B, Sagittal sections of postnatal week 8 (P8w) WT (A) and ARF4+/−/ARF5−/− (B) mouse cerebella were immunolabeled with an anti-ankyrin-G antibody (green) and an anti-calbindin (magenta) antibody. Scale bars, 20 μm. C, The linear densities of ankyrin-G-positive axon of PCs for WT (white; n = 13), ARF4+/−/ARF5+/− (gray; n = 16), ARF5−/− (gray; n = 12), and ARF4+/−/ARF5−/− mice (black; n = 13) at P8w.
- Figure 10.
Immunoreactivities of pan-Nav1, Nav1.1, Nav1.2, and Kv3.3 in WT and ARF4+/−/ARF5−/− PCs. A, B, Sagittal sections of postnatal week 8 (P8w) WT (A) and ARF4+/−/ARF5−/− (B) mouse cerebella were immunolabeled with an anti-pan-Nav1 antibody (green) and an anti-ankyrin-G (magenta) antibody. C, D, Sagittal sections of P8w WT (C) and ARF4+/−/ARF5−/− (D) mouse cerebella were immunolabeled with an anti-Nav1.1 antibody (green) and an anti-ankyrin-G (magenta) antibody. E, F, Sagittal sections of P8w WT (E) and ARF4+/−/ARF5−/− (F) mouse cerebella were immunolabeled with an anti-Nav1.2 antibody (green) and an anti-ankyrin-G (magenta) antibody. White arrows indicate ankyrin-G immunoreactivities in the AISs of PCs. G, H, Sagittal sections of P8w WT (G) and ARF4+/−/ARF5−/− (H) mouse cerebella were immunolabeled with an anti-Kv3.3 antibody. Scale bars, 10 mm. I, Representative traces of outside-out patch recordings in WT (gray) and ARF4+/−/ARF5−/− (black) PCs. The outward currents evoked by 500 ms depolarizing voltage pulses were abolished by application of the voltage-dependent K+ current blockers TEA-Cl (10 mm) and 4-aminopyridine (2 mm). J, Current–voltage relations of voltage-dependent K+ currents with protocols shown in I. The K+ currents were similar between WT (gray) and ARF4+/−/ARF5−/− (black) PCs [Repeated-measures two-way ANOVA, genotype effect (F(1,26) = 0.012; P = 0.915), interaction (genotype × voltage; F(10,260) = 0.039; p > 0.999)].
- Figure 11.
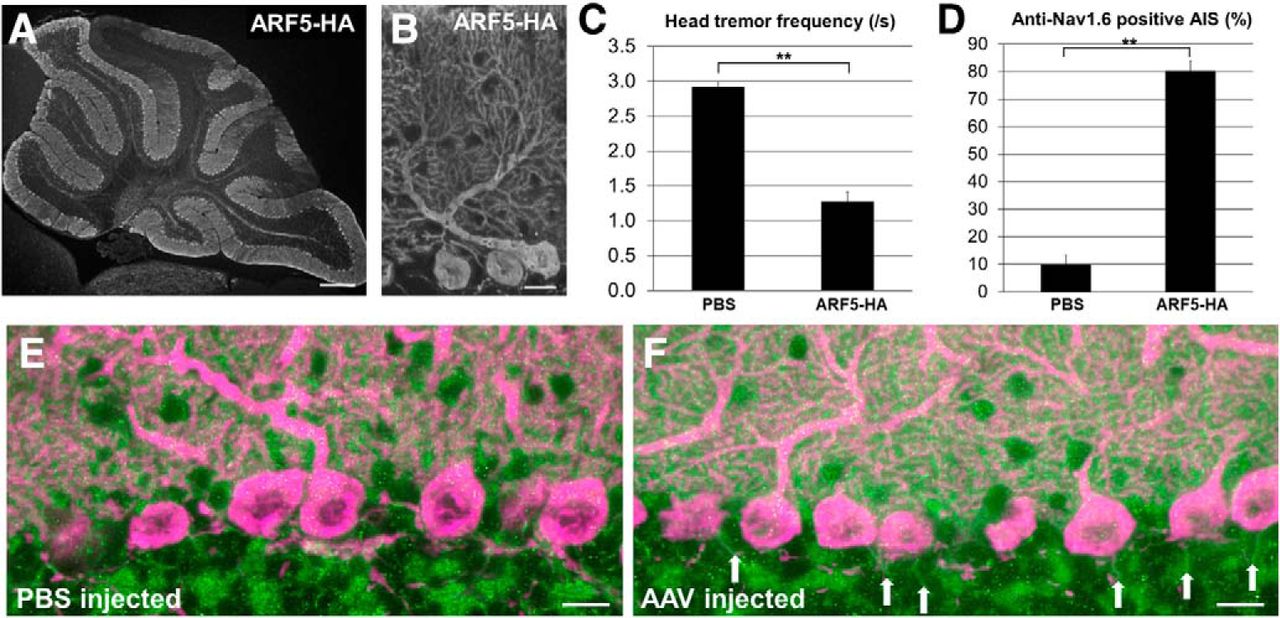
Rescue of ARF4+/−/ARF5−/− phenotypes by exogenous ARF5 expression in the cerebellar PCs. A, B, Sagittal section of a postnatal week 8 (P8w) mouse cerebellum injected with AAV9 vectors expressing ARF5-HA at P14 and immunolabeled with an anti-HA antibody. Scale bars: A, 300 μm; B, 20 μm. C, Head-tremor frequency of P8w mouse during 3 min of movement was counted from video recordings. ARF4+/−/ARF5−/− mice were injected PBS (n = 12) or AAV9 vectors expressing ARF5-HA (n = 12) at P14. **p < 0.001, Student's t test. D, The proportion of Nav1.6-positive AISs to ankyrin-G-positive AISs in ARF4+/−/ARF5−/− mice injected with PBS (n = 24) and AAV9 vectors expressing ARF5-HA (n = 33) at P8w. **p < 0.001, Student's t test. E, F, Sagittal sections of P8w ARF4+/−/ARF5−/− mouse cerebella injected with PBS (E) or AAV9 vectors expressing ARF5-HA (F) immunolabeled with anti-Nav1.6 (green) and anti-calbindin (magenta) antibodies. White arrows indicate Nav1.6 immunoreactivities in the AIS of PCs. Scale bars, 20 μm.


- Table 1.
Parameters of the first APs evoked by threshold currents and passive electrical properties in WT and ARF4+/−/ARF5−/− PCs
WT ARF4+/−/ARF−/− t test results AP parameters n = 35 n = 33 AP peak, mV 14.7 ± 1.4 11.3 ± 1.7 p = 0.102 Maximum rate of rise, mV/ms 390.3 ± 17.7 363.8 ± 15.3 p = 0.194 Maximum rate of fall, mV/ms −260.6 ± 14.2 −237.6 ± 11.9 p = 0.223 AP threshold, mV −58.1 ± 0.9 −59.4 ± 1.1 p = 0.295 AP half-amplitude width, ms 0.36 ± 0.02 0.37 ± 0.01 p = 0.630 AP afterhyperpolarization peak, mV −72.6 ± 0.9 −73.8 ± 1.0 p = 0.190 Adjusted membrane potential (mV) before current pulses −81.1 ± 0.38 −81.4 ± 0.40 p = 0.578 Passive electrical properties n = 38 n = 30 Membrane capacitance, pF 552.1 ± 45.6 512.3 ± 46.8 p = 0.545 Input resistance, MΩ 239.2 ± 32.9 272.3 ± 36.7 p = 0.504 The first APs evoked by the smallest injected currents (i.e., threshold currents) were analyzed to estimate AP waveform parameters. To even out voltage-dependent effects on ion channel states before current pulses, PC membrane potential was always set to −81 mV, and we confirmed that there was no significant difference between WT and ARF4+/−/ARF5−/− mice. Maximum rates of rise and fall in each AP were measured by detecting positive and negative peak values of its differentiated waveform (dV/dt), respectively. The AP threshold was defined as the membrane potential at which dV/dt exceeded 20 mV/ms. AP half-amplitude width was defined as the width at the midpoint between the threshold and the peak of its AP. The passive electrical properties of PCs were estimated using averaged traces of ∼20 current responses evoked by hyperpolarizing voltage pulses (from −85 to −90 mV, 500 ms duration) in a voltage-clamp mode.


