

Abstract
Neuronal activity from the entorhinal cortex propagates through the perforant path (PP) to the molecular layer of the dentate gyrus (DG) where information is filtered and converted into sparse hippocampal code. Nearly simultaneous signaling to both granule cells (GC) and local interneurons (INs) engages network interactions that will modulate input integration and output generation. When triggered, GABA release from interneurons counteracts the glutamatergic signals of PP terminals, scaling down the overall DG activation. Inhibition occurs at fast or slow timescales depending on the activation of ionotropic GABAA-R or metabotropic GABAB-R. Although postsynaptic GABAA and GABAB-R differ in their location at the synapse, mixed GABAA/B-R IPSPs can also occur. Here we describe a slow inhibition mechanism in mouse GCs recorded from either sex, mediated by GABAA/B-R in combination with metabotropic glutamate receptors. Short burst PP stimulation in the gamma frequency range lead to a long-lasting hyperpolarization (LLH) of the GCs with a duration that exceeds GABAB-R IPSPs. As a result, LLH alters GC firing patterns and the responses to concomitant excitatory signals are also affected. Synaptic recruitment of feedforward inhibition and subsequent GABA release from interneurons, also successfully trigger mixed GABA responses in GCs. Together these results suggest that slow inhibition through LLH leads to reduced excitability of GCs during entorhinal input integration. The implication of LLH in regulation of neuronal excitability suggests it also contributes to the sparse population coding in DG.
SIGNIFICANCE STATEMENT Our study describes a long-lasting hyperpolarization (LLH) in hippocampal granule cells. We used whole-cell patch-clamp recordings and an optogenetic approach to characterize this event. LLH is a slow inhibitory mechanism that occurs following the stimulation of the perforant pathway in the molecular layer of the dentate gyrus. We found that it is mediated via postsynaptic ionotropic and metabotropic GABA and metabotropic glutamate receptors. The duration of LLH exceeds previously described IPSPs mediated by any of these receptors. The activation of LLH requires presynaptic gamma frequency bursts and recruitment of the local feedforward inhibition. LLH defines prolonged periods of low excitability of GCs and a restrained neuronal discharge. Our results suggest that LLH can contribute to sparse activation of GCs.
Introduction
Communication between the entorhinal cortex (EC) and the hippocampal formation is crucial for spatial orientation and memory. Information from cortical and subcortical afferents (Canto et al., 2008) converge onto the EC and this information is further transferred to the hippocampus via the perforant path (PP). At the entry of the hippocampus, the dentate gyrus (DG) is the first structure to mediate the integration of the EC input (Treves et al., 2008). Although barrages of simultaneous stimuli reach the granule cells (GCs), sparse firing and low excitability (Chawla et al., 2005) contribute to the information filtering that takes place in the DG. The resulting GC output represents the conversion of dense cortical information into sparse hippocampal code.
All areas of the DG receive glutamatergic signals from the EC, principal cells in the granule cell layer, interneurons from the molecular layer (ML) and the hilus. The DG response to the EC is thus defined by the interplay of excitation and local inhibition. A hallmark of the DG is the lack of robust activity during high intensity EC stimuli, such as γ/β firing (Coulter et al., 2011, Alme et al., 2010; Pernía-Andrade and Jonas, 2014). Such a low activation profile is characteristic for information transformation processes (Diamantaki et al., 2016). The intrinsic properties of GCs allow them to maintain a high action potential (AP) threshold (Schmidt-Hieber et al., 2007). Several excitatory signals need to arrive simultaneously to create enough depolarization and reach the AP threshold. Beside intrinsic properties, inhibition is crucial for sustained sparse activity in the DG (Ewell and Jones, 2010). Interneurons are recruited directly by EC terminals [feedforward inhibition (FFI)] and firing GCs [feedback inhibition (FBI)]. Thus, the final DG output is under the control of the entire DG microcircuit. The ratio between excitation and inhibition undergoes constant modulations to maintain a steady balanced state in favor of low activation (Leutgeb et al., 2007). This is made possible by dynamic adaptations via fast and slow inhibitory signals. Alterations of this equilibrium leading to temporal jitter and enhanced amplitude synaptic events can give rise to massive activation of GCs, as observed during epileptic seizures (Cossart et al., 2005).
Fast inhibition (10–40 ms) in GCs is mediated through activation of ionotropic GABAA receptors (GABAA-Rs), whereas slow inhibition requires the activation of metabotropic GABAB-R. Slow inhibition is implicated in the regulation of neuronal excitability (Mitchell and Silver, 2003; Zucca et al., 2017). In the DG microcircuit, there are several pathways that lead to slow inhibition: slow onset interneurons (INs; Mori and Gerber, 2002), persistent firing (Sheffield et al., 2013; Overstreet-Wadiche and McBain, 2015), or activation of postsynaptic GABAB-Rs due to repetitive firing and GABA accumulation (Piguet, 1993; Scanziani, 2000). Investigating slow inhibition mechanisms is of particular interest in the DG as the functional consequences contribute to GCs sparse activity.
We describe a slow inhibitory mechanism triggered in GCs following PP activation and subsequent recruitment of FFI from interneurons in the ML. This mechanism consists of the induction of a particularly long-lasting hyperpolarization (LLH) that exceeds (max = 5.25 s) the slow IPSPs durations reported (Isaacson and Scanziani, 2011). Slow IPSPs have been previously described (Rausche et al., 1989; De Koninck and Mody, 1997; Thomson and Destexhe, 1999) in hippocampal neurons but the functional consequences in GCs as well as the underlying mechanism have not been entirely elucidated. Our results show that LLH can significantly lower GC excitability over extended time periods during which prevents AP firing. Optogenetic isolation of PP signaling in the ML confirms that LLH can be synaptically induced. Moreover, these data demonstrate that GABA release from local interneurons can successfully evoke postsynaptic GABAA/B-R activation. Mixed GABAA/B-R IPSPs have been shown in pyramidal cells in the neocortex (Thomson and Destexhe, 1999) but not in DG. We propose that LLH is a complementary network strategy contributing to GCs' low excitability.
Materials and Methods
Slice preparation.
All the experiments involved the use of wild-type C57BL/6 (RRID:IMSR_JAX:000664; https://www.jax.org/strain/000664; The Jackson Laboratory) mice, either sex, aged from P15 to P90. The animals were first deeply anesthetized with isoflurane and then euthanized by decapitation. Brains were rapidly extracted and immersed in ice-cold (4°C) and continuously oxygenated (95% O2, 5% CO2) artificial CSF (ACSF) containing the following (in mm): 87 NaCl, 25 NaHCO3, 2.5 KCl, 1.25 NaH2PO4, 7 MgCl2, 5 CaCl2, 25 glucose, and 75 sucrose, pH equilibrated at 7.4, 330 mOsm. Both hippocampi were then partially isolated and acute slices (300 μm) were cut using a microtome (Leica, VT1200S). The hippocampal slices were left to recover in oxygenated ACSF containing the following (in mm): 124 NaCl, 25 NaHCO3, 2.5 KCL, 1.2 MgCl2, 2.5 CaCl2, and 10 glucose, pH = 7.4, 300 mOsm, 30 min at 32°C and were subsequently kept at room temperature.
Electrophysiological recordings.
The slices were placed in a recording chamber perfused with oxygenated ACSF, heated to 32–34°C. Granule cells were identified based on their characteristic location in the granule cell layer and shape of soma. Indirect stimulation of GCs and the local network was achieved by stimulation of the perforant path terminals in the molecular layer. For this purpose, a glass micropipette electrode filled with ACSF was positioned at the border between the outer and the inner molecular layers of the dentate gyrus. Stimuli were delivered via Stimulus Isolator A360 (World Precision Instruments) and the stimulation intensity was adjusted to evoke steady responses in the recorded cells. GCs were recorded mainly in current-clamp configuration and kept at an adjusted suprathreshold potential (∼−45 mV). The recording pipette (resistance of 5–7 mΩ) was filled with intracellular solution containing the following (in mm): 120 K-gluconate, 10 HEPES, 2 MgCl2, 2 Mg2ATP, 0.3 NaGTP, 7 phosphocreatine, 0.6 EGTA, 20 KCl, pH = 7.3, 305 mOsm. All recordings were obtained with Molecular Devices MultiClamp 700A in combination with Digidata 1322A digitizer (Molecular Devices) and Clampfit 10.2 software (Molecular Devices). For the experiments presented in Figures 1–7, the cells were maintained at suprathreshold membrane potential (∼−45 ± 2 mV), where action potentials were emitted at the approximate frequency of 0.1. For the experiments in Figures 8 and 9, the cells were maintained at a subthreshold (∼−60 ± 2 mV) to favor action potential firing following PP stimulation. Supra and subthreshold membrane potentials were established for each cell prior stimulation by the injection of current steps (20 pA). The identification of the DG layers was done visually using the borders of the suprapyramidal blade of the stratum granulosum and lacunosum moleculare of area CA1 as reference points. We determined the middle molecular layer as an area between the inner (adjacent to GC soma) and the outer (adjacent to CA1 pyramidal cell soma) molecular layers.
Calbindin staining.
The hippocampal slices were immersed in PFA 4% solution overnight immediately after the experiment. The sections were rinsed in 0.1 PB 0.1 m, pH 7.4, then incubated for 30 min in 0.5% Triton–PBx-100. After incubation the sections were rinsed in PB 0.1 m and immersed in PBS (0.01 m)–NGS (10%) for 1 h at room temperature. The primary antibody was diluted (1:200) in PBS 0.01 m–NGS (10%). The slices were incubated in the presence of the antibody for 2 d at 4°C. After rinsing with 0.01 m PBS, the sections were incubated in presence of the secondary antibody (AlexaFluor 488) diluted (1:500) in PBS 0.01 m for 6 h at room temperature before rinsing (PBS 0.01 m) and mounting on slides using Dako Fluorescence Mounting Medium.
Fluorescent images.
All fluorescence images were taken by confocal microscopy (Zeiss) using 10×, 40×, or 63× objectives.
Drugs.
When specified, drugs were included in the perfusion solution for pharmacological manipulation of the cell and/or connecting network. These include: Bicuculline methiodide 10 μm (Tocris Bioscience), CNQX 10 μm (6-cyano-7-nitroquinoxaline-2,3-dione; Tocris Bioscience), AP5 50 μm (d-(-)-2-amino-5-phosphonopentanoiic acid; Tocris, Bio-Techne), CGP 55845 20 μm [(2S)-3-[[(1S)-1-(3,4-dichlorophenyl)ethyl]amino-2-hydro xypropyl](phenylmethyl) phosphinic acid hydrochloride; Tocris, Bio-Techne], CPPG 600 μm [(R, S)-α-cyclopropyl-4-phosphonophenylglycine; Tocris Bio-Techne], LY 487379 10 μm (2,2,2-Trifluoro-N-[4-(2-methoxyphenoxy)phenyl]-N-(3-pyridinylmethyl) ethanesulfonamide hydrochloride; Tocris, Bio-Techne), LY 341495 0.5 μm [(2S)-2-Amino-2-[(1S,2S)-2-carboxycycloprop-1-yl]-3-(xanth-9-yl)propanoic acid Tocris, Bio-Techne], CGP 7930 30 μm (3,5-bis(1,1-dimethylethyl)-4-hydroxy-β,β-dimethyl-benzenepropanol; Tocris, Bio-Techne).
Stereotaxic injections from bregma.
For optogenetic stimulation of the EC terminals in the DG, we used a viral delivery of channelrhodopsin2 [AAV9.CaMKIIa.hChR2 (E123T/159C).mCherry.WPRE.hGH, 100 μl; Penn Vector Core-University of Pennsylvania] in the EC of wild-type C57BL/6 males (The Jackson Laboratory). The animals were head-fixed in a stereotaxic frame and anesthetized with isoflurane throughout the surgery. Weight matched mice, aged P25–P32, received viral injections in both hemispheres (300 nl each, 300 nkm) through a Hamilton syringe with a 33-gauge needle. The following coordinates were used taking the bregma as reference point (in mm): x (rostral-caudal): 3.7; y (medial-lateral): 3.25; z (dorsal-ventral): 2.4.
Optogenetic manipulations.
Injected mice were euthanized for slice preparation 3–5 weeks after surgery. All animals characterized a robust viral expression of channelrhodopsin (ChR2) in the entorhinal cortex and along the projections in the dentate gyrus. The expression of ChR2 was detected via the high intensity fluorescence of mCherry. For stimulation of the perforant path in the dentate gyrus we used a LED optrode (Doric Lenses), 100 nm in diameter, positioned on slice surface, at the border between inner and outer molecular layer. When needed, the optrode location was adjusted along the same axis until strong and regular EPSPs of at least 5 mV were observed in recorded cells.
Experimental design and Analysis.
All raw data were analyzed using Clampfit 10.2 software (Molecular Devices). Statistical analysis (paired t test, 95% confidence intervals) and graphs were prepared using GraphPad Prism 5 and Origin (OriginLab). For analysis of different cells (see Fig. 4) the unpaired t test was used. For p > 0.05, non significant (ns) difference was assumed; *: p < or = 0.05; **: p < or + 0.01; ***: p < or = 0.0001. All error bars represent the SEM values. All statistical analysis was done on raw data. For LLH duration analysis we used Clampfit 10.2 cursors to define the last pulse of the stimulation train (5 pulses of 0.1 ms at 50 Hz except otherwise stated) as a start reference point and the return to baseline (maintained stable during control and recovery in the current-clamp configuration) as the end reference. In the cases where LLH was eliminated by the receptor blockers, we measured the deflection from baseline that most often corresponded to the average interspike interval. Trials where AP occurred immediately after the last stimulation pulse in bursts were excluded.
Results
EPSPs evoked by perforant path stimulation are followed by a LLH in dentate GCs
Excitatory entorhinal terminals innervate both GCs and INs in the dentate gyrus. Entorhinal input initiates an interplay between long range excitation and local network inhibition that will shape the output of GCs. To determine how these interactions influence GC action potential firing, we recorded GCs in whole-cell current-clamp and stimulated the PP. The stimulating electrode was positioned in the middle molecular layer where terminals of the medial EC (MEC) have been shown to contact the apical dendrites of the GCs (Blackstad, 1958; Hjorth-Simonsen and Jeune, 1972; Witter, 2007). We used the borders of the suprapyramidal blade of stratum granulosum and lacunosum moleculare of area CA1 as reference points (Witter et al., 2007). The inner and outer molecular layers were established based on their relative distance from the GC layer and CA1. The stimulation consisted of either a single pulse or a short burst (5 pulses, 50 Hz). PP stimulations were followed by membrane hyperpolarization in which the length was dependent on the stimulus frequency (0.1 vs 50 Hz; Fig. 1A). To evaluate the time window in which the IPSP can suppress action potential firing in GCs, we depolarized the membrane to suprathreshold values (Vm ∼ 45 mV) where the cells fire APs spontaneously. Single PP stimulation and train stimulation IPSPs altered the firing pattern of the cells with significant differences in amplitude and duration (Fig. 1B,C). Hyperpolarization after the PP burst is unusually long lasting with a twofold increase in duration compared with a single-pulse IPSP (single: 1.18 ± 0.053 s, train: 2.38 ± 0.074 s, p < 0.0001; Fig. 1C). The increase in duration correlates with similar increase in amplitude (single: 7.17 ± 0.2 mV, train: 14.28 ± 0.6 mV, p < 0.0001; Fig. 1C). This phenomenon was also observed in the absence of postsynaptic firing of the recorded cell, when QX 314 was included in the patch electrode (Fig. 1D; duration after single pulse: 0.285 ± 0.036 s, duration after train: 1.173 ± 110.9 s, p < 0.0001; amplitude after single pulse: 2.86 ± 0.66 mV, amplitude after train: 6 ± 1.4 mV, p = 0.0103; n = 14). Next, we explored the effect of burst induced LLH on the firing pattern of GCs. Unstimulated GCs fire AP continuously whereas PP induced LLH restrained the GCs from firing action potentials upon depolarization for over a second (2.12 ± 0.13 s; Fig. 1E). We quantified this effect using AP frequency distribution in time (APFDT) analysis in GCs during PP stimulation (Fig. 1F). The total blockage of APs in this condition lasted for 0.8 ± 0.1 s. LLH further altered the firing pattern by decreasing AP frequency (APF) for up to 2 s after the end of the stimulation (2.1 ± 0.1 s). We quantified the effect on spiking activity by splitting the recordings of each GC in three time windows (Fig. 1G): control (2 s before burst stimulation), LLH (2 s after end of burst stimulation), and recovery time window (2–4 s after end of LLH). APF during the LLH time window is significantly decreased (7% of control, ctrl = 0.06 ± 0.004; LLH = 0.01 ± 0.03, p < 0.0001; Fig. 1G). Control and recovery APF did not differ significantly (97% of control, recovery = 0.08 ± 0.005, p = 0.7565). We did not observe any additional long-term effects of LLH on the APF distribution outside the LLH time window. This was also confirmed by the lack of difference in EPSP amplitude over time (data not shown). Together, these results qualify LLH as a short-term plasticity (STP) mechanism capable of decreasing AP firing of GCs for extended periods of time.

EPSPs evoked by PP stimulation are followed by a LLH in dentate GCs. A, Representative current-clamp traces of hyperpolarization following either single pulse (top) or 50 Hz train (Vm = −60 mV) stimulation of the perforant path. B, Firing pattern of a GC (Vm = −45 mV) expressing LLH after PP stimulation with one pulse (black arrow) followed 4 s later by five pulses at 50 Hz (red arrow); inset (bottom) shows a single trial of the same cell and a magnification of the superposition of hyperpolarization events evoked either by a single pulse (black) or a train of 5 pulses (red) at 50 Hz. C, Comparison of the amplitude (mV) and the duration (s) of the hyperpolarization either after a single pulse or a train stimulation of the PP, shows that there is a significantly longer (single: 1.18 ± 0.53 s, train: 2.38 ± 0.74 s, p < 0.0001, n = 12) and bigger (single: 7.17 ± 1.48 mV, train: 14.28 ± 3.78 mV, p < 0.0001, n = 12) hyperpolarization when a train stimulation was applied. D, LLH remains expressed in GCs in the absence of postsynaptic firing (QX 314), as shown in terms of IPSP amplitude (QX 314 single pulse: = 2.858 ± 0.6576 mV; QX 314 train: = 6.44 ± 1.439 mV, p = 0.0103, n = 14), and duration (QX 314 single pulse: 0.285 ± 0.035 s, QX 314 train: 1.173 ± 0.11 s, p < 0.0001, n = 14); left, an example of LLH expression during current-clamp recording of a GC in presence of QX 314 in the patch electrode (5 pulses, 50 Hz). E, An example of the firing pattern of a GC over five trials; traces above correspond to an unstimulated cell, below, stimulated GC with LLH; black arrows indicate single-pulse stimulation and red arrows indicate a five-pulse burst (50 Hz) stimulation of the PP. F, The firing pattern of GCs is altered for an extended period of time (2.12 ± 0.13 s, n = 24) because of LLH expression as revealed by APFDT analysis of the firing pattern of GCs (Vm = −45 mV, 50 ms bins, raw values are normalized to the number of trials per cell); single trials appear in light gray and the mean curve with SEM is in red (running average over 4 points); arrows indicate time of stimulation (black, single pulse; red, train). G, For quantitative summary of APFDT analysis, the total recording time of GCs is split in three time windows as follows (see top scheme, red arrows indicate train stimulation time): time before stimulation (control, 2 s), LLH time (green square overlay, adjusted according to each cell LLH duration), and recovery (2 s). AP frequency in the LLH time window is significantly decreased compared with control and recovery time windows (Ctrl = 0.06 ± 0.004; LLH = 0.01 ± 0.03, Ctrl vs LLH: p < 0.0001, Recovery = 0.08 ± 0.005, Ctrl vs Recovery: p = 0.7565; n = 12 non significant (ns): p > 0.05, difference was assumed; *: p < or = 0.05; **: p < or + 0.01; ***: p < or = 0.0001.).
LLH is dependent on mixed GABAA/B-Rs and mGluR2 activation
Next, we aimed to pharmacologically identify those receptors that are responsible for such a long-lasting inhibition on AP firing. We sequentially blocked GABAA, GABAB, (Thalmann and Ayala, 1982; Oliver and Miller, 1985; Rausche et al., 1989; De Koninck and Mody, 1997; Armstrong et al., 2011), and metabotropic glutamate receptors (mGluR2), which have been reported to have inhibitory effect on GCs (Brunner et al., 2013).
We used APFDT analysis in the previously described three time windows (Ctrl, LLH, and Recovery; Fig. 2A–D, top scheme) to measure the impact of various receptor blockers on APF. Consistent with previous results, LLH significantly decreased APF in depolarized GCs (Ctrl = 0.07 ± 0.004; LLH = 0.01 ± 0.003, 15 ± 5% of control; Recovery = 0.08 ± 0.005; p < 0.0001; Fig. 2A,F). The application of the GABAA-R antagonist bicuculline (BIC) decreased LLH duration (ACSF = 1.1 ± 0.07, BIC = 0.8 ± 0.03, p = 0.0002; Fig. 2B,E). As a consequence, APF in the LLH time window increased (Control = 0.07 ± 0.003, LLH = 0.03 ± 0.004, Recovery = 0.07 ± 0.003, p < 0.0001; 41 ± 13% of control; Fig. 2B,F). Even so, burst induced LLH and its capacity to block APs remained significant (duration p = 0.0002, APFDT p < 0.0001; Fig. 2B,E,F). The combination of GABAA/GABAB-R antagonists (BIC, CGP, respectively) further decreased LLH duration (0.4 ± 0.04, p < 0.0001; Fig. 2C,E), whereas APFDT in the LLH time window continued to increase (LLH APFDT = 0.034 ± 0.004; 54 ± 14% of control; Fig. 2C,F). Nevertheless, APFDT in the LLH time window remained significantly lower than control level (Ctrl = 0.06 ± 0.003, p < 0.0001; Fig. 2C,F). This result implies that LLH is not solely mediated through GABAA/B-R. Brunner et al. (2013) identified a novel inhibitory mechanism in dentate GCs, mediated by postsynaptic mGluR2-activated potassium conductance. Also, mGluR2 activation uniformly reduced the peak amplitude of synaptic inputs. To test the contribution of these receptors to LLH mechanism, we applied a selective mGluR II-III antagonist (CPPG) in combination with BIC and CGP 55845 Figure 2D. This abolished LLH expression in terms of duration (0.05 ± 0.006 s; Fig. 2E) and the APFDT in the LLH time window increased to near control and recovery values (Ctrl = 0.14 ± 0.004, LLH = 0.14 ± 0.007, Recovery = 0.14 ± 0.005, p = 0.77; 106 ± 18% of control; Fig. 2D–F).

LLH is a multicomponent mechanism. A–D, Firing pattern (top) and quantitative summary of APFDT analysis (bottom) of GCs during PP stimulation (5 pulses at 50 Hz) in ACSF and after consecutively adding GABAA (BIC, 10 μm), GABAB (CGP 55845, 20 μm) and mGluR II/III (CPPG, 600 μm) receptor inhibitors; LLH time window is adjusted for LLH duration of each cell measured in ACSF in the beginning of each recording; AP frequency is adjusted to number of trials for each cell, n = 12 (average APFDT values: ACSF Ctrl = 0.07 ± 0.004, ACSF LLH = 0.01 ± 0.003, ACSF Recovery = 0.08 ± 0.005; p < 0.0001; BIC Ctrl = 0.07 ± 0.03, BIC LLH = 0.03 ± 0.004, BIC Recovery = 0.07 ± 0.002; p < 0.0001; BIC/CGP 55845 Ctrl = 0.06 ± 0.003, BIC/CGP 55845 LLH = 0.03 ± 0.004, BIC/CGP 55845 Recovery = 0.06 ± 0.003, p < 0.0001; BIC/CGP 55845/CPPG Ctrl = 0.14 ± 0.003, BIC/CGP 55845/CPPG LLH = 0.14 ± 0.007, BIC/CGP 55845/CPPG Recovery = 0.14 ± 0.004, p = 0.7719). E, Top, LLH duration (1.1 ± 0.07 s, n = 12) decreases when GABAA (0.8 ± 0.03 s, p = 0.0002, n = 12) and GABAB (0.4 ± 0.04 s, p < 0.0001, n = 9) receptors are inhibited, and becomes negligible when mGluR II-III antagonist (CPPG) is also added to the bath (0.05 ± 0.006 s, p < 0.0001,n = 9). Bottom, LLH duration also decreased after addition of the mGluR2-specific antagonist LY 341495 (0.8 ± 0.04 s, p = 0.0495, n = 10); additionally blocking GABAA-R with BIC (0.8 ± 0.04, p = 0.730, n = 8) and GABAB-R with CGP 555845 (0.06 ± 0.01 s, p < 0.0001, n = 6) completely abolished LLH. F, Left, AP frequency during LLH is restored to control levels after blockade of GABAA, GABAB and mGluR II-III antagonist CPPG (ACSF LLH APF = 15 ± 5% of control; BIC LLH APF = 41 ± 13% of control; BIC/CGP LLH APF = 54 ± 14% of control and BIC/CGP/CPPG LLH APF = 106 ± 18% of control). Right, mGluR2-specific antagonist increases APF in the LLH time window by ∼35% (39 ± 12% of control; LY 341495 Control = 0.06 ± 0.01, LY 341495 LLH = 0.01682 ± 0.006, LY 341495 Recovery = 0.06744 ± 0.009, Ctrl vs LLH, p = 0.0063, n = 10); LY 341495 in combination with GABAA/B R antagonists (BIC, CGP 55845, respectively) restores APF similar to control levels (ACSF average LLH duration = 0.9 ± 0.06 s, LY 341495/BIC/CGP 55845 average LLH duration = 0.06 ± 0.01 s, p < 0.001, n = 6; LY 341495/BIC/CGP 55845 LLH APFDT = 83% of control, p = 0.1203; n = 6); non significant (ns): p > 0.05, difference was assumed; *: p < or = 0.05; **: p < or + 0.01; ***: p < or = 0.0001.
Metabotropic GluR2 receptors are also present at the medial perforant path presynaptic terminals (Shigemoto et al., 1997) where they can reduce neurotransmitter release (Anwyl, 1999). To exclude the possibility that presynaptic receptors are involved in this mechanism, we used the mGluR2-specific antagonist LY 341495. The application of LY 341495 alone significantly decreased LLH duration (0.8 ± 0.04 s, p = 0.0495, n = 10) and had a slight effect over APFDT in the LLH time window (LY 341495 Control = 0.06 ± 0.01, LY 341495 LLH = 0.01682 ± 0.006, LY 341495 Recovery = 0.06744 ± 0.009, Ctrl vs LLH: p = 0.0063, n = 10). The LLH was not fully abolished until GABAA/B-R antagonists were supplemented in the perfusion bath (ACSF average LLH duration = 0.9 ± 0.06 s, LY 341495/BIC/CGP 55845 average LLH duration = 0.06 ± 0.01 s, p < 0.001, n = 6; LY 341495/BIC/CGP 55845 LLH APFDT = 83% of control, p = 0.1203; n = 6; Figure 2E,F). In conclusion, we identified three main components involved in the LLH mechanism: fast and slow inhibition from postsynaptic GABAA and GABAB receptors, and postsynaptic mGluR2.
The simultaneous activation of the slow components is highly dependent on the amount of neurotransmitter release on the released transmitter availability following PP stimulation. We did not investigate further the role of GABAA-R, as we were interested in the extended duration of LLH which we have shown to be mediated by the cooperative activation of mGluR2 and GABAB-R. To establish how a variation of receptor activation could impact LLH we took advantage of the available pharmacological tools that enable the specific manipulation of mGluR2 and GABAB-R. We used the positive allosteric modulators LY 487379 and CGP 7930 respectively. We measured the LLH duration and evaluated the LLH impact on the firing pattern using again the APFDT analysis. The application of LY 487379 (Fig. 3A) did not significantly affect LLH duration (ACSF LLH duration 0.7 ± 0.07 s, LY 487379 LLH duration 0.8 ± 0.08, p = 0.7127, n = 9) or the AP frequency in the LLH time window (LY 487379 LLH APF = 0.01 ± 0.004, 41% of control; ACSF LLH APF = 0.02 ± 0.007, 28% of control, n = 8). The application of the mGluR2-specific antagonist LY 341495 also did not abolish the LLH impact over APF in the LLH time window (LY 341495 LLH APF = 31% of control, p = 0.0220, n = 7) or LLH duration (0.85 ± 0.09 s; p = 0.1764, n = 9). The GABAB-R-positive allosteric modulator CGP 7930 increased LLH duration (Fig. 3B; ACSF LLH duration = 0.9 ± 0.05 s; CGP 7930 LLH duration = 1.3 ± 0.09 s, p = 0.005, n = 7) and APF distribution decrease in the LLH time window (Fig. 3B; CGP 7930 LLH APF = 36% of control, p < 0.001, n = 11). The GABAB-R antagonist CGP 55845 significantly decreased LLH duration (CGP 55845 LLH duration = 0.6 ± 0.07 s, p < 0.001) and provoked a slight increase in APF distribution (Fig. 3B; CGP 55845 LLH APF = 49% of control, p = 0.001, n = 7). Finally, we applied LY 487379 and CGP 7930 together, which led to an increase in LLH duration (Fig. 3C; ACSF LLH duration = 1.08 ± 0.14 s; LY 487379/CGP 7930 LLH duration = 1.17 ± 0.15 s; p = 0.0125, n = 10) and had similar impact over APF distribution in the LLH time window (ACSF LLH APF = 38% of control, p = 0.0003, n = 10; LY 487379/CGP 7930 LLH APF = 46% of control, p = 0.0047, n = 10). When both GABAB and mGluR2 receptors were blocked (Fig. 3C) by their antagonists (CGP 55845/LY 34195 respectively), LLH duration was significantly reduced (CGP 55845/LY 34195 LLH duration = 0.44 ± 0.04 s, p < 0.001, n = 10) and APF increased to 65% of control (p < 0.2864, n = 10). These results altogether argue that LLH is the result of the simultaneous activation of GABAB-R and mGluR2; the functional consequences of this dual activation allow for the extension of the late component of the IPSP duration in GCs following PP stimulation. Furthermore, the results show that the positive allosteric modulation of mGluR2 and GABAB-R do not lead to an additional impact over GCs firing and LLH duration.

Positive allosteric modulators (PAMs) of mGluR2 (LY 487379) and GABAB-R (CGP 7930). A, Application of the mGluR2 PAM–LY 487379. Top, An example trace of the firing pattern of a GC (Vm = −45 ± 2 mV) and corresponding graph showing the normalized APFDT in presence of LY 487379 and LY 341495; LLH expression in the presence of LY 487379 (41 ± 6% of control); and of the mGluR2-specific antagonist LY 341495 (LLH APF = 31 ± 11%). Bottom, LLH duration in the presence of mGluR2 PAM (LY 487379 LLH = 0.7 ± 0.07 s, p = 0.3389, n = 9) and mGluR2 antagonist (0.9 ± 0.09 s, p = 0.1764, n = 9). B, Application of GABAB-R PAM–CGP 7930. Top, An example trace of the firing pattern of a GC (Vm = −45 ± 2 mV) in the presence of CGP 7930 and corresponding graph showing normalized APFDT in CGP 7930 (36 ± 10% of control, n = 11) and CGP 55845 (49 ± 10% of control, n = 7). Bottom, CGP 7930 increased LLH duration = 1.3 ± 0.09 s (p = 0.0005, n = 11) and CGP 55845 decreased LLH duration in a significant manner (0.6 ± 0.07 s, p < 0.001, n = 7). C, Application of mGluR2 PAM LY 487379 and GABAB-R PAM CGP 7930 and the respective antagonists LY 341495/CGP 55845. Top, An example trace of the firing pattern of a GC (Vm = −45 ± 2 mV) and corresponding APFDT (LY 487379/CGP 7930 LLH APF = 46 ± 12% of control; LY 341495/CGP 55845 LLH APF = 65 ± 13% of control). Bottom, LLH duration is significantly affected by LY 487379/CGP 7930 (LY 487379/CGP 7930 LLH = 1.17 ± 0.14 s, p = 0.0125, n = 11; LY 341495/CGP 55845 LLH = 0.44 ± 0.05 s, p < 0.001, n = 8; non significant (ns): p > 0.05, difference was assumed; *: p < or = 0.05; **: p < or + 0.01; ***: p < or = 0.0001.).
LLH is an age-dependent mechanism
For the above experiments we used mixed age (P15–P21) mice. We noticed a tendency for LLH to be more reliable in the DG of older animals. To quantify how age influences LLH expression and its properties, we used LLH stimulation (5 pulses at 50 Hz to the PP) in hippocampal slices from mice P15 to 9 months old. This allowed us to discriminate 3 age groups where LLH showed significant differences. In GCs of juvenile animals (P15–P20) burst stimulation of PP failed to induce LLH (Fig. 4A, P17). However, we did observe fast IPSPs (0.39 ± 0.07 s, 3.2 ± 0.9 mV; Fig. 4B). The group of young animals (P20–P30) expressed LLH after burst stimulation (1.2 ± 0.15 s, 8.2 ± 0.73 mV; Fig. 4A, P23, B). Although LLH remained highly variable from cell to cell, it reached the maximal amplitude (11 ± 0.92 mV; Fig. 4B) and duration (1.6 ± 0.12 s; Fig. 4B) in adults (P30+). This suggests that LLH develops during the first weeks of rodent life. Next, we recorded LLH in GCs from several months old mice to determine whether this trend continues at later developmental stages. We saw no significant differences in LLH amplitude and slight decrease in LLH duration in older animals compared with LLH in the adult group (11.4 ± 0.29 mV, p = 0.07; 1.5 ± 0.07 s, p = 0.029; Fig. 4C). Thus, LLH emerges during the first month of life in mice and reaches a plateau throughout adulthood.

LLH is an age-dependent mechanism. A, Single-trial current-clamp traces representative for the firing pattern of GCs(Vm = −45 ± 2 mV) of juvenile (P17), young (P23), and adult (P37) mice during PP stimulation (black arrows; 5 pulses at 50 Hz). Inset, Zoom over superposition of LLH in juvenile (black), young (red), and adult (blue) animals to reveal differential expression and impact over AP firing pattern of these cells. B, Comparison of duration (s) and amplitude (mV) of LLH shows significant increases (Durations: juvenile = 0.392 ± 0.067 s, young = 1.2 ± 0.152 s and adults = 1.6 ± 0.119 s, juvenile vs young: p = 0.0006, n = 6; young vs adults: p = 0.1094, n = 6; Amplitudes: juvenile = 3.2 ± 0.9 mV; young = 8.2 ± 0.74 mV and 11.09 ± 0.56 mV in adults, juvenile vs young: p < 0.0010, n = 6; young vs adults: p = 0.0063, n = 6) with aging from juvenile to young mice with slight increases further into adulthood. C, Summary of increases of LLH in terms of duration (s) and amplitude (mV) in GCs from juvenile to adult animals, reaching maximal values (in this subset of GCs maximal amplitude was 16 mV and maximal duration was 6 s) and plateau in older healthy individuals. Average durations (s): P15+ = 0.6 ± 0.06; P20+ = 1.2 ± 0.08; P31+ = 1.8 ± 0.12; 4 months = 1.8 ± 0.11, 7 months = 1.8 ± 0.26; 9 months = 1.6 ± 0.08; Mean differences: Adults (P31+, n = 6) vs 4–9 months (n = 6), p = 0.290; Average amplitudes (absolute, mV): P15+ = 2.3 ± 0.24; P20+ = 9.3 ± 0.39; P31+ = 10.7 ± 0.16; 4 months = 12 ± 0.39; 7 months = 11 ± 0.3; 9m = 11.4 ± 0.29; Mean differences: Adults (P31+) vs 4–9 months, p = 0.0740; non significant (ns): p > 0.05, difference was assumed; *: p < or = 0.05; **: p < or + 0.01; ***: p < or = 0.0001.
LLH is activity-dependent
The frequency and the number of stimuli are two coding mechanisms used for neuronal communication. LLH is preferentially induced after short burst stimulation. To determine which stimulation parameter plays a key role in determining whether LLH will occur, we systematically modified the frequency or the length of the stimulation train. The first stimulation paradigm included five pulses delivered at low to high frequencies (1–200 Hz). Stimuli arriving at 1 Hz did not induce LLH (2.5 ± 0.3 mV; 0.4 ± 0.05 s; Fig. 5A,B). Fast IPSPs induced by this stimulation did not create a prolonged blockage of APs in depolarized GCs (Fig. 5C,D). When five pulses were delivered at higher frequency (50 Hz; Fig. 5A), LLH was successfully induced (1.1 ± 0.09 s; 6.3 ± 0.77 mV; Fig. 5B). The duration and amplitude of the slow IPSP increased in parallel with frequency of stimulation (1 Hz = 0.4 ± 0.05 ms, 2 Hz = 0.6 ± 0.15 s, 5 Hz = 0.8 ± 0.12 s; 10 Hz = 0.7 ± 0.12 s; 20 Hz = 0.9 ± 0.15 s; 50 Hz = 1.07 ± 0.1 s; 100 Hz = 1.09 ± 0.26 s; 200 Hz = 0.9 ± 0.16 s; 1 Hz = 2.5 ± 0.3 mV, 2 Hz = 2.25 ± 0.39 mV, 5 Hz = 3.12 ± 0.45 mV; 10 Hz = 2.95 ± 0.46 mV; 20 Hz = 3.6 ± 0.59 mV; 50 Hz = 6.27 ± 0.77 mV; 100 Hz = 5 ± 1 mV; 200 Hz = 4.85 ± 1 mV; Fig. 5B). Whereas low-frequency (1 Hz) stimulation did not lead to prolonged cessation of AP firing, a high-frequency stimulation (50 Hz,) efficiently altered AP firing patterns in GCs for >1 s (Fig. 5C). Average APF distribution (Fig. 5D) curves for 1 and 50 Hz illustrate the difference in LLH expression and its impact on the firing pattern of depolarized GCs. A high-frequency burst completely blocked APs (0.94 ± 0.13 s) and continued to alter the firing pattern up to 1.8 s after the last pulse (1 ± 0.13 s), whereas the 1 Hz train created relatively short period (0.4 ± 0.05 s) after each PP pulse when APs were effectively blocked.

LLH is frequency-dependent. A, Representative current-clamp single-trial trace of the firing pattern of a GC (Vm = −45 mV) when a train of 5 pulses (black arrows) was delivered to the PP at frequencies of 1 Hz (top) or 50 Hz (bottom). B, Summary graph showing differences in LLH amplitudes (mV) and durations (s) as the stimulation frequency varies from 1 to 200 Hz. Average amplitudes (absolute values, n = 8): 1 Hz = 2.53 ± 0.29; 2 Hz = 2.25 ± 0.38; 5 Hz = 3.19 ± 0.44; 10 Hz = 2.98 ± 0.46; 20 Hz = 3.6 ± 0.59; 50 Hz = 6.27 ± 0.77; 100 Hz = 5 ± 1; 200 Hz = 4.84 ± 1.08; Mean differences of amplitudes: 1 vs 50 Hz, p < 0.0001; 50 vs 100 Hz, p = 0.0560; Average durations (s): 1 Hz = 0.4 ± 0.05; 2 Hz = 0.64 ± 0.15; 5 Hz = 0.8 ± 0.12; 10 Hz = 0.67 ± 0.12; 20 Hz = 0.9 ± 0.15; 50 Hz = 1.1 ± 0.09; 100 Hz = 1.1 ± 0.26; 200 Hz = 0.9 ± 0.16; Mean differences of durations: 1 vs 50 Hz, p < 0.0001; 50 vs 100 Hz, p = 0.9711. C, Peristimulus time histogram of action potential firing over 15 trials during PP stimulation at 1 and 50 Hz (black arrows; red dotted line indicates start of stimulation). D, AP frequency distribution (50 ms bins) of GCs during PP stimulation at 1 Hz (n = 12) and 50 Hz (n = 22) showing higher efficiency in LLH induction when PP was stimulated with higher frequency train (1 Hz: 0.47 ± 0.069 s vs 50 Hz: 2.1 ± 0.226 s); single trials appear in light gray, mean distribution curve with SEM in red; non significant (ns): p > 0.05, difference was assumed; *: p < or = 0.05; **: p < or + 0.01; ***: p < or = 0.0001.
Next, we varied the number of stimuli in a high-frequency train (50 Hz) between 2 and 20 pulses. In a subset of GCs (n = 7) LLH was not induced following a two-pulse PP stimulation (Fig. 6A). In some GCs, a two-pulse stimulation resulted in slow IPSPs (6.2 ± 1 mV; 1.1 ± 0.11 s; Fig. 6A, B) and blocked APs (APF = 0.24 ± 0.05, n = 6; Fig. 6C). The amplitude and duration of IPSPs increased in parallel with the number of pulses in the train (3 pulses = 1.1 ± 0.14 s, 6.9 ± 1.3 mV; 5 pulses = 1.5 ± 0.12 s, 9.4 ± 1.1 mV; 10 pulses = 1.5 ± 0.19 s, 9.3 ± 1.6 mV; 20 pulses = 1.6 ± 0.27 s, 9.1 ± 1.5 mV; Fig. 6B). LLH induced by short trains of 10 pulses decreased APF in depolarized GCs for an extended period of time compared with trains of two pulses (0.8 ± 0.19 s, p = 0.0052; Fig. 6D). Overall these results suggest that LLH is an activity-dependent mechanism, depending both on frequency and number of stimuli in PP input.

LLH is activity-dependent. A, Representative current-clamp single-trial trace of the firing pattern of a GC (Vm = −45 mV) when PP is stimulated (black arrows) with either 2 pulses (top) or 10 pulses (bottom) at 50 Hz. B, Summary graph showing increases of LLH duration (s) and amplitude (mV) while increasing number of pulses in the stimulation train from 2 to 20. Mean durations (s), n = 11: 2 pulses = 1.1 ± 0.11; 3 pulses = 1.1 ± 0.14; 5 pulses = 1.45 ± 0.12; 10 pulses = 1.5 ± 0.19; 20 pulses = 1.6 ± 0.27; Mean differences of durations: 2 pulses vs 10 pulses, p = 0.0437; Mean amplitudes (absolute, mV): 2 pulses = 6.19 ± 1.04; 3 pulses = 6.9 ± 1.3; 5 pulses = 9.4 ± 1.1; 10 pulses = 9.3 ± 1.6; 20 pulses = 9.1 ± 1.5; Mean differences of amplitudes: 2 pulses vs 10 pulses, p = 0.1750. C, Peristimulus time histogram of firing of GCs over 10 trials, reveal that increasing the number of pulses in a fast train (50 Hz) from 2 (top) to 10 (bottom), increases the efficiency of the PP-induced hyperpolarization. D, AP frequency distribution of GCs (2 pulses, 1.7 ± 0.25 s, n = 20, 50 ms bin, normalized to number of trials per cell, single trials appear in light gray, average curve and SEM in red) reflecting a longer silence period when the PP received more pulses (10 pulses, 3 ± 0.32 s, n = 15; non significant (ns): p > 0.05, difference was assumed; *: p < or = 0.05; **: p < or + 0.01; ***: p < or = 0.0001.).
LLH is induced through synaptic activation of feedforward inhibition by the perforant path
Projections from the layer II MEC (MEC II) are the main excitatory drive in GCs. Excitatory entorhinal signals reach both principal and local GABAergic cells in the ML of the DG. That means the PP provides the GCs both excitation and inhibition through the FFI circuit. Thus, the activation of the FFI circuit is highly probable to be the source of GABA in LLH.
Many of the GABAergic cells that provide FFI to GCs are located in the ML of the DG, in close apposition to the stimulation electrode. This creates a significant risk of direct activation of the FFI network. To avoid this, we isolated PP input using an optogenetic approach. Young mice (P28–P32) were injected with AAV9-ChR2-mCherry under the CaMKII promoter, delivered in the EC. Three to 4 weeks after surgery, there was a strong expression of ChR2-mCherry at the site of injection and in EC projections in the hippocampus (Fig. 7A), and was confirmed in the PP by colabeling GC cell bodies post hoc (Fig. 7A). Functional specificity of ChR2 was further assessed by light stimuli delivered via LED optrode positioned over the ML. If LLH is the result of synaptic activation of FFI by PP neurotransmitter release, optogenetic stimulation of the PP should reproduce LLH in GCs. Indeed, stimulation of the PP (5 pulses of 2 ms at 50 Hz) resulted in LLH. In these conditions, the amplitude of the slow IPSP was smaller (4.48 ± 0.2 mV vs 16.14 ± 0.7 mV, p < 0.0001, n = 7) and shorter in duration compared with LLH induced via electrical stimulation (1.9 ± 0.16 s vs 1.21 ± 0.12 s, p = 0.0035, n = 7; Fig. 7B,C). This is in consistence with a fewer number of interneurons activated via optogenetic stimulation. Nonetheless, the LLH duration remained unusually prolonged in time. Similar to LLH from our previous experiments, the light-induced LLH altered the firing pattern of GCs as confirmed by a complete blockage of APs (0.29 ± 0.05 s; Fig. 7D). As a consequence, APFDT in the LLH time window was significantly lower than control and recovery (Ctrl = 0.04 ± 0.003, LLH = 0.009 ± 0.002, Recovery = 0.04 ± 0.004, p < 0.0001; Fig. 7E). These results confirm that LLH is induced by FFI circuit following synaptic activation via the PP.

LLH is induced through synaptic activation following specific PP stimulation. A, Confocal images of an acute slice of mouse hippocampus demonstrating expression of ChR2 in the EC and PP fibers (red), and calbindin staining showing cell bodies of GCs (green). Inset, Shows magnified (63×) image of EC fibers expressing ChR2-mCherry and innervating the DG. B, Representative current-clamp traces of a firing dentate granule cell (Vm = −45 mV) during optogenetic stimulation of the PP (5 pulses, 2 ms, 50 Hz) and a single-trial trace; inset zooms over synaptic LLH following activation of PP and disturbing the firing pattern. C, In GCs, optogenetic activation of PP terminals in the molecular layer results in LLH with similar duration (1.19 ± 0.071 s, n = 7) than observed with electrical stimulation (1.67 ± 0.14 s, n = 6; p = 0.0035). D, APFDT analysis of firing GCs shows that optogenetic stimulation of PP (n = 13; single trials appear in light gray and average distribution with SEM in red; black arrows indicate the stimulation time) recreates disruption of the firing pattern. E, Quantitative summary of APFDT analysis; AP frequency is significantly decreased during synaptic LLH (p < 0.0001, n = 13; non significant (ns): p > 0.05, difference was assumed; *: p < or = 0.05; **: p < or + 0.01; ***: p < or = 0.0001.).
LLH bursts restrain the firing time window in response to theta frequency activity of the same input and/or upcoming signals from other inputs
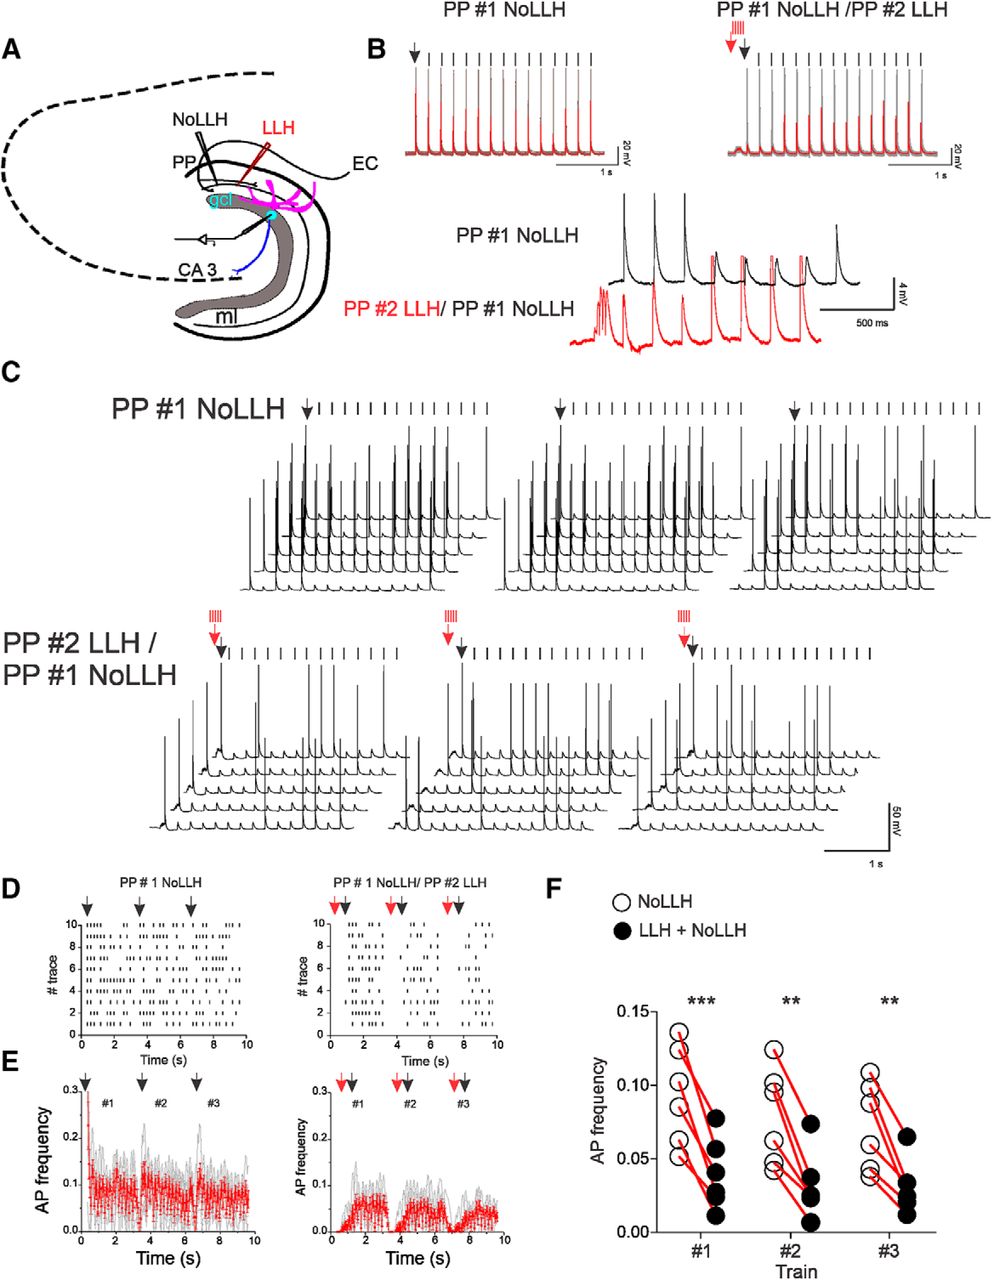
We next addressed the functional consequences of LLH in GCs. The potential of LLH to alter the firing pattern of GCs following PP stimulation correlate with some of the functional consequences of gamma/theta oscillations driven in DG by MEC II (Chrobak et al., 2000; Mizuseki et al., 2009). We built a new stimulation protocol based on data on double-oscillation interplay at the single-cell level (Hasselmo et al., 2007). We used the new protocol to stimulate EC terminals in ML (Fig. 8A); it allowed us to evaluate whether LLH gamma bursts would impact APs fired in response to PP theta activity in a similar way during membrane depolarization. This experiment included two different stimulation paradigms. First, we stimulated the PP with a single electrode positioned in the middle molecular layer as previously described. The stimulation protocol consisted of a train in the theta range (5 Hz) that did not induce LLH in the recorded cell (NoLLH; Fig. 8B, left). We repeated the NoLLH stimulation three times (3 trains, 3 s, 5 Hz) to compare LLH impact over each train and verify whether it remains persistent in time. The second stimulation pattern included a gamma burst (100 ms, 50 Hz) preceding (100 ms) each theta train. Gamma bursts induced LLH (2.5 ± 0.5 mV; 0.56 ± 0.06 s; n = 6) in GCs as shown earlier (LLH/NoLLH; Fig. 8B, right). Only 20% of the NoLLH pulses resulted in AP in GCs (2.840 ± 0.8 per train; Fig. 8C,D), and did not occur in regular sequences (Fig. 8C,D). APFDT analysis of each stimulation train showed a steady baseline firing in response to PP theta trains (0.05 ± 0.002; Fig. 8E). The addition of LLH bursts resulted in a decrease of the average AP number (1.3 ± 0.6 per train; Fig. 8C,D). This translates to a global decrease of APF (0.03 ± 0.003; p = 0.0024; Fig. 8E) and a significantly lower APF in each train (first train: NoLLH = 0.05 ± 0.01, LLH = 0.02 ± 0.01, p = 0.0004; second train: NoLLH = 0.04 ± 0.008, LLH = 0.02 ± 0.009, p = 0.0042; third train: NoLLH = 0.03 ± 0.006, LLH = 0.02 ± 0.008, p = 0.013; Fig. 8F). This confirms that LLH is able to inhibit AP firing in response to ongoing PP synaptic activity. It seems thus likely that a single input can use LLH to auto-scale repetitive excitatory signals to the DG.

Nested LLH bursts alter AP frequency distribution during single-input stimulation. A, Simplified schematic representation of the DG showing the stimulation pipette position in the ML during single-input experiments. B, Top left, Representative current-clamp traces of AP firing induced in a GC (subthreshold, Vm = −60 mV) by a single pipette 5 Hz train stimulation, NoLLH (3 s, 200 ms intervals between trains, 3 trains total); black arrows indicate the start of the stimulation and each EPSPs is indicated with a black line. Top right, Representative current-clamp traces (Vm = −60 mV) for LLH/NoLLH stimulation consisted of a 50 Hz bursts (5 pulses) preceding (200 ms) each NoLLH train; red arrow indicates the start of the burst, single pulses indicated by a red line; single trials appear in light gray and red overlay trace represents the average trace of 10 trials. Inset, The enlarged superposition of a NoLLH trace with a LLH/NoLLH trace from the same cell. Note that LLH prevented AP firing in the beginning of the NoLLH train. C, Representative current-clamp traces of a GC firing pattern of over time showing five trials for each NoLLH (black arrows indicates first pulse of stimulation and black lines indicate following EPSPs) alone and when coupled to LLH bursts (LLH/NoLLH; red arrows indicate first pulse and red lines indicate following EPSPs). Note the decrease of APs during LLH/NoLLH stimulation. D, Peristimulus time histogram of AP events in response to PP stimulation over 10 trials (black and red arrows indicate beginning of NoLLH 5 Hz and LLH/NoLLH stimulation, respectively). E, AP frequency distribution (50 ms bins, running average) of GCs during PP NoLLH and LLH/NoLLH stimulation (gray traces represent single cell and red traces represent global average AP frequency distribution, error bars represent SEM; n = 5). F, Top, Schematic representation of APFDT analysis. AP frequency was calculated for each train (3 s) and normalized to the number of trials for each cell during NoLLH and LLH/NoLLH stimulations. Graph below resumes the average AP frequency per train, showing an overall significant decrease when NoLLH is coupled to LLH bursts (average AP frequency per train: NoLLH first train = 0.047 ± 0.01; second train = 0.04 ± 0.007; third train = 0.03 ± 0.005; LLH first train = 0.02 ± 0.009; second train = 0.02 ± 0.009; third train = 0.02 ± 0.008; Mean difference: first train −0.023, p = 0.0004; second train = 0.019, p = 0.0042; third train = 0.02, p = 0.013; non significant (ns): p > 0.05, difference was assumed; *: p < or = 0.05; **: p < or = 0.01; ***: p < or = 0.0001.).
In the intact brain, the EC integrates simultaneously hundreds of signals that converge into the DG. Simultaneous and repetitive neurotransmitter release from many PP terminals are normally required for a GC to reach the firing threshold (Shu et al., 2006; Krueppel et al., 2011). Could LLH also have a significant impact on the firing pattern in a similar context where multiple inputs are arriving close in time? To reproduce the condition of a double input integration, we used two non-overlapping stimulation electrodes in the ML (Fig. 9A). One of the electrodes was used for theta stimulation of the PP (NoLLH, 3 trains of 15 pulses, 5 Hz, 200 ms intervals), while the second was delivering LLH bursts (3 trains of 5 pulses, 50 Hz) 100 ms before theta trains (LLH/NoLLH; Fig. 9B). Similar to single PP input experiments, LLH induced by the second input restrained neuronal discharge of GCs (NoLLH = 4 ± 0.9, LLH/NoLLH = 1.8 ± 0.7 per train; Fig. 9B–D). The average APF during LLH/NoLLH was significantly decreased as well (first train: NoLLH = 0.09 ± 0.01, LLH/NoLLH = 0.04 ± 0.006, p < 0.0001; second train: NoLLH = 0.08 ± 0.01, LLH/NoLLH = 0.03 ± 0.005, p = 0.0022; third train: NoLLH = 0.07 ± 0.01, NoLLH/LLH = 0.03 ± 0.004, p = 0.0022; Fig. 9E,F). Failure to induce APs was not because of a change in the NoLLH input strength as there were no significant changes in the paired-pulse ratio (2.028 ± 0.06708 vs 1.828 ± 0.07935; p = 0.1181). LLH narrowed the firing time window (2.07 ± 1.17 s), creating a more patterned response to the stimulation. This suggests that LLH modulates the time when GCs are in a more excitable state because of simultaneous stimuli, persistent activity, or previous activity. This type of interaction is a hallmark of theta-nested gamma oscillatory activity of spatial representation networks (Pastoll et al., 2013).

Single-input LLH can alter AP frequency distribution of other inputs. A, Simplified schematic representation of the DG showing the of the two stimulation pipettes in the ML during double-input experiments. B, Representative current-clamp traces (Vm = −60 mV) of firing GC during NoLLH input stimulation (5 Hz) and when coupled to the second, LLH input (50 Hz). Inset, Enlarged superposition of NoLLH and LLH input traces. Note the LLH drop induced by the second input bursts (50 Hz) causing loss of NoLLH spikes while it is active. C, Firing pattern of a GC during NoLLH (top) and LLH/NoLLH (bottom) stimulations over time showing that LLH consistently decreases AP fired in response to the initial PP stimulation (NoLLH). D, Peristimulus time histogram of AP events in response of PP stimulation over 10 trials shows decrease number of APs (NoLLH = 4 ± 0.9, LLH/NoLLH= 1.8 ± 0.7 per train, n = 6). E, AP frequency distribution per 5 Hz train (50 ms bins, running average, n = 6) during PP NoLLH and LLH/NoLLH stimulations. F, Quantification of AP frequency average values per train shows a significant decrease during double LLH/NoLLH input compared with NoLLH single-input stimulation (average AP frequency NoLLH: first train = 0.09 ± 0.01, second train = 0.08 ± 0.01, third train = 0.07 ± 0.01; LLH/NoLLH: first train = 0.04 ± 0.006, second train = 0.03 ± 0.005; third train = 0.03 ± 0.004; Mean of differences: first train −0.05405, p < 0.0001; second train −0.04702, p = 0.0022; third train −0.04075, p = 0.0022; non significant (ns): p > 0.05, difference was assumed; *: p < or = 0.05; **: p < or = 0.01; ***: p < or = 0.0001.).
Discussion
The presented results show evidence for a particularly prolonged slow IPSP in GCs. Subsequent to its activation by PP gamma bursts, LLH alters the firing pattern by preventing AP generation in response to concurrent excitation. Consequently, spike time windows are defined by its onset and decay. We found that LLH coincides with the maturation of GABAergic neurotransmission in mice. LLH is triggered by recruitment of FFI by EC terminals in the ML.
Mixed postsynaptic activation of GABAA/B-R and mGluR2 in GCs during high activity
We demonstrate that GABA release at the IN-GC synapse in the ML successfully activates both GABAA and GABAB-R. In addition to GABAergic inhibition, activation of mGluR2-mediated potassium conductance contributes to prolonged hyperpolarization. Although inhibition through postsynaptic mGluR2 selectively alters individual dendritic branches and only has a weak effect on total output (Brunner et al., 2013), the bulk activation we use possibly impinge on more than one dendritic branch, making it possible to be detected. The dendritic localization of mGluR2 suggests that they might be directly activated by glutamate release by the entorhinal terminals. Moreover, LLH is successfully induced via PP-specific optogenetic stimulation. This result argues in favor of PP as the origin of mGluR2 activation. The endogenous source of mGluR2 activation in GCs is not yet clear as most studies used indirect activation techniques (Brunner et al., 2013; Levitz et al., 2013). Apart from the PP (Deller et al., 1996a,b), other possible inputs that could activate mGluR2 receptors in the intact brain include the supramammillary nucleus (Maglóczky et al., 1994; Hashimotodani et al., 2018), hilar mossy cells (Buckmaster et al., 1996), and astrocytes (Jourdain et al., 2007). We cannot exclude the possibility that in vivo different pools of mGluR2 are activated by glutamate from distinct origins. One can speculate that this diversity of activating glutamate pools could be particularly useful for differential input integration in GCs. The occurrence of LLH is highly sensitive to afferent high intensity activity. What would be the physiological context allowing LLH and what could be expected as functional consequences of its activation? Gamma volleys are observed during hippocampal theta oscillations driven by the EC (Kahana et al., 1999; Chrobak et al., 2000; Mizuseki et al., 2009). Occurrences of nested gamma bursts during theta oscillations (Pastoll et al., 2013) create a favorable context for LLH expression. When LLH is activated, there is a decrease in the total number of APs fired in response to PP stimulation. Thus, the induction of LLH during ongoing theta activity can reduce the global amount of excitation in the DG (Hendrickson et al., 2015). The requirement for high-frequency repetitive stimulation for LLH also correlates with GABAB-R activation mechanisms (Piguet, 1993). GABA release from a single interneuron rarely reaches these receptors; additional recruitment of interneurons by stronger stimulation is generally needed (Thomson and Destexhe, 1999). This promotes GABA accumulation and the diffusion out of the synaptic cleft where it reaches the high affinity GABAB-Rs (Isaacson et al., 1993). Alternatively, GABAB-Rs of a given GC could be activated by GABA spillover from surrounding synapses on neighboring neurons (Scanziani, 2000) and/or by an increase of the readily releasable pool in some interneurons (Liu et al., 2014). Mixed GABAA/B-Rs postsynaptic responses are related to spike precision and information transfer at the DG–CA3 synapses in vivo (Zucca et al., 2017). It is thus likely that mixed GABA signaling at the EC–GC gateway plays similar roles.
Projecting interneurons from other hippocampal areas may also contribute to slow inhibition in GCs. A number of FBI neurons with cell bodies in the hilus project to the granule cell layer and the molecular layer (hilar perforant path-associated cells (HIPP) cells, hilar commissural associational path cells (HICAP) cells, Hilar basket cells; Han et al., 1993). On the other hand, the activation of FBI might also have a negative impact over LLH by inhibition of FFI interneurons in the molecular and GC layers.
Some neurons that project to two or more areas of the hippocampus can establish a functional link between hippocampal subregions (Overstreet-Wadiche and McBain, 2015). An interesting example is the neurogliaform cell that can mediate slow inhibition via GABAB-R activation in the postsynaptic cells (Price et al., 2008; Capogna and Pearce, 2011) and have been shown to project both in CA1 and DG (Overstreet-Wadiche and McBain, 2015).
It is important to highlight that many interneurons communicate and form interneuronal networks. It has been shown that FBI and FFI modulate different aspects of GC activity. For example, computational studies show that FFI scales the total amount of GC activity, whereas FBI contributes to the generation of high-frequency rhythmicity (Hendrickson et al., 2015). We show that LLH can modulate the APFDT in GCs, which relates well to the proposed functions of FFI as modulator of cell activity. Furthermore, LLH can impact GC input integration during concurrent signaling by creating low excitability time windows. On the other hand, LLH does not affect the GC spike threshold or GC excitability in the long-term. The efficiency of LLH over high-frequency epileptic-like activity bursts also remains to be explored. Thus, local and projecting GABAergic cells are most probably organized to control different aspects of GCs such as excitability, spike timing, spike synchrony, long- and short-term plasticity mechanisms. The final output of GCs is the result of the cooperative actions of the interneuron networks in the DG microcircuit.
LLH implications in single cells and in the DG microcircuit
The direct consequence of the prolonged hyperpolarization induced by FFI is the prevention of AP firing during ongoing activity. LLH only affects GC excitability on a short-term scale as the PP-EPSPs amplitudes remain unaltered after its decay.
At the single-cell level, LLH can shift the excitation/inhibition balance in GCs by imposing prolonged periods of low excitability. This contributes to sparse activation and a gain of selectivity (Ferrante et al., 2009; Valero et al., 2017). Furthermore, the preferential burst-firing mode of GCs could be at least partially the result of the restrained neuronal firing (Csicsvari et al., 2003; Pernía-Andrade and Jonas, 2014) that we observe with LLH.
At the circuit level, short-term plasticity (STP) alterations can regulate spike timing precision (Khalil et al., 2017). LLH can do that by changing the dynamics of AP occurrence in GCs. Single-input PP stimulation successfully induced simultaneous LLH only in subsets of GCs. We put forward a GC activation model that correlates with the proposed functions of STP and slow inhibition in cortical circuits (Ferrante et al., 2009; Valero et al., 2017). We suggest that input specificity in the DG is based on connectivity between PP inputs and FFI conjugated to selected pools of GCs. In this case, a single PP input would only induce firing in GCs that are not hyperpolarized by LLH. Activated GCs could then engage FBI and further prevent recruitment of additional GCs. This would create a pattern of selectively activated GCs while others are silenced. After the decay of LLH, previously silenced GCs would be again available for activation. In the proposed model, an occurrence of LLH reports the current state of the cell as a function of its previous activity. Most importantly, the context needed for LLH expression match the EC activity during memory and spatial navigation tasks, where gamma bursts occur nested in theta oscillations (Vanderwolf, 1969; Fricke and Prince, 1984; Mody et al., 1992; Scharfman, 1992; Bragin et al., 1995; Nusser and Mody, 2002; Buzsáki, 2005; Colgin, 2013). Thus, LLH can occur in the range of physiological activity patterns where according to the proposed model, plays a role in signal selectivity and the sparse activation of GCs.
Delayed postnatal maturation of inhibitory circuits
We found differential LLH expression in juvenile mice and adults. LLH reaches full amplitude and duration 3–5 weeks postnatal. The use of primarily younger animals for acute slice preparations (Ting et al., 2018) may be one of the main reasons why LLH has been overlooked in electrophysiological studies. However, slow inhibition has been extensively studied in other hippocampal cells and GCs (Schwartzkroin, 1975; Alger and Nicoll, 1982; Rausche et al., 1989; Miles, 1990; Buhl et al., 1996; De Koninck and Mody, 1997; Thomson and Destexhe, 1999; Pouille and Scanziani, 2004; Lovett-Barron et al., 2012). In contrast to the described mechanisms, LLH can last for >1 s, and requires the activation of three postsynaptic components: GABAA/B-Rs and mGluR2. This mechanism is also highly input specific, suggesting that stimulation of the PP do not give rise to LLH in all GCs. Thus, an occasional occurrence of LLH might have been overlooked and taken as a solely GABAB-R mediated inhibition. Additionally, differences in the hippocampal isolation during dissection, as well as technical details such as the cutting blade angle, could contribute to preservation or loss of many of LLH inducing terminals.
The emergence of LLH matches a particularly active period of synaptogenesis as the juvenile mice are weaned and start exploring their environment; a process highly dependent on the hippocampus (Ainge and Langston, 2012). Meanwhile, GABA neurotransmission converts from depolarizing to hyperpolarizing effects (Ben-Ari et al., 1994; Rivera et al., 1999). Most of the ML-INs are born before the GCs undergo maturation changes. This maturation process endows the interneurons with faster and larger AP and increased repetitive firing (Holter et al., 2007). Additionally, during the first 2 weeks, there is much less selectivity in the GC recruitment in response to afferent stimulation with significantly less precise temporal tuning (Yu et al., 2013). The maturation of the DG microcircuit coincides with a gain of selectivity and suggests the existence of tightly scheduled cooperativity (Savanthrapadian et al., 2014) between EC-PP and local inhibition. In accordance with these data, LLH develops during this critical developmental period. The temporal correlation suggests that LLH is one of the mechanisms that allow GCs to achieve selective input integration. This is in agreement with rodent in vivo and behavioral data, confirming the emergence of neuronal representation of space within the hippocampus and EC, and the capacity to resolve complex spatial memory paradigms, delayed in postnatal development (Ainge and Langston, 2012).
In conclusion we propose that LLH is an example of how slow inhibition contributes to the regulation of spike time precision and input selectivity in the DG. These effects are mediated by the restrained neuronal firing and extended periods of low excitability imposed by a slow-decay IPSPs mediated by mixed GABAA/B-R activation. The FFI of the DG microcircuit is particularly involved in this mechanism and provides slow inhibitory cues allowing time for repolarization of the GC's membrane and lowering excitability during multiple input, high-intensity activity at the entorhino–hippocampal gateway.
Footnotes
This work was supported by CIHR Operating Grant to K.T.
The authors declare no competing financial interests.
- Correspondence should be addressed to Katalin Tóth at katalin.toth{at}fmed.ulaval.ca


