

Abstract
The actin cytoskeleton is crucial for neuronal migration in the mammalian developing cerebral cortex. The adaptor protein Drebrin-like (Dbnl) plays important roles in reorganization of the actin cytoskeleton, dendrite formation, and endocytosis by interacting with F-actin, cobl, and dynamin. Although Dbnl is known to be expressed in the brain, the functions of this molecule during brain development are largely unknown. In this study, to examine the roles of Dbnl in the developing cerebral cortex, we conducted experiments using mice of both sexes with knockdown of Dbnl, effected by in utero electroporation, in the migrating neurons of the embryonic cortex. Time-lapse imaging of the Dbnl-knockdown neurons revealed that the presence of Dbnl is a prerequisite for appropriate formation of processes in the multipolar neurons in the multipolar cell accumulation zone or the deep part of the subventricular zone, and for neuronal polarization and entry into the cortical plate. We found that Dbnl knockdown decreased the amount of N-cadherin protein expressed on the plasma membrane of the cortical neurons. The defect in neuronal migration caused by Dbnl knockdown was rescued by moderate overexpression of N-cadherin and αN-catenin or by transfection of the phospho-mimic form (Y337E, Y347E), but not the phospho-resistant form (Y337F, Y347F), of Dbnl. These results suggest that Dbnl controls neuronal migration, neuronal multipolar morphology, and cell polarity in the developing cerebral cortex via regulating N-cadherin expression.
SIGNIFICANCE STATEMENT Disruption of neuronal migration can cause neuronal disorders, such as lissencephaly and subcortical band heterotopia. During cerebral cortical development, the actin cytoskeleton plays a key role in neuronal migration; however, the mechanisms of regulation of neuronal migration by the actin cytoskeleton still remain unclear. Herein, we report that the novel protein Dbnl, an actin-binding protein, controls multiple events during neuronal migration in the developing mouse cerebral cortex. We also showed that this regulation is mediated by phosphorylation of Dbnl at tyrosine residues 337 and 347 and αN-catenin/N-cadherin, suggesting that the Dbnl-αN-catenin/N-cadherin pathway is important for neuronal migration in the developing cortex.
Introduction
In the developing mammalian cerebral cortex, projection neurons are generated in the ventricular zone (VZ) or subventricular zone (SVZ), and many of these then sojourn to the multipolar cell accumulation zone (MAZ), which overlaps with the deeper part of the SVZ (Tabata and Nakajima, 2003; Noctor et al., 2004; Tabata et al., 2009). In this zone, the neurons assume multipolar morphologies and exhibit dynamic elongation and retraction of their multiple thin processes (multipolar migration) (Tabata and Nakajima, 2003; Noctor et al., 2004). Subsequently, the multipolar cells transform into bipolar cells and start to migrate along with the radial glial fibers through the intermediate zone (IZ) to the cortical plate (CP) (locomotion mode) (Rakic, 1972; Nadarajah et al., 2001). Finally, when the locomoting neurons reach the primitive cortical zone (PCZ), the outermost region of the CP beneath the marginal zone (MZ) (Sekine et al., 2011), they quickly move their somata to just beneath the MZ, through shortening of their leading processes, while retaining contact with the MZ at their tip (terminal translocation mode), to complete their migration (Nadarajah et al., 2001; Franco et al., 2011; Sekine et al., 2011, 2012).
Actin-associated proteins play important roles in neuronal migration by regulating the polymerization and depolymerization of actin. The actin-depolymerizing factor homology (ADF-H) domain is crucial for actin dynamics (Vartiainen et al., 2002; Goroncy et al., 2009). This domain is present in three phylogenetically distinct classes of actin-binding proteins: the ADF/cofilins, the twinfilins, and the Abp1/drebrins (Lappalainen et al., 1998). Drebrin-like, a member of the Abp1/drebrins family (Dbnl; also referred to as mAbp1, HIP-55, or SH3P7) contains the ADF-H domain, a proline-rich region, and the SH3 domain (Larbolette et al., 1999) (see Fig. 2I). Dbnl plays important roles in reorganization of the actin cytoskeleton, endocytosis, and dendrite formation by interacting with F-actin, Dynamin, and Cobl (Kessels et al., 2000, 2001; Haag et al., 2012). Furthermore, the phosphorylation of Dbnl by Src kinase at tyrosine residues 337 and 347 in the proline-rich region of this protein is critical for the function (Boateng et al., 2012). While Dbnl is known to be expressed in the brain (Larbolette et al., 1999), the roles of this protein during cortical development still remain unclear.
During cortical development, the Src family kinases (SFKs), which are nonreceptor protein tyrosine kinases, play important roles in many cellular events, such as cell growth, differentiation, adhesion, and migration (Stein et al., 1994; Nam et al., 2005). Although Src, Fyn, and Yes, all members of the SFKs, have been detected in the mammalian developing brain (Cotton and Brugge, 1983; Martinez et al., 1987; Sudol et al., 1988; Cooke and Perlmutter, 1989), Src- and Yes-knock-out mice have been found not to exhibit any serious defects during cortical development (Soriano et al., 1991; Stein et al., 1994). In contrast, deletion of Fyn kinase in the mouse brain has been shown to lead to defective cortical development. For example, Fyn-knock-out mice show abnormal dendritic morphology, misorientation of the cortical pyramidal neurons in layer V (Sasaki et al., 2002), and dislocation of later-generated cortical neurons (Yuasa et al., 2004). These findings suggest that Fyn, among the SFKs, plays the dominant role in the developing cerebral cortex and is essential for the formation of a normal brain architecture. However, the molecular mechanisms underlying the actions of Fyn in the developing neocortex are not yet fully understood.
In this study, we demonstrated that Dbnl is required for neuronal radial migration, neuronal process formation during multipolar migration, and polarization of migrating neurons in the MAZ/SVZ and IZ. The function of Dbnl in regulating neuronal migration is dependent on phosphorylation of Dbnl at tyrosine residues 337 and 347. Dbnl upregulates the amount of N-cadherin protein expressed on the neuronal plasma membrane, which is essential for neuronal migration in the developing cerebral cortex.
Materials and Methods
Animals.
Pregnant ICR mice were purchased from Japan SLC. All animal experiments were implemented under the oversight of the Keio University Institutional Animal Care and Use Committee, in compliance with the Institutional Guidelines on Animal Experimentation at Keio University. The day of vaginal plug detection was identified as embryonic day 0 (E0). “E14.0” refers to the morning of embryonic day 14, and “E14.5” refers to the afternoon of embryonic day 14. Mice of both sexes were used in this study.
Construction of plasmids.
The pCAGGS-EGFP plasmid was constructed by inserting the EGFP cDNA into the pCAGGS vector (Niwa et al., 1991).
Gene knockdown (KD) was accomplished by RNA interference using the pSilencer 3.0-H1 vector (Ambion) containing the H1 RNA promoter for the expression of a short hairpin RNA (shRNA). The shRNA target sense sequences for Dbnl were as follows: 5′-gatccGCAGAAGCAACTCACTCAAttcaagagaTTGAGTGAGTTGCTTCTGCttttttggaaa-3′, and 5′-gatccGCAGAAGCAACTCACTCAAttcaagagaTTGAGTGAGTTGCTTCTGCttttttggaaa-3′.
For amplifying the Dbnl cDNA by PCR, we used the following primers and template: forward primer, containing an EcoRI site: 5′-gcacagaattc gccaccatggcggtgaacctg-3′; reverse primer, containing a NotI site: 5′-ttgcggccgc tcactctatgagctccacgtagttg-3′; and template: a FANTOM RIKEN full-length cDNA clone (AK146920). For effecting expression of Dbnl, the PCR product was subcloned into the pCAGGS vector.
The vector expressing a resistant form of Dbnl cDNA against the Dbnl-KD vector (pCAGGS-Dbnl resist) was generated with 3 point mutations by PCR. The primers used were as follows: sense primer: ccttcctgcaggagcaattccctcaaccagaaac; antisense primer: gtttctggttgagggaattgctcctgcaggaagg (bold letters denote the mutated nucleotides).
The phospho-resistant mutant form of Dbnl at Y337 and/or Y347 (Dbnl Y337F, Y347F, or 2F) was generated by PCR using the cDNA encoding Dbnl-resist as the template. The primers used were as follows: sense primer for Y337F, caggaggccttcgtgcgcgtagtcaccgagaaatc; antisense primer for Y337F, gatttctcggtgactacgcgcacgaaggcctcctg; sense primer for Y347F, cgtgagcagcgcttccaggaacagcac; and antisense primer for Y347F, gtgctgttcctggaagcgctgctcacg (bold letters denote the mutated nucleotides).
The phospho-mimic form of Dbnl with substitution of the Y337 and Y347 residues with glutamic acid (Dbnl 2E) was commercially synthesized by Integrated DNA Technologies (bold letters denote the mutated nucleotides) (gaattcgccaccatggcggtg … gaacctacagaagaagtacccccagagcaggacaccctcgaagaggaacca … ctcatagagtgagcggccgc). The cDNA was subcloned into the pCAGGS vector (pCAGGS-Dbnl 2E). The FLAG-tagged Dbnl, Dbnl Y337F, Dbnl Y347F, or Dbnl 2F was subcloned into the pCAGGS vector (pCAGGS-Dbnl-FLAG, pCAGGS-Dbnl Y337F-FLAG, pCAGGS-Dbnl Y347F-FLAG, and pCAGGS-Dbnl 2F-FLAG, respectively).
The pCALNL-EGFP plasmid was generated by subcloning EGFP cDNA into the pCALNL vector purchased from Addgene (plasmid 13769) (Matsuda and Cepko, 2007).
The pCAGGS-M-cre was described previously (Kitazawa et al., 2014).
Construction of both pCAGGS-Fyn constitutive active (CA) (the Y531 residue was substituted with phenylalanine) and the pCAGGS-Fyn kinase-dead (the K299 residue was substituted with methionine) has been described previously (Honda and Nakajima, 2006).
The cDNA for αN-catenin (Ctnna2) was amplified by PCR using a cDNA library of mouse postnatal day (P) 0 brain as the template, which was synthesized using the Superscript III First-Strand Synthesis System (Thermo Fisher Scientific). The following primers were used for the PCRs: 5′-CGCTCGAGGCCACCATGACTTCGGCAACTTCACC-3′ (5′-XhoI-Ctnna2-3′) and 5′-GCGGCGGCCGCCTAGAAGGAATCCATTGCCTTG-3′ (5′-NotI-Ctnna2-3′). The cDNA was subcloned into the pCAGGS vector.
The WT full-length mouse N-cadherin cDNA [kindly provided by Prof. Huganir (Nuriya and Huganir, 2006)] with an HA tag at its C terminus was subcloned into the pCAGGS1 vector (pCAGGS-N-cadherin-HA).
These cDNAs were verified by DNA sequencing, and the protein products were confirmed by Western blot analysis.
In utero electroporation.
Pregnant ICR mice were deeply anesthetized with pentobarbital sodium (Kyoritsu Seiyaku) administered by intraperitoneal injection, and their intrauterine embryos were surgically manipulated as described previously (Nakajima et al., 1997; Tabata and Nakajima, 2001, 2008). The conditions for the electronic pulses were as follows: 34 V, 50 ms, four times using an electroporator (CUY21; Nepagene). For the sparse labeling, we cotransfected pCALNL-EGFP and pCAGGS-M-cre (Kitazawa et al., 2014). Details of the plasmid DNA concentrations for electroporation are described in Table 1.
Details of the plasmid DNA concentrations
In vitro electroporation.
ICR mouse cortices at E16 were dissected in HBSS, and the cortical cells were dissociated with Papain (Nakalai Tesque). In vitro electroporation was performed using the dissociated cells at a density of 1 × 10⁷ cells per milliliter in Opti-MEM (Opti-MEM I Reduced Serum Medium, Thermo Fisher Scientific) with an electroporator (NEPA21; Nepagene), under the following conditions: porting pulse; 275 V, 0.5 ms length, 50 ms interval, 2×, 10 decay rate; transfer pulse; 20 V, 50 ms length, 50 ms interval, 5×, 40 decay rate. After the electroporation, the cells were seeded on to 60 mm dishes in Neurobasal medium containing 10% FBS, and incubated at 37°C in 5% CO2 for 2 h. Then, the medium was replaced with Neurobasal medium containing 3% B27 and 0.4 mm l-glutamine, and the dishes were incubated at 37°C in a humidified 5% CO2 atmosphere for 2 d.
Antibodies.
The anti-Dbnl antibody used for the study (catalog #13015-1-AP, rabbit) was purchased from Proteintech, the anti-Unc5D antibody (catalog #AF1429, goat) from R&D Systems, the anti-GAPDH antibody (catalog #5174, rabbit) from Cell Signaling Technology, and the antibody directed against GM130 (catalog #610822, mouse), and anti-phospho-tyrosine antibody conjugated with HRP (PY20, catalog #610012, mouse) from BD Biosciences; the antibodies used against FLAG (catalog #F3165, mouse; catalog #F7425, rabbit) were purchased from Sigma-Aldrich. The anti-N-cadherin antibody (guinea pig) was kindly provided by Prof. Sakagami (Hara et al., 2016).
Preparation of frozen sections and immunohistochemistry.
The embryos and neonates were placed on ice for anesthesia and perfused with 4% PFA in a 0.1 m sodium phosphate buffer, pH 7.4. Subsequently, the embryonic brains were removed and postfixed in the same fixative for 12 h at 4°C. The brains were frozen in OTC compound (Sakura Finetek) and cut into 20-μm-thick sections with a cryostat (CM3050 S, Leica Microsystems). The sections were washed 3 times with PBS containing 0.01% Triton X-100 (PBS-Tx), then blocked with 10% normal donkey serum in PBS-Tx at room temperature for 1 h. The sections were incubated with the primary antibodies overnight at 4°C, then washed 3 times with PBS-Tx and incubated with anti-IgG conjugated with AlexaFlour-594 (Thermo Fisher Scientific) at room temperature for 1 h. Then, DAPI (1:500) was used to stain the nuclei. Images of the immunostained sections were taken under a confocal microscope (FV1000, Olympus; or SP8, Leica Microsystems). The primary antibodies used were a mouse anti-GM130 (1:1000, BD Biosciences) and a rabbit anti-Dbnl (1:500, Proteintech). Before being stained with GM130, the sections were incubated for 20 min in HistoVT One (Nakalai Tesque) at 70°C.
Cell culture, transfection, and Western blot analysis.
HEK293T cells were cultured in DMEM containing 100 U/ml penicillin and 100 μg/ml streptomycin supplemented with 10% FBS in a humidified 5% CO2 atmosphere at 37°C. HEK293T cells were transfected with the plasmids using GeneJuice (Merck Millipore). After the cells were cultured for 48–72 h, the cells were lysed with a cell lysis buffer (50 mm Tris-HCl, pH 7.5, 150 mm NaCl, 1% NP-40, 0.3% Triton X-100, PhosSTOP Phosphatase Inhibitor Cocktail [Roche], and Complete Protease Inhibitor Cocktail [Roche]). The lysates were collected with a cell scraper, rotated for 30 min at 4°C, sonicated, and solubilized with an SDS sample buffer (100 mm Tris-HCl, pH 6.8, 20% glycerol, 4% SDS, 0.005% bromophenol blue, and 200 mm dithiothreitol). After solubilized materials were boiled for 3 min at 96°C, they were subjected to SDS-PAGE (4%–15% acrylamide gel, Bio-Rad). Then, the gel was transferred on to a PVDF membrane using iBlot (Thermo Fisher Scientific). The blot was treated with a blocking buffer (PBS-Tw; 5% BSA in PBS containing 0.05% Tween 20) for 1 h at room temperature, then incubated overnight at 4°C with a primary antibody, followed by incubation with a secondary antibody for 1 h. Finally, the blot was treated with ECL Plus Western blotting detection reagents (GE Healthcare). The signals were detected with a CCD camera (LAS-4000mini; Fujifilm). The primary antibodies used were a rabbit anti-Dbnl (1:1000, Proteintech), a rabbit anti-GAPDH (1:1000, Cell Signaling Technology), a rabbit anti-FLAG (1:1000, Sigma-Aldrich), a mouse anti-FLAG (1:1000, Sigma-Aldrich), and a mouse anti-phospho-tyrosine conjugated with HRP (PY-20; 1:1000, BD Biosciences). The secondary antibodies used were an anti-rabbit IgG conjugated with HRP, an anti-mouse IgG conjugated with HRP, or an anti-rat IgG conjugated with HRP (1:1000, Jackson ImmunoResearch Laboratories). In the case that the host of a primary antibody for Western blotting was the same as that of the antibody used for the immunoprecipitation assay, the TidyBlot Western blot detection reagent (1:200, Bio-Rad) was used instead of the secondary antibody to exclude the detection of IgG for immunoprecipitation.
Time-lapse imaging.
The time-lapse imaging was performed as described previously, with slight modifications (Tabata and Nakajima, 2003; Kitazawa et al., 2014). Briefly, in utero electroporation was performed with pCAGGS-EGFP plus either the pSilencer-Dbnl shRNA or pSilencer-control into the ICR mouse cortex at E14.5. Then, 1.5 d later, coronal brain slices (250 μm thickness) from the middle of three splits of the forebrain mounted in a low melting temperature agarose were cut with a vibratome (VT 1000S, Leica Microsystems). The slices were placed on a Millicell-CM membrane (pore size: 0.4 μm, Millipore) set on a glass base dish (AGC Techno Glass) and cultured in Neurobasal medium (Thermo Fisher Scientific) containing 2% B27 (Thermo Fisher Scientific), 10% FBS, and 500 μm l-glutamine (Thermo Fisher Scientific). Then, the dishes were placed in a 40% O2 incubator chamber (Tokai Hit) fitted onto a confocal microscope (SP8, Leica Microsystems). Then, 10–15 optical Z-section images were acquired at ∼10 min intervals, and the focal planes were merged.
Immunoprecipitation assay.
Cells were lysed with a cell lysis buffer (50 mm Tris-HCl, pH 7.5, 150 mm NaCl, 1% NP-40, 0.3% Triton X-100, PhosSTOP Phosphatase Inhibitor Cocktail [Roche Diagnostic], and Complete Protease Inhibitor Cocktail [Roche Diagnostic]), and collected with a cell scraper. After being rotated for 30 min at 4°C, the lysates were sonicated and a protein assay was performed. Equal amount of protein was used for the immunoprecipitation assay using Dynabeads protein G (Thermo Fisher Scientific). The antibodies used were a rabbit anti-Dbnl (1:100, Proteintech) and a mouse anti-FLAG (1:200, Sigma-Aldrich). After the sample was washed 3 times with the cell lysis buffer, it was dissociated with an SDS sample buffer. Then, after the solubilized materials were boiled for 3 min at 96°C, they were subjected to SDS-PAGE (4%–15% acrylamide gel, Bio-Rad).
Membrane N-cadherin assay.
E16 cerebral cortices were dissected and incubated in warm PBS (37°C) for 15 min and dissociated mechanically by pipetting. Then, the cells were transfected with a Dbnl-KD vector using an electroporator (NEPA21; Nepagene). The dissociated cells were plated onto a 12-well plate coated with poly-L-lysine (0.1 mg/ml, Sigma-Aldrich). Two days later, the cultured neurons were washed twice with warm DMEM, and N-cadherin antibody (guinea pig, 2 μg/ml in DMEM) was applied to the plate, followed by incubation for 15 min at 37°C. After being washed 3 times with warm DMEM, the cells were lysed in an SDS sample buffer. Bound N-cadherin antibodies were detected using an anti-guinea-pig IgG H&L (HRP) (1:1000, Jackson ImmunoResearch). Signals of membrane-localized N-cadherin were normalized to the signals of GAPDH.
Quantification and statistical analyses.
For the microscopic examinations, images were obtained by using the FLUOVIEW FV1000 confocal microscope (Olympus). To analyze the distributions of the EGFP-labeled neurons in the cortex, the distance from the ventricular surface to the top of the CP (D1) and the distance from the ventricular surface to the EGFP-positive neurons (D2) were measured using the ImageJ software, and the relative bin position was calculated by dividing D2 by D1. Quantitative analyses of the cellular morphology and Western blots were performed using ImageJ software. All numerical data are indicated as mean ± SEM. When comparing two groups, the Student's t test was performed, provided that neither normality nor homogeneity of variances of the dataset was rejected by the Shapiro–Wilk normality test and Levene's test, respectively. In cases where normality of the data was rejected, the Mann–Whitney U test was used as a nonparametric test. When comparing multiple groups, normality of the data was verified by the Shapiro–Wilk test, and homogeneity of variances among all groups was tested by Levene's test. When there was no rejection of either the normality or homogeneity of the variance of the datasets to be analyzed, ANOVA followed by the Tukey–Kramer test was performed. In all statistical tests above, the α value was set at 0.05.
Results
Dbnl is expressed in the developing mouse cerebral cortex
To investigate whether Dbnl is expressed in the developing mouse cerebral cortex, we performed immunohistochemistry using brain sections at E16.5 and P0.5. Dbnl was detected throughout the neocortex, preferentially in the MZ and MAZ/SVZ at E16.5 (Fig. 1A–A‴). Dbnl was also detected at P0.5 (Fig. 1B,B′). These results suggest that Dbnl plays important roles during cortical development.

Dbnl is expressed in the developing mouse cerebral cortex. A, B, Immunohistochemical staining for Dbnl (green), Unc5D (magenta) as a marker for the MAZ/SVZ (A‴), and DAPI (blue) using sections from the cerebral cortex at E16.5 (A–A‴) and P0.5 (B, B′) of the ICR mouse. Scale bars, 100 μm.
Dbnl-KD neurons show defects in neuronal migration during cortical development
To examine whether Dbnl is required for neuronal migration in the mouse cortex, we constructed a Dbnl-KD vector, which significantly decreased the expression level of exogenous mouse Dbnl in HEK293T cells [Dbnl WT plus pSilencer-Dbnl (1): 0.046 ± 0.012; Dbnl WT plus pSilencer3.0; (2): 1.00 ± 0.00; KD-resistant Dbnl plus pSilencer-Dbnl; (3): 1.20 ± 0.25; KD-resistant Dbnl plus pSilencer3.0; (4): 0.91 ± 0.16; N = 3 experiments; (1) vs (2): p = 4.20 × 10⁻¹⁰; Figure 2A,B], as well as that of endogenous Dbnl in primary cultures of cortical neurons (pSilencer3.0: 1.00 ± 0.00; pSilencer-Dbnl: 0.45 ± 0.12, N = 3 experiments, p = 0.023; Fig. 2C,D). This Dbnl-KD vector was introduced with an EGFP-expression vector into the VZ cells of the mouse cerebral cortex at E14.5 by in utero electroporation. At E17.5, both the control (N = 10 brains) and Dbnl-KD neurons (N = 4 brains) were found to be mainly located in the MAZ/SVZ and IZ, with no obvious differences in position between the two (Fig. 2E,F). On the other hand, at E18.5, by which time the majority of the control neurons (N = 7 brains) had entered the CP and reached beneath the MZ, many Dbnl-KD neurons (N = 8 brains) were still found in the MAZ/SVZ and IZ (control vs Dbnl KD, bin 3: p = 0.001; bin 10: p = 0.009; Fig. 2G,H). Indeed, at P0.5, most Dbnl-KD neurons (N = 5 brains) still stayed in the SVZ and IZ (Fig. 2L–N). The Dbnl-KD phenotype was rescued by coexpression with a KD-resistant form of Dbnl at a low concentration (0.5 μg/μl) (control: N = 5 brains; Dbnl KD + KD-resistant Dbnl: N = 5 brains) (bin3: control vs Dbnl KD, p < 0.001; Dbnl KD + KD-resistant Dbnl vs Dbnl KD, p = 0.028; bin 10: control vs Dbnl KD, p < 0.001; Fig. 2L–O). We confirmed that overexpression of the KD-resistant form of Dbnl at this concentration (0.5 μg/μl) had no effect on neuronal migration at this stage (data not shown).

Dbnl controls neuronal migration in the MAZ/SVZ and IZ. A, KD of Dbnl by the pSilencer-Dbnl shRNA. The pSilencer-Dbnl shRNA with the pCAGGS-Dbnl-WT or -resist, which was a KD resistant form of Dbnl, was transfected into the HEK293T cells (N = 3 experiments). The cell lysates were subjected to Western blotting for Dbnl, with GAPDH measured as the internal control. B, A normalized graph represents the Dbnl/GAPDH ratio (A) (N = 3 experiments). C, pSilencer-Dbnl shRNA or the empty vector was introduced into the primary culture of cortical neurons. The cell lysates were subjected to Western blotting for Dbnl, with GAPDH measured as the internal control. D, A normalized graph represents the Dbnl/GAPDH ratio (C) (N = 3 experiments). E, G, Effects of Dbnl KD on the migration of cortical neurons. In utero electroporation of the mouse embryonic brains at E14.5 with Dbnl-shRNA plus pCAGGS-EGFP, or the pSilencer-control vector plus pCAGGS-EGFP, as control, was performed. There were no obvious differences in position between the control and Dbnl KD neurons at E17.5 (E; Control: N = 10 brains; Dbnl KD: N = 4 brains), whereas Dbnl KD suppressed migration of the cortical neurons at 4 d after transfection (G; Control, N = 7 brains; Dbnl KD, N = 8 brains). F, H, Graphs represent proportion of EGFP-positive cells in each bin. White bar represents Control. Black bar represents Dbnl KD. The entire cortex in the image was divided into 10 equally spaced bins (bin 1, deepest; bin 10, most superficial). Statistically significant differences were observed in bin 3 (Control vs Dbnl KD, **p = 0.001) and bin 10 (Control vs Dbnl KD, **p = 0.009) (H). I, Domain structure of Dbnl. Arrowheads on the sequence indicate Y337 and Y347 (green letters), which are the residues phosphorylated by Fyn. Dbnl 2F indicates the Dbnl mutant in which the tyrosine residues Y337 and Y347 were substituted with phenylalanine (magenta letters). J, Y337 and Y347 residues of Dbnl are important for the tyrosine residues phosphorylated by Fyn. Fyn [a constitutively active (CA) or kinase-dead] and Dbnl (WT, Y337F, Y347F, or 2F)-Flag were exogenously coexpressed in the HEK293T cells, and samples immunoprecipitated with the anti-FLAG antibody were subjected to Western blotting with anti-PY20 and FLAG antibodies, while the input was blotted with anti-FLAG and GAPDH antibodies. K, A normalized graph represents the PY20/FLAG ratio (J) (N = 6 experiments). L, Mouse embryonic brains at E14.5 were electroporated with Dbnl KD plus either pCAGGS-1 (N = 5 brains), pCAGGS-Dbnl-resist (N = 5 brains), pCAGGS-Dbnl 2F (N = 4 brains), or pCAGGS-Dbnl 2E (N = 7 brains), together with pCAGGS-EGFP. The pSilencer-control vector plus pCAGGS-1 and pCAGGS-EGFP were transfected as control (N = 5 brains). The brains were fixed at P0.5 and sectioned. Each section was stained with DAPI. M, Graph represents the proportion of EGFP-positive cells in each bin. White bar represents Control. Black bar represents Dbnl KD. Gray bar represents Dbnl KD + resist [Dbnl rescue]. Orange bar represents Dbnl KD + 2F. Blue bar represents Dbnl KD + 2E. The entire cortex in each image was divided into 10 equally spaced bins (bin 1, deepest; bin 10, most superficial). Statistically significant differences were observed in bin 3 (Control vs Dbnl KD, ***p < 0.001; Control vs Dbnl 2F, *p < 0.001; Dbnl rescue vs Dbnl KD, *p = 0.028; Dbnl rescue vs Dbnl 2F, **p = 0.007; Dbnl 2E vs Dbnl KD, **p = 0.005; Dbnl 2E vs Dbnl 2F, *p = 0.01), bin 4 (Control vs Dbnl KD, *p = 0.037; Dbnl KD vs Dbnl rescue, *p = 0.022; Dbnl KD vs Dbnl 2E, *p = 0.034), bin 9 (Dbnl KD vs Dbnl 2E, *p = 0.038), and bin 10 (Control vs Dbnl KD, ***p < 0.001; Control vs Dbnl 2F, *p < 0.001; Control vs Dbnl 2E, **p = 0.007; Dbnl rescue vs Dbnl 2F, **p = 0.001). N, O, Graphs represent the proportion of EGFP-positive cells in bin 3 (N) and bin 10 (O). M, Different letters on the bars within the same bin indicate a statistically significant difference between the pair, whereas the same letter within the same bin or the absence of any letters within the bins indicates the absence of any statistically significant difference. Error bar indicates mean ± SEM. Student's t test, Mann–Whitney's U test, or one-way ANOVA with Tukey–Kramer test: *p < 0.05; **p < 0.01; ***p < 0.001. Scale bars, 50 μm.
This migration defect is not likely to represent a temporary delay of migration because many Dbnl-KD neurons were still located in the white matter (former IZ) at P2.5 (control: N = 7 brains; Dbnl KD: N = 5 brains; control vs Dbnl KD, bin 2: p = 0.003; bin 6: p = 0.048; bin 8: p = 0.048; bin 9: p = 0.01; bin 10: p = 0.019; Fig. 3A,B) and P5.5 (control: N = 6 brains; Dbnl KD: N = 4 brains; control vs Dbnl KD, bin 1: p = 0.004; bin 2: p = 0.004; bin 3: p = 0.004; bin 4: p = 0.03; bin 6: p = 0.03; bin 7: p = 0.03; bin 9: p = 0.004; Fig. 3C,D). These results indicate that Dbnl is required for neuronal migration in the MAZ/SVZ and IZ.

Dbnl controls the neuronal cell positioning after birth. A, C, Mouse embryonic brains at E14.5 were electroporated with Dbnl-KD and pCAGGS-EGFP, or pSilencer-control vector and pCAGGS-EGFP as a control, then fixed at P2.5 (A; control: N = 7 brains; Dbnl KD: N = 5 brains), or P5.5 (C; control: N = 6 brains; Dbnl KD: N = 4 brains). B, D, Graphs represent proportion of EGFP-positive cells in each bin. White bar represents Control. Black bar represents Dbnl KD. The entire cortex in the image was divided into 10 equally spaced bins (bin 1, deepest; bin 10, most superficial). Statistically significant differences were observed in bin 2 (Control vs Dbnl KD, **p = 0.003), bin 6 (Control vs Dbnl KD, *p = 0.048), bin 8 (Control vs Dbnl KD, *p = 0.048), bin 9 (Control vs Dbnl KD, **p = 0.010), bin 10 (Control vs Dbnl KD, *p = 0.018) (B), and bin 1 (Control vs Dbnl KD, **p = 0.004), bin 2 (Control vs Dbnl KD, **p = 0.004), bin 3 (Control vs Dbnl KD, **p = 0.004), bin 4 (Control vs Dbnl KD, *p = 0.03), bin 6 (Control vs Dbnl KD, *p = 0.03), bin 7 (Control vs Dbnl KD, *p = 0.03), and bin 9 (Control vs Dbnl KD, **p = 0.004) (D). Error bar indicates mean ± SEM. Student's t test or Mann–Whitney's U test: *p < 0.05; **p < 0.01. Scale bars, 50 μm.
Dbnl regulates the morphology of multipolar neurons
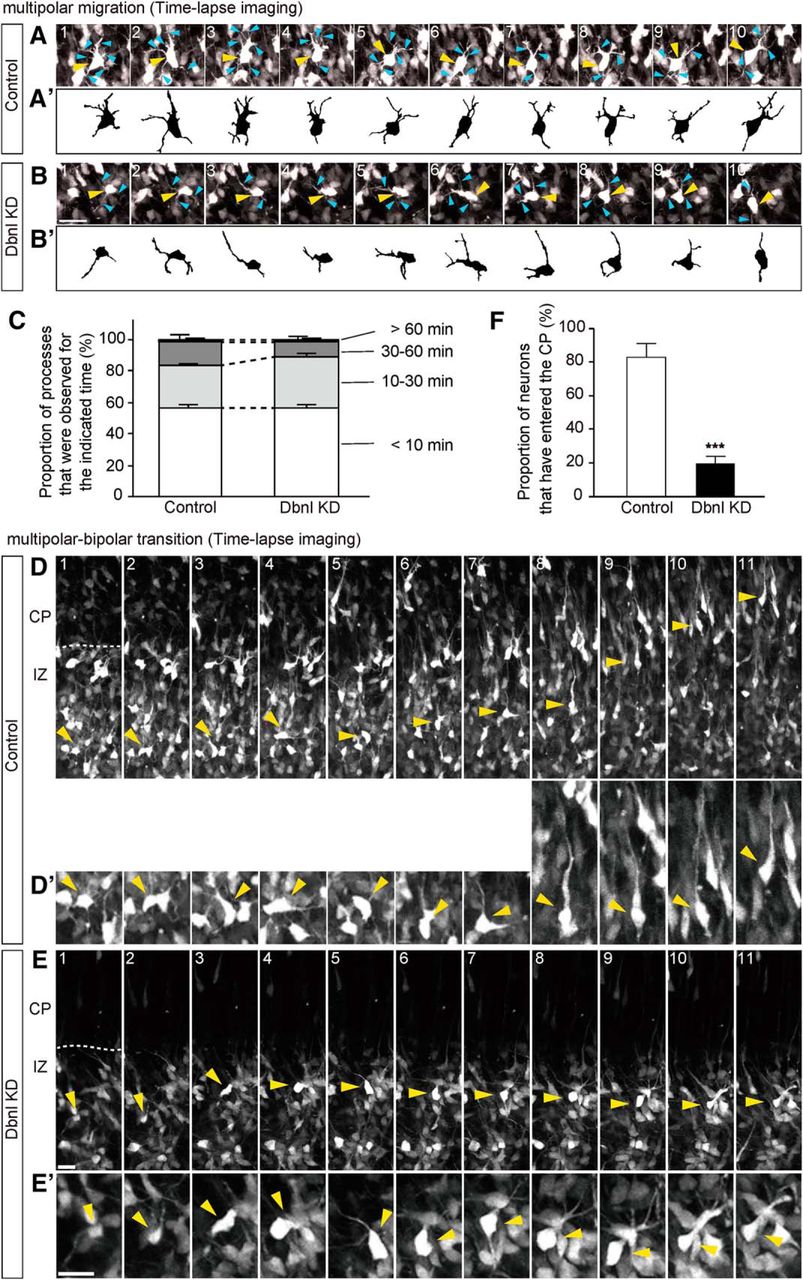
The accumulation of Dbnl-KD neurons in the IZ raised the possibility that Dbnl is required for multipolar-mode migration in the MAZ, or for transition from the multipolar to bipolar morphology beneath the CP. To observe the morphology of the Dbnl-KD neurons in the SVZ, neurons were transfected with a Dbnl KD vector by in utero electroporation with sparse labeling, which was achieved by introducing a combination of a plasmid encoding EGFP downstream of a floxed stop cassette (pCALNL-EGFP) (2.0 μg/μl) and a small amount of a Cre-expressing plasmid (pCAG-M-cre) (2.0 ng/μl) (Kitazawa et al., 2014). Two days after the electroporation, while the labeled neurons in control experiments (N = 4 brains) exhibited normal multipolar morphology with multiple thin processes in the MAZ (Fig. 4A,B), most of the Dbnl-KD neurons in this region showed poor formation of processes (N = 4 brains; Fig. 4A′,B′). Statistical analyses revealed a significantly reduced number of processes in the Dbnl-KD neurons compared with the control neurons (control: 3.75 ± 0.22, N = 4 brains, n = 10–15 neurons per brain were counted; Dbnl KD: 2.64 ± 0.34, N = 4 brains, n = 10–15 neurons per brain were counted; p = 0.0049; Fig. 4D). Furthermore, we conducted time-lapse imaging of multipolar cells in the MAZ to compare the cellular dynamics between the control and Dbnl-KD neurons (control experiments, N = 4 brains; Dbnl KD experiments, N = 4 brains) (Fig. 5A–B′; Movies 1, 2). The control multipolar cells exhibited dynamic elongation and retraction of multiple processes as reported previously (Tabata and Nakajima, 2003; Noctor et al., 2004; Tabata et al., 2009). The Dbnl-KD cells showed frequent elongations and retractions of their processes (proportion of processes that were retracted within 10 min for control neurons: 56.48 ± 1.79%, N = 4 brains, n = 3–5 neurons per brain, n = 8–20 processes per neuron; proportion of processes that were observed within 10 min for Dbnl-KD neurons: 56.26 ± 2.75%, N = 4 brains, n = 3–5 neurons per brain, n = 8–20 processes per neuron; p = 0.948; Fig. 5C). These results suggest that Dbnl regulates the formation of processes in the multipolar neurons in the MAZ.

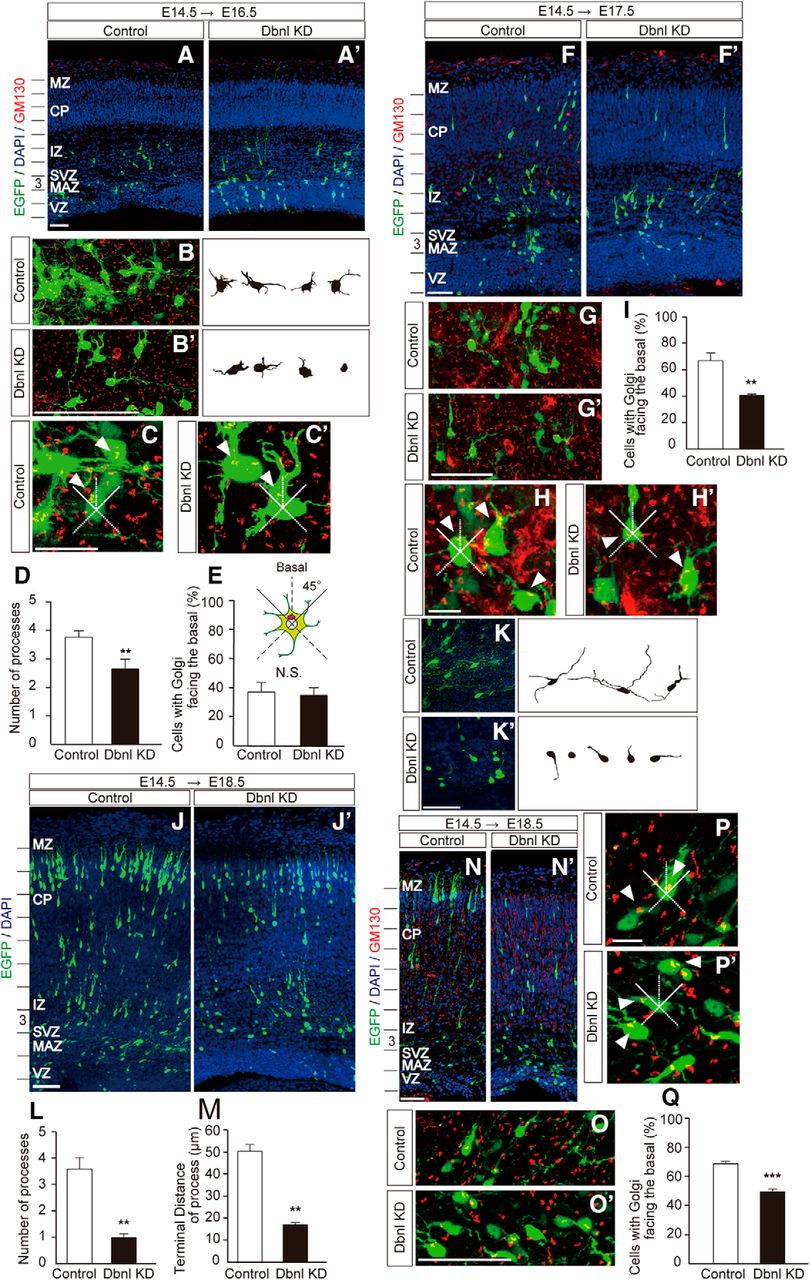
Dbnl is involved in the morphological alterations and polarization of neurons located in the MAZ/SVZ and IZ. A, A′, Mouse embryonic brains at E14.5 were electroporated with the control (A) or Dbnl-KD (A′) vector together with pCAGGS-M-cre plus pCALNL-EGFP as visualized by the sparse labeling method, then fixed at E16.5 (Control, N = 4 brains; Dbnl KD, N = 4 brains). The entire cortex in the image was divided into 10 equally spaced bins (bin 1, deepest; bin 10, most superficial). B, B′, Magnified images of the control (B) and Dbnl-KD neurons (B′) located in bin 3 of A and A′, and reconstructed shapes of the EGFP-positive neurons. C, C′, Magnified images of the control (C) and Dbnl-KD neurons (C′) located in bin 3 of A and A′. Arrowheads indicate the Golgi apparatuses of the EGFP-positive neurons. Scale bars, 10 μm. D, Quantitative comparison of the number of processes between the control neurons (B) and Dbnl-KD neurons (B′) (n = 10–15 neurons per brain were counted). E, Quantitative comparison of the proportion of cells with their Golgi apparatus facing the basal part of the CP between control neurons (B) and Dbnl-KD neurons (B′) (n = 30–50 neurons per brain were counted). F, F′, Staining of the neuronal Golgi apparatuses (red) of the control neurons (F) and Dbnl-KD neurons (F′) transfected with pCAGGS-M-cre plus pCALNL-EGFP at E14.5 and fixed at E17.5 (control, N = 3 brains; Dbnl KD, N = 3 brains). G, G′, Magnified images of each of the control (G) and Dbnl-KD neurons (G′) located in bin 3 of F and F′. H, H′, Magnified images of the control (H) and Dbnl-KD neurons (H′) located in bin 3 of F and F′. Arrowheads indicate the location of Golgi apparatuses of the EGFP-positive neurons. Scale bars, 10 μm. I, Quantitative analysis of the control and Dbnl-KD neurons with the Golgi apparatuses facing the basal part of the CP (n = 30–50 neurons per brain were counted). J, J′, Mouse embryonic brains were electroporated with pCAGGS-M-cre and pCALNL-EGFP with either the control (J) or Dbnl-KD (J′) vector at E14.5 and fixed at E18.5 (control: N = 4 brains; Dbnl KD: N = 3 brains). The entire cortex in each image was divided into 10 equally spaced bins (bin 1, deepest; bin 10, most superficial). K, K′, Magnified images of the control (K) and Dbnl-KD neurons (K′) located in bin 3 of J and J′, and reconstructed shapes of the EGFP-positive neurons in E18.5 cortices. L, M, Quantitative analyses of the number of processes elongating from the cell body (L), and the length of the processes (n = 10–15 neurons per brain were counted) (M) between the control (K) and Dbnl KD neurons (K′). N, N′, Staining of the Golgi apparatuses of the E14.5 mouse embryonic neurons electroporated with pCAGGS-M-cre plus pCALNL-EGFP together with the control (N) or Dbnl-KD (N′) plasmid (control: N = 3 brains; Dbnl KD: N = 3 brains). O, O′, Magnified images of the control (O) and Dbnl-KD neurons (O′) located in bin 3 of N and N′, respectively. P, P′, Magnified images of the control (P) and Dbnl-KD neurons (P′) located in bin 3 of N and N′. Arrowheads indicate the location of Golgi apparatuses of the EGFP-positive neurons. Scale bars, 10 μm. Q, Quantitative analysis of neurons with their Golgi apparatuses facing the basal part of the CP in the control (O) and Dbnl-KD neurons (O′) (n = 30–50 neurons per brain were counted). Error bar indicates mean ± SEM. Student's t test: **p < 0.01; ***p < 0.001. Scale bars, 50 μm.

KD of Dbnl in migrating neurons restrains the entry of the neurons into the CP. A, B, Time-lapse images of migrating multipolar cells. The EGFP plasmid with either the pSilencer-control (A) or the Dbnl KD vector (B) was electroporated into the cells along the ventricle at E14.5, and time-lapse images of the multipolar cells (yellow arrowheads) with multiple processes (cyan arrowheads) were obtained from the cortical slices of the electroporated brain after 2 d. The time-lapse images were obtained every 10 min under a confocal microscope. The images obtained every 20 min are displayed. Reconstructed shapes of multipolar cells are shown in A′ (control) and B′ (Dbnl KD). A, B, Images are shown at the same magnification. Scale bar, 25 μm. C, Quantitative analysis of the processes that were observed for the indicated time (N = 4 brains, n = 3–5 neurons per brain, n = 8–20 processes per neuron in each group). D, E, The EGFP plasmid with either the pSilencer-control (D) or the Dbnl KD vector (E) was electroporated at E14.5, and time-lapse images of the migrating cells (yellow arrowheads) were obtained from the cortical slices of the electroporated brain after 2 d. Magnified images of cells indicated by the arrowheads in D and E are shown in D′ and E′, respectively. The time-lapse images were taken every 10 min. The images obtained every hour are displayed. D, E, Images are shown at the same magnification. Scale bar, 20 μm. F, Quantitative analysis of the neurons that have entered the CP (N = 4 brains, n = 17–25 neurons per brain in each group). Error bar indicates mean ± SEM. ***p < 0.001 (Student's t test).
Time-lapse imaging of control multipolar cells labeled with EGFP. Images were captured every 10 min. The movie corresponds to Figure 5A.
Time-lapse imaging of Dbnl-KD multipolar cells labeled with EGFP. Images were captured every 10 min. The movie corresponds to Figure 5B.
Next, to analyze the involvement of Dbnl in the polarization of neurons located around the MAZ, we compared the proportion of migrating neurons whose Golgi apparatus was positioned within 45 degrees from a line drawn perpendicular to the cortical surface between control and Dbnl-KD neurons in the MAZ/SVZ and IZ, by staining the cells with a Golgi apparatus marker, GM130 (Fig. 4A–C′,F–H′,N–P′). Two days after in utero electroporation, there was no significant difference in the proportion of cells whose Golgi apparatuses were positioned on the CP side between the control (37.29 ± 6.49%, N = 4 brains, n = 30–50 neurons per brain were counted) and Dbnl-KD neurons (35.00 ± 5.29%, N = 4 brains, n = 30–50 neurons per brain were counted; control vs Dbnl KD, p = 0.65; Fig. 4E). However, at 3 d after the electroporation, the proportion of neurons whose Golgi apparatuses were located on the CP side were significantly decreased in the Dbnl-KD neurons (40.36 ± 1.24%; N = 3 brains, n = 30–50 neurons per brain were counted) compared with the control neurons (66.76 ± 5.83%, N = 3 brains, n = 30–50 neurons per brain were counted; control vs Dbnl KD, p = 0.0033; Fig. 4I). At 4 d after the electroporation, Dbnl-KD neurons left in the deep IZ exhibited fewer (control: 3.59 ± 0.43, N = 4 brains, n = 10–15 neurons per brain were counted; Dbnl KD: 0.98 ± 0.15, N = 3 brains, n = 10–15 neurons per brain were counted; control vs Dbnl KD, p = 0.0082; Fig. 4L) and shorter processes (control: 50.20 ± 3.15; Dbnl KD: 16.90 ± 1.06; control vs Dbnl KD, p = 0.0021; Fig. 4M) than the control neurons (Fig. 4J–K′). In addition, the proportion of neurons whose Golgi apparatuses were facing the CP side was significantly decreased in the Dbnl-KD neurons (49.47 ± 1.77%, N = 3 brains, n = 30–50 neurons per brain were counted) compared with the control neurons (68.76 ± 1.55%, N = 3 brains, n = 30–50 neurons per brain were counted; control vs Dbnl KD, p = 0.0082; Fig. 4N–Q). These results indicate that Dbnl plays important roles in establishing neuronal morphology and polarization during neuronal migration in the developing cortex.
To investigate whether Dbnl is involved in the morphological transition of migrating neurons beneath the CP, we performed time-lapse imaging of control or Dbnl-KD neurons visualized with EGFP. Control neurons with multipolar morphology gradually switched to a bipolar morphology, with a thick leading process, then entered the CP and climbed up in the CP, one after the other, toward the brain surface (Fig. 5D–E′; Movies 3, 4). In contrast, while Dbnl-KD neurons also switched from a multipolar morphology to bipolar morphology, many of these neurons were unable to enter the CP, resulting in pooling of these migrating neurons below the CP. When we counted the number of EGFP-labeled neurons in the IZ at the beginning of culture and calculated the proportion of neurons that have entered the CP by 36 h in vitro, a larger proportion of control neurons have entered the CP compared with the Dbnl-KD neurons (control: 82.66 ± 8.13%, N = 4 brains, n = 17 to 25 neurons per brain; Dbnl-KD: 19.63 ± 4.17%, N = 4 brains, n = 20–25 neurons per brain, p = 0.00046; Fig. 5F). These results suggest that Dbnl is closely involved in regulating neuronal entry into the CP.
Time-lapse imaging of control migrating neurons labeled with EGFP. Images were captured every 10 min. The movie corresponds to Figure 5D.
Time-lapse imaging of Dbnl-KD migrating neurons labeled with EGFP. Images were captured every 10 min. The movie corresponds to Figure 5E.
Phosphorylations of tyrosine residues 337 and 347 of Dbnl are essential for migrating neurons to enter the CP
In NIH3T3 fibroblasts, Dbnl is phosphorylated at Y337 and/or Y347 by a Src kinase (Boateng et al., 2012). In the developing cerebral cortex, Fyn kinase is thought to be dominant among the SFKs (Cooke and Perlmutter, 1989; Sasaki et al., 2002; Yuasa et al., 2004). Furthermore, Fyn-kinase-dead neurons exhibited defects in neuronal migration, especially during multipolar-to-bipolar transition, abnormal neuronal morphology, and disorientation of their apical dendrites in the developing mouse cerebral cortex (Huang et al., 2017), which are, to some extent, similar to the observations for Dbnl-KD neurons in this study. Therefore, to identify whether Y337 and Y347 of Dbnl could also be essential for the phosphorylation by Fyn, we prepared vectors to express the phospho-resistant form of Dbnl at Y337 and/or Y347 (Dbnl Y337F, Dbnl Y347F or Dbnl 2F [Y337F and Y347F]) (Fig. 2I). These mutant forms of Dbnl were cotransfected into the HEK293T cells with the expression vectors of a constitutively active form of Fyn (Fyn-CA) or a kinase-dead form of Fyn. A lesser degree of phosphorylation by Fyn kinase of Dbnl Y337F and Dbnl Y347F was observed compared with that of the Dbnl WT. Moreover, double mutations at these tyrosine residues abolished the tyrosine phosphorylation of Dbnl by Fyn [n = 6; Dbnl WT plus Fyn CA (1): 1.00 ± 0.00; Dbnl Y337F plus Fyn CA (2): 0.12 ± 0.057; Dbnl Y347F plus Fyn CA (3): 0.12 ± 0.037; Dbnl 2F plus Fyn CA (4): 0.030 ± 0.0076; (1) vs (2): p = 3.71 × 10⁻⁷, (1) vs (3): p = 4.46 × 10⁻⁸, (1) vs (4): p = 4.85 × 10⁻⁹, (2) vs (4): p = 0.019, (3) vs (4): p = 0.0013; Figure 2J,K)]. These results indicate that Y337 and Y347 on Dbnl can be phosphorylated by Fyn in the HEK293T cells.
Next, to examine whether the phosphorylation of Y337 and Y347 on Dbnl is involved in neuronal migration, we introduced the Dbnl-KD vector with an expression vector for either Dbnl 2F or the phospho-mimic form of Dbnl (Dbnl 2E; Y337E and Y347E), in which the Y337 and Y347 residues were substituted with glutamic acid, into the cells in the VZ at E14.5 (control: N = 5 brains; Dbnl KD: N = 5 brains; Dbnl KD plus Dbnl 2F: N = 4 brains; Dbnl KD plus Dbnl 2E: N = 7 brains; Figure 2L–O). Five days later, most control neurons reached beneath the MZ, whereas neurons with Dbnl 2F were still located beneath the CP, which is similar to the migratory defect of the Dbnl KD neurons (bin3: control vs Dbnl 2F, p < 0.001; Dbnl 2E vs Dbnl KD, p = 0.005; Dbnl 2E vs Dbnl 2F, p = 0.01; Fig. 2N). On the other hand, most of the neurons with Dbnl 2E successfully reached beneath the MZ (bin 10: control vs Dbnl 2F, p < 0.001; Fig. 2O). These results indicate that the phosphorylation of Y337 and Y347 of Dbnl is essential for the neurons to enter the CP.
Dbnl controls neuronal migration via αN-catenin/N-cadherin
It has been reported that trafficking of N-cadherin to the neuronal plasma membrane is involved in the multipolar-to-bipolar transition of migrating neurons (Jossin and Cooper, 2011). To examine whether Dbnl regulates the amount of N-cadherin expressed on the plasma membrane, we performed an in vitro membrane N-cadherin assay using an anti-N-cadherin antibody that recognizes the extracellular region of N-cadherin (Hara et al., 2016). Primary cultured cortical neurons were transfected with a Dbnl-KD vector, and the amount of N-cadherin expressed on the plasma membrane was measured by quantifying the amount of N-cadherin antibody bound to the cellular surface. The results revealed that the surface expression of N-cadherin was significantly decreased by Dbnl KD (control: 1.00 ± 0.00; Dbnl KD: 0.30 ± 0.17; N = 4 experiments; control vs Dbnl KD, p = 0.0057; Fig. 6A,B), indicating that Dbnl increases the amount of N-cadherin expressed on the cellular surface.

Dbnl regulates neuronal migration in the developing cortex through regulation of N-cadherin and αN-catenin. A, in vitro membrane N-cadherin assay using primary cortical neurons at E16. The cultured neurons were treated with a guinea pig anti-N-cadherin antibody, and the amount of N-cadherin expressed on the neuronal plasma membrane was measured by quantifying the amount of anti-N-cadherin antibody bound to the neurons. The cell lysates were subjected to Western blotting with an anti-guinea pig IgG antibody and an anti-GAPDH antibody as an internal control. B, A normalized graph represents the guinea pig IgG (N-cadherin)/GAPDH ratio (A) (N = 4 experiments). C, E14.5 mouse embryonic brains were electroporated with the Dbnl-KD vector and pCAGGS-EGFP plus pCAGGS-1 (N = 5 brains), pCAGGS-N-cadherin (N = 4 brains), pCAGGS-αN-catenin (N = 5 brains), or both of pCAGGS-N-cadherin and pCAGGS-αN-catenin (N = 8 brains) plasmids. pSilencer-control vector plus pCAGGS-1 and pCAGGS-EGFP were used as the controls (N = 4 brains). The brains were fixed at P0.5 and sectioned. Each section was stained with DAPI. D, Graph showing the proportion of EGFP-positive cells in each bin. White bar represents Control. Black bar represents Dbnl KD. Gray bar represents Dbnl KD + N-cadherin. Orange bar represents Dbnl KD + αN-catenin. Blue bar represents Dbnl KD + N-cadherin + αN-catenin. The entire cortex in each image was divided into 10 equally spaced bins (bin 1, deepest; bin 10, most superficial). Statistically significant differences were observed in bin 2 (Dbnl KD vs Dbnl KD + N-cadherin, **p = 0.008; Dbnl KD vs Dbnl KD + αN-catenin, **p = 0.003; Dbnl KD vs Dbnl KD + N-cadherin + αN-catenin, *p = 0.025), bin 3 (Control vs Dbnl KD, *p = 0.015; Dbnl KD vs Dbnl KD + N-cadherin + αN-catenin, *p = 0.016), bin 4 (Control vs Dbnl KD, **p = 0.001; Dbnl KD vs Dbnl KD + αN-catenin, **p = 0.009; Dbnl KD vs Dbnl KD + N-cadherin + αN-catenin, **p = 0.007), and bin 9 (Control vs Dbnl KD, **p = 0.007; Dbnl KD vs Dbnl KD + N-cadherin, *p = 0.020; Dbnl KD vs Dbnl KD + N-cadherin + αN-catenin, *p = 0.026). E, F, Graphs represent the proportion of EGFP-positive cells in bin 3 (E) and bin 9 (F). D, Different letters on the bars within the same bin indicate a statistically significant difference between the pair, whereas the same letter within the same bin or the absence of any letters within the bins indicates the absence of any statistically significant difference. Error bar indicates mean ± SEM. Student's t test or one-way ANOVA with Tukey–Kramer post hoc test: **p < 0.01. Scale bars, 50 μm.
Next, we investigated whether the migratory defect caused by Dbnl KD could be rescued by N-cadherin overexpression. Moderate overexpression of N-cadherin indeed rescued the migration defect caused by Dbnl KD, although the rescue effect was not complete (Fig. 6C–F). Dbnl is known to play a role in the reorganization of the actin cytoskeleton by interacting with actin filaments (Kessels et al., 2001). In addition, N-cadherin also interacts with actin filaments through β-catenin and α-catenin, and αN-catenin is a dominant member of the α-catenin family expressed in the IZ of the developing cortex (Ajioka and Nakajima, 2005). Hence, we speculated whether Dbnl might also be involved in the αN-catenin-mediated pathway. As expected, introduction of αN-catenin moderately rescued the migration defect caused by Dbnl KD. Furthermore, coexpression of both N-cadherin and αN-catenin in the migrating neurons almost completely rescued the migration failure caused by Dbnl KD (bin3: control vs Dbnl KD, p = 0.015; Dbnl KD vs Dbnl KD plus N-cadherin and αN-catenin, p = 0.016; bin 9: control vs Dbnl KD, p = 0.007; Dbnl KD vs Dbnl KD plus N-cadherin, p = 0.020; Dbnl KD plus N-cadherin and αN-catenin: p = 0.026; control: N = 4 brains; Dbnl KD: N = 5 brains; Dbnl KD plus N-cadherin: N = 4 brains; Dbnl KD plus αN-catenin: N = 5 brains; Dbnl KD plus N-cadherin and αN-catenin: N = 8 brains; Fig. 6C–F). These results suggest that Dbnl controls neuronal migration via regulating αN-catenin and N-cadherin in the IZ of the developing mouse cerebral neocortex.
Discussion
Disruption of neuronal migration can cause various brain disorders, such as lissencephaly and subcortical band heterotopia. The precise molecular pathway based on the actin cytoskeleton that controls neuronal migration remains unknown until date, despite its importance. In this study, we found that Dbnl is essential for neuronal migration, neuronal process formation during multipolar migration, and polarization of migrating neurons in the MAZ/SVZ and IZ. The functioning of Dbnl in regulating neuronal migration appears to be dependent on the phosphorylation of Dbnl at tyrosine residues 337 and 347. Moreover, Dbnl controls neuronal migration through upregulating the cell surface expression of N-cadherin in the developing cerebral cortex.
Dbnl is known as an adaptor protein containing an ADF-H domain at its N-terminal end, a proline-rich region, and an SH3 domain at its C-terminal end (Larbolette et al., 1999) (Fig. 2I). The N terminus of Dbnl is highly homologous with Drebrin, which is also a member of the ADF-H family and stabilizes F-actin in the brain (Shirao and Obata, 1985). Dbnl contains an SH3 domain and a proline-rich region, the Y337 and Y347 residues of which are phosphorylated by the SFKs in fibroblasts (Boateng et al., 2012), whereas Drebrin does not possess these domains. Our results suggest that the Y337 and 347 residues of Dbnl are involved in the Fyn-dependent phosphorylation of this protein (Fig. 2I–K); therefore, we assume that Dbnl could be a downstream molecule of Fyn, but not Drebrin.
Histological analyses of the Dbnl-KD neurons during neuronal migration and time-lapse imaging of these neurons suggest that Dbnl controls multiple events in migrating neurons located in the MAZ/SVZ and IZ of the developing cortex, as follows: (1) process formation of multipolar neurons, (2) establishment of cell polarity, and (3) neuronal entry into the CP.
The process formation in multipolar neurons may be important for the investigation of environmental cues, for example, those associated with the direction of axonal growth (Tabata and Nakajima, 2003). One of the unique features of the processes of multipolar neurons is their dynamic movements, namely, frequent and repeated elongations and retractions (Tabata and Nakajima, 2003). Actin polymerization and depolymerization are likely to be involved in such dynamic movements. Dbnl is known to be an adaptor protein involved in the organization of the actin cytoskeleton. For example, Dbnl facilitates dendritogenesis and spine formation through interaction with F-actin and other molecules involved in organization of the actin cytoskeleton (Haeckel et al., 2008; Haag et al., 2012). Thus, Dbnl in the multipolar cells may regulate actin polymerization through interacting with F-actin and related proteins, such as Arp2/3 complex and Cobl (Kessels et al., 2000).
Second, establishment of cell polarity is essential for morphological transformation of the migrating neurons. Our results showed that the proportion of neurons with their Golgi apparatus positioned on the CP side was significantly decreased in the Dbnl-KD neurons compared with the control neurons (Fig. 4G–I). The actin cytoskeleton is also important for regulation of the cellular polarity by the Rho-family GTPases, such as Cdc42 and Rac1 (Kodani et al., 2009; Tahirovic et al., 2010). Because Dbnl interacts with the Cdc42 GEF (Hou et al., 2003), Dbnl may play a role in the regulation of neuronal polarity in cooperation with Cdc42. Moreover, we assume that Dbnl affects the formation of multipolar cell processes before the establishment of cell polarity because, when the number of multipolar cell processes were already decreased by 2 d after introduction of the Dbnl KD vector (Fig. 4D), we did not find any differences in the Golgi apparatus location compared with that in the control neurons (Fig. 4E).
The third important role of Dbnl in the migration of neurons is to promote entry of the neurons into the CP. Dbnl-KD neurons could undergo multipolar-to-bipolar transition in the IZ; however, the Dbnl-KD bipolar neurons could not locomote into the CP. Migrating neurons in the locomotion mode require N-cadherin trafficking to be attached to the radial glial fibers (Kawauchi et al., 2010; Jossin and Cooper, 2011). Dbnl was originally identified by a phage-displayed screening for proteins containing the SH3 domain (Sparks et al., 1996). SH3-containing proteins, such as amphiphysin (Wigge et al., 1997), syndapin (Qualmann et al., 1999), Dynamin (Shupliakov et al., 1997), and Cortactin (Kaksonen et al., 2000), which are structurally similar to Dbnl, are known to be involved in endocytosis. Dbnl has also been shown to bind to Dynamin and play a role in endocytosis in cooperation with Dynamin (Kessels et al., 2001; He et al., 2015). Previously, we reported that the introduction of a dominant-negative form of Dynamin into migrating neurons also caused a migratory defect in the IZ (Kawauchi et al., 2010). Therefore, it is possible that Dbnl is involved in N-cadherin recycling during neuronal migration. Indeed, we successfully demonstrated that Dbnl is required for upregulating the amount of N-cadherin expressed on the neuronal plasma membrane (Fig. 6A,B). It should be noted that the defect in multipolar-to-bipolar transition and entry into the CP caused by Dbnl KD was only partially rescued by overexpression of either N-cadherin or αN-catenin, but completely rescued by coexpression of both N-cadherin and αN-catenin (Fig. 6C). These results suggest that the interaction between N-cadherin and αN-catenin under Dbnl signaling may be important for proper neuronal migration in the developing cortex.
In conclusion, we found that Dbnl controls multiple processes during neuronal migration in the developing cerebral cortex. Future studies will be required to understand the molecular machinery involved in these processes regulated by Dbnl.
Footnotes
This work was supported by Ishidsu Shun Memorial Scholarship, Japan; Ministry of Education, Culture, Sports, Science and Technology/Japan Society for the Promotion of Science Grants-in-Aid for Scientific Research (KAKENHI) JP16H06482, JP15H02355, JP15K06745, JP18K06842, and JP18K07855; Naito Foundation; Takeda Science Foundation; Novartis Foundation (Japan) for the Promotion of Science; Kawano Masanori Memorial Public Interest Incorporated Foundation for Promotion of Pediatrics; Keio Gijuku Academic Development Funds; and Keio Gijuku Fukuzawa Memorial Fund for the Advancement of Education and Research. We thank Prof. Huganir and Prof. Sakagami for providing the mouse N-cadherin cDNA and the guinea pig anti-N-cadherin antibody, respectively; and Collaborative Research Resources, Keio University School of Medicine, for technical support and supply of reagents.
The authors declare no competing financial interests.
- Correspondence should be addressed to Kazunori Nakajima at kazunori{at}keio.jp


